Flag breakout after previous Spring setup - SOLSolana was consolidating after an excellent move up.
The consolidation looks like flagging to me and happened on lowered volume which is what we want to see.
Price pulled back to the previous support where it bounced and formed a pin bar indicating my favorite Spring action setup. The Spring offered a 1 to 1 opportunity for scaling out.
Now there was a visible breakout of the flag formation. We want to see a test on lower volume and then the price action target I typically use is the 161% Fibonacci extension therefore fairly reasonably Solana can reach easily 150 in the next run before meeting some logical price action resistance zone.
AB=CD

Bitcoin - pump to 43777, then crash to 34000Bitcoin is currently going up in the short term, but do not fall for this uptrend. It's clear that the downtrend will continue, and we will see a huge dump to 34,000, probably in March. As per my Elliott Wave count, we have finished a huge impulse wave, and now we need to make an ABC correction so we can go higher to 100,000 in 2025. Wave A is complete; now we are in wave B, the corrective move. Why is 34k strong support? We have a 0.618 Fibonacci retracement on this level and also a pretty huge gap. Let me know what you think about my analysis, and please hit boost and follow for more ideas. Trading is not hard if you have a good coach! Thank you, and I wish you successful trades.
How Much Bitcoin Is in Circulation?
Bitcoin’s total supply is limited by its software and will never exceed 21,000,000 coins. New coins are created during the process known as “mining”: as transactions are relayed across the network, they get picked up by miners and packaged into blocks, which are in turn protected by complex cryptographic calculations.
As compensation for spending their computational resources, the miners receive rewards for every block that they successfully add to the blockchain. At the moment of Bitcoin’s launch, the reward was 50 bitcoins per block: this number gets halved with every 210,000 new blocks mined — which takes the network roughly four years. As of 2020, the block reward has been halved three times and comprises 6.25 bitcoins.
Bitcoin has not been premined, meaning that no coins have been mined and/or distributed between the founders before it became available to the public. However, during the first few years of BTC’s existence, the competition between miners was relatively low, allowing the earliest network participants to accumulate significant amounts of coins via regular mining: Satoshi Nakamoto alone is believed to own over a million Bitcoin.
Mining Bitcoins can be very profitable for miners, depending on the current hash rate and the price of Bitcoin. While the process of mining Bitcoins is complex, we discuss how long it takes to mine one Bitcoin on CoinMarketCap Alexandria — as we wrote above, mining Bitcoin is best understood as how long it takes to mine one block, as opposed to one Bitcoin. As of mid-September 2021, the Bitcoin mining reward is capped to 6.25 BTC after the 2020 halving, which is roughly $299,200 in Bitcoin price today.

🚧VVUSDT will Go Up Again🚧 Road Map(1-D)🗺️!!!Hi.
➡️As you can see, VVUSDT is completing this pattern, and if it follows this pattern Price can grow a lot.
🟡Summery:
-VVUSDT has been Bullish Recently!
-The odds of another Bullish Movement is High!
-Bullish Pattern is Visible on The chart!
-No break out yet!
-AB=CD
🤑Stay awesome my friends.
_ _ _ _ _ _ _ _ _ _ _ _ _ _ _ _ _ _ _ _ _ _ _ _ _ _ _ _ _ _ _ _ _
✅Thank you, and for more ideas, hit ❤️Like❤️ and 🌟Follow🌟!
⚠️Things can change...
The markets are always changing and even with all these signals, the market changes tend to be strong and fast!!

Strong swing level on EURUSDAsset: EURUSD
Bias: Bullish
Price range: 1.0765 ~ 1.0735
Confluences;
61.8% retracement of 2023’s 4th quarter bullish rally
100% extension of the first bearish wave from 28 Dec to 5 Jan (Healthy corrections appear in 2 equal legs) (Elliot wave) (Harmonics)
The lowest level reached in Dec 23, price flirted but never closed below this level during Dec 23.
3rd touch emerging. It takes 3 touches to confirm a trendline, so with 2 touches so far we are anticipating a hold of this level, at least temporarily.
Invalidation level: A close below 1.0730 opens the window for price to reach the 2023 Opening level, at that point we will recalibrate our analysis.
Volatility: On Tuesday morning the 2 biggest economies in the eurozone are releasing GDP figures, 8.5 hours later the US is set to release consumer confidence and job openings data. Massive day on Wednesday as both euro powerhouses are unleashing their inflation rate and later that night we have FOMC. NFP on Friday.

Wyckoff Upthrust - EURAUDThat can be a valid entry for an Upthrust from an obvious support/resistance line. Previous high taken and price reverses. Some people call this a fake-out, you can see it as a double top in a downtrend. It's a matter of interpretation.
The longer target is the 1 to 1 AB = CD shown in the chart.
Higher timeframe confluence:
Daily is below 10 EMA although overall in an uptrend, but my bet is an ABCD correction down.
The Entry bar is a solid Engulfing bar on raising volume. We shall see.

ABCD Pattern in ICICIICICI bank is going to give a good move above 1000 levels,
950 is strong support.
We can see 1100 levels in coming days

BTCUSDT - Bullish momentum incoming?BINANCE:BTCUSDT has been in a downtrend, however, bullish divergence is present on smaler timeframes indicating imminent bullish momentum if the last High is broken!

Ethereum - best plan for the next 30 daysEthereum is going down, but soon it will approach strong support. There is something missing on the chart, and in my opinion, it's this right shoulder of a head and shoulders pattern. It's pretty likely that Ethereum is going to go sideways for the next 30 days, but what you can do is buy low in the range and sell high in the range. After we complete the head and shoulder pattern, the price will decide which way it's going to go. Let me know what you think about my analysis, and please hit boost and follow for more ideas. Trading is not hard if you have a good coach! Thank you, and I wish you successful trades.
What Is Ethereum (ETH)?
Ethereum is a decentralized open-source blockchain system that features its own cryptocurrency, Ether. ETH works as a platform for numerous other cryptocurrencies, as well as for the execution of decentralized smart contracts.

Bitcoin will continue to crash to 33 500, then pump to 100 000Bitcoin is crashing, that's clear, but will this downtrend continue? It is very likely that it will. Why? We can see that the price already touched the top of the parallel ascending channel on the weekly chart and got rejected from it. What's more, we complete the impulse wave, and we are already in the corrective ABC pattern, which should be a zig-zag style. There is still an unfilled fair value gap between 30k and 34k.
How deep can Bitcoin dive? It is always good to take the Fibonacci retracement tool and look for the 0.382 and 0.618 levels. We need to take into consideration a support trend line of the ascending channel, which is a dynamic support that changes over time, but it's near the 0.618 FIB. Also near the 0.618 FIB, we have the end of the specified FVGAP.
January is usually not the best month for the price of Bitcoin. Usually the big pumps start in April; we have more than 2 months of possible downtrend. Currently, I am very bearish on Bitcoin and expect lower prices.

#NZDCAD: 500+ bullish buying opportunity! Swing TradingDear Traders,
We have a great opportunity on NZDCAD , please wait for price to come and bounce at our area of entry. Price already have breakthrough the bearish strong trendline meaning price have changed the character for the first time since months. Now price that has not yet re-confirmed that price can continue the bullish trend and we can have a swing trade taken.
Please wait for price to do its thing, do not rush. Patience pays!

Easy 2618 Bear TC OpSo we have identified what should be a live and confirmed reversal on UJ. A simple Double Top and then the confirmed reversal with the break and close below the V neck of the original Double Top. The should now move into more of a Trend Continuation opportunity now that we have broken and closed beyond the previous structure. Lets see how it plays out.

EURUSD - Wyckoff Upthrust - Support/ResistanceLonger term direction:
4H chart is in a downtrend, with a visible Resistance level where we try to enter. Also, the daily chart has 10EMA below 20EMA.
Potential Wyckoff Upthrust with a good Outside bar for entry at the 2H chart that can give an excellent risk-to-reward trade.
Target1 is 1 to 1 move or the nearest low and Target 2 is the 161% Fibonacci extension.
If you close half at 1 to 1 and then leave a runner for the 161% Extension - you'd have 3.5 RR.

The Duality of PatternsEURJPY presents an interesting scenario with a potential combo trade, or is it? Let's break it down:
1. 4-Hourly Bearish ABCD Pattern:
- Retest completion at 161.74.
2. Daily Bearish Bat Pattern:
- Completion at 162.55.
Two patterns, two different starting points. Is it a combo or a dual setup?
Share your thoughts and let's navigate this intriguing trade opportunity together!

LINKUSD, EW - Completion of complex wave 4 - $11 targetJust a thought/idea re. chainlink near term.
The higher timeframe 5 wave impulse is not complete, nor does it appear that wave 4 is complete.
I think a move down to $11 is possible in the short term. That said, the A/D indicator (accumulation/distribution) is printing a divergence on time frames lower than 12h. Longer term, I think link is headed to $27.

NVDA: Bearish ABCD above the Trading Range Targeting $272.42NVDA has risen above the trading range but has started to print weaker Bearish candlestick patterns on the Daily as it approached the PCZ of a potential Bearish ABCD pattern. At this point in time it seems like NVDA will fall short of $600 then come back down to its last official support level which was at $272.42, if 272.42 doesn't hold then it could go into the one hundreds or even below $100 to around $80 but $272.42 is the main target.

Bear cycle lead to crypto wash down Here is new analysis bitcoin will drop harder then ever in history you know why fail maths combined with usd drop 20k 1st target good luck folks

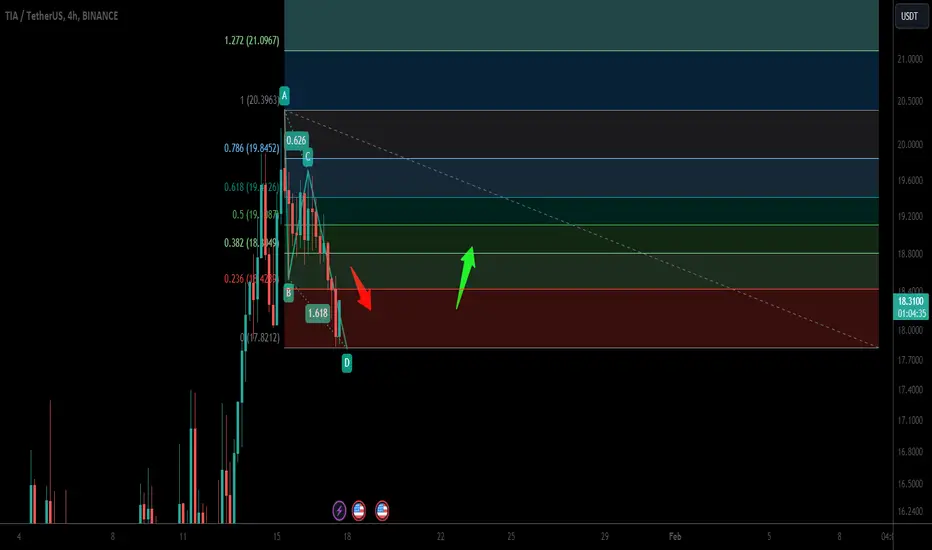
Celestia (TIA) completed a setup for the next pumpHey dear members, hope you are well, and welcome to the new trade setup of Celestia (TIA).
Recently we caught almost 76% pump of TIA as below:
Now on a 4-hr time frame, has formed bullish AB=CD move for the next price reversal.
Note: Above idea is for educational purpose only. It is advised to diversify and strictly follow the stop loss, and don't get stuck with trade.
Pendle is pumping, how much % can it make? (342%)Pendle is one of the stronger coins currently on the crypto market. We can see that we have had a pretty long consolidation where whales were accumulating coins. Of course they want to make money, so they sent the coin to the upside. We can see that the uptrend is starting to be parabolic, which is very good because you can make a lot of money in a short period of time. My profit target is the 2:2 FIB extension, which is 342% profit from the current price if you buy the coin right now.
About Pendle - Pendle is a protocol that enables the tokenization and trading of future yield. With the creation of a novel AMM that supports assets with time decay, Pendle gives users more control over future yield by providing optionality and opportunities for its utilization.
Let me know what you think about my analysis, and please hit boost and follow for more ideas. Trading is not hard if you have a good coach! Thank you, and I wish you successful trades.

DXY moving upThey
would turn against you, subvert your wishes, disobey you out of sheer perversity. He once told a friend, “I
learned that you actually have more power when you shut up.”

Gold Bearish ComingIn my opinion gold is in overall bearish movement I just share a picture of bearish rally.
Gold price after another false breakdown of support and retest of the liquidity zone forimizes the rally and tests 2040. Most likely the target for the market is embedded higher, around 2048-2050


Long on Eth, AB=CD pattern R/R=3.5After a rally and the price gets stuck in a channel, it is expected that the price can grow as much as the previous rally after exiting the channel.
R/R=3.5 and safe for long

Beam, consolidation is coming to the end, buy now (151% profit)Beam Rank #69 is a very good-looking coin from a technical perspective. We had a strong pump of 500% In November 2023. Now the price is going sideways, but it is time for another pump. It's good to buy this coin right now, as it can skyrocket anytime soon. We have a strong Elliott Wave combo Impulse + ABC correction. 1.618 FIB extension is the next profit target, but I believe we will go much higher than that! Make sure you buy the right BEAM coin, as there are 2 with the same name. Let me know what you think about my analysis, and please hit boost and follow for more ideas. Trading is not hard if you have a good coach! Thank you, and I wish you successful trades.
Beam allows financial counterparties to make safe, stable and reliable transactions. This helps eliminate the problem of user data mismanagement, keeping the system cleaner and more secure. Beam’s blockchain was built on the C++ programming language from scratch.
User addresses are kept confidential at all times and are never disclosed to any third parties. Users have total access and control over their privacy, deciding who can access their information and what they are allowed to see.
Beam supports custom transactions of different types, such as escrow, atomic swaps and time-locked ones. Let me know what you think about my analysis, and please hit boost and follow for more ideas. Trading is not hard if you have a good coach! Thank you, and I wish you successful trades.
