US30 SHORT POSITION IDEALooking for US30 to continue shorting, although the previous swing structure did not reach premium, this for me is a c setup
AB=CD

USDCAD - Bearish Structure Trade Using ABCD PatternsA look at as potential bearish structure trade on the USDCAD using previous structure resistance & multiple AB=CD patterns to build our case for entry.
If you have any questions or comments about the idea, or if you just want to share your own views, please leave it in the comment section below.
Akil

Technical Analysis & Trading StrategiesIn the upcoming week, the spotlight might be on NZDJPY, particularly for those who lean towards structure-based trading methods.
In this scenario, we marry technical analysis with the art of trading.
Observations:
A keen eye at the support level reveals an ABCD pattern checkback on the 4-hourly chart, situated at 86.84.
For Fib-3 Bat enthusiasts, a buying opportunity may materialize on the 1-hourly chart.
Now, the pivotal question: What would be your approach to NZDJPY? Your insights matter. Please share your perspective below!

USDX🔥 Weekly timeframe of USDX🔥
Remember that just because price gets to either a Buy or Sell level doesn't mean you trade blindly. Always look out for other supporting factors to validate your trade. The more factors there are, the higher the probability of success!
Success we all pray for new week
Ameen!!
*_#trade with caution_*

USDX🔥Still on Leg 1(i)
We expect it to cover up Leg1 (ii & iii) Before we SPIKE down to Leg2📉📉
Patience is the key 🧘🎉
Remember that just because price gets to either a Buy or Sell level doesn't mean you trade blindly. Always look out for other supporting factors to validate your trade. The more factors there are, the higher the probability of success!
Success we all pray for new week
Ameen!!
*_#trade with caution_*

NASDAQ INDEX (US100): Classic Gap Trade
Have you seen a gap on US100 Index?
It can provide us with a great trading opportunity.
Chances are high that the gap will be filled soon.
I suggest buying the index anticipating a test of 13350.
❤️Please, support my work with like, thank you!❤️


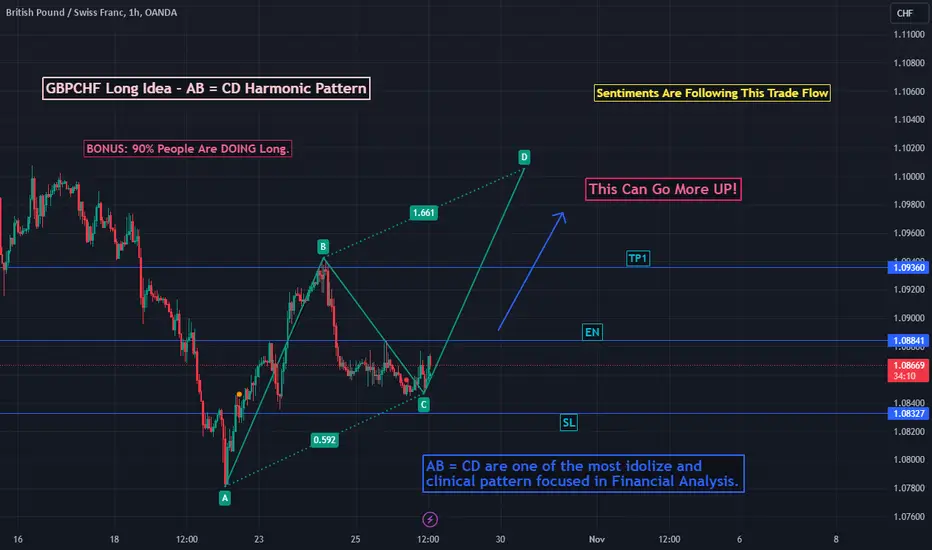
GBPCHF Technical Analysis: Sentimental High Probability Call.In-Depth Technical Analysis: A Bullish Opportunity in GBPCHF
Delve into a comprehensive technical analysis of GBPCHF, driven by a complex harmonic pattern on the price chart. Notably, market sentiments are aligning with this trade, increasing the likelihood of reaching our target."
This version provides a clearer and more concise presentation of the information while maintaining the key points of your analysis.
Btc short long timeMy opinion from this analysis is that this climb has no meaning and according to the technical analysis Bitcoin should clear the range of 8 thousand dollars, it is better to protect your account with capital management. Bitcoin has a very long way to climb. has ahead

EURUSD is bullish now and many Traders don't see it 👀!!!EURUSDT is in an ascending triangle which means the price is about to do a good bullish movement. The price can increase as much as the measured price movement ( AB=CD ) .The break out needed for increasing further has not happened but it should happen pretty soon.
Also, hidden bullish divergence makes this analysis more accurate.
_ _ _ _ _ _ _ _ _ _ _ _ _ _ _ _ _ _ _ _ _ _ _ _ _ _ _ _ _ _ _ _ _
✅Thank you, and for more ideas, hit ❤️Like❤️ and 🌟Follow🌟!

Waltonchain (WTC) formed bullish AB=CD for the next pumpHi dear friends, hope you are well and welcome to the new trade setup of Waltonchain (WTC) with BTC pair.
Recently we caught a nice trade of WTC as below:
Now on a 4-hour time frame, WTC has formed a bullish AB=CD move for the next bullish reversal.
Note: Above idea is for educational purpose only. It is advised to diversify and strictly follow the stop loss, and don't get stuck with trade.

TSLA: Bearish Harmonic Test of Neckline To Bring it Down to $25TSLA after bouncing back up thanks to a Bullish ABCD with Bullish Divergence is now backtesting the Neckline area of a Bearish Head and Shoulders while Filling a Gap at the PCZ of a now Bearish ABCD that it's formed on the way back up a leading into this zone and now it may make its way back down to about $25.00

Daily Direction for GBPUSDThe bears continue to push price lower, as 1.22500 is within reach, would price be able to reach this quarter point and trigger the D point of the ab=cd pattern?

Bullish Trend PerspectiveThe weekly chart for EURUSD indicates that 1.0452 is the Last Support.
Before considering a buying opportunity, I will wait for the 1-1 pattern retest at 1.0440 on the 1-hour chart.

Xauusd-Two legs are complete!Gold has reached the important daily supply area, it is expected to drop to the 50% Fibonacci level which is accompanied by daily demand.

US Oil Long Trade - SL Previous Swing LowMany Fibonacci and Harmonic Confirmations
Bullish - Butterfly Harmonic ,
With Expanded Flat ABC Elliot
C = 1.618 A
1.618 AB = CD ( PRZ As per AB=CD Pattern )
0.50 Retracement Levels
Trade at your own decision , I'm not a financial adviser.

👑 SPY 🗝️LEVELS TO WACTH👀Hello, traders! 👋 Welcome to another technical analysis. Today, we're taking a closer look at SPY.
The chart illustrates a symmetry AB=CD pattern, which appears to be bullish on its daily chart. The price has reached an important support level at "D" 422.30000.
The strategy is straightforward: we will buy above the entry level (EL) at 427.10000 with a confirmed upward trend. Our stop-loss will be placed below the cluster zones at ST: 418.12379.
Our target levels will be as follows:
First target at 62% of AD: 445.20349- 79% of AD: 451.35905
Second target at 127% of AD: 469.70833-162% of AD: 482.52695
If you find this analysis interesting and useful, please show your support by liking and following. Stay tuned for more analyses like this one!

👑 NAS100 🗝️ LEVEL TO WATCH 👀 AND WHY🤔Hello Traders👋, and welcome! Today, we are having a look at indices.
The NAS100 chart on the daily timeframe illustrates an AB=CD bullish pattern. This pattern exhibits perfect symmetry in the swing from AB to CD. As we can see, the price has broken above the long entry level (EL) at 14677.2, indicating a possible bullish scenario.
Stops are set below point D (ST) at 14417.3, and targets are set at 62% of AD, which is 15353.4, and 78% of AD, which is 15611.1 to begin with.
I hope you find this technical analysis useful. If you do, please support the idea with a like, and stay tuned for more analyses like this by following."
TCPLTP

PHB Phoenix Global forming a bullish AB=CD for upto 26% pumpHi dear friends, hope you are well and welcome to the new trade setup of PHB Phoenix Global (new) with US Dollar pair.
Previously we caught more than 26% pump of PHB as below:
Now on a daily time frame, PHB is about to complete a bullish AB=CD move for the next price reversal.
Note: Above idea is for educational purpose only. It is advised to diversify and strictly follow the stop loss, and don't get stuck with trade.

Nas100Soory fried i Can’t share chat whole one month due to family problem
So from today we daily update you
Nas100 look strong for sell

GOLD Buy On Dipany dip will be the buying oppertunity
AB=CD pattern completed on 1813
divergence on 4hr charts


YGG to the bonk?Hi Fellow Traders i hope you get an idea in my technical analysis.
YGG rejected from 618 of swing low to high with confluence of 618 fib speed fan and bounce to .5 of swing high to interim low with confluence of .382 speed fan and value area high.
if price dont mange to reclaim the high i see price will retest .618 area and if respected im looking for harmonic partern (garley) "level to level charting "
(this is only an idea if price respects the TA)
