WAX (WAXP) formed bullish AB=CD for the next pumpHi dear friends, hope you are well and welcome to the new trade setup of WAX (WAXP) coin with US Dollar pair.
Previously we caught almost 46% pump of WAXP as below:
Now on a 2-hr time frame, WAXP has formed a bullish AB=CD move for the next pump.
Note: Above idea is for educational purpose only. It is advised to diversify and strictly follow the stop loss, and don't get stuck with trade.
AB=CD

SP500 REVERSAL FORMATIONThere is an AB=CD pattern that targets the channel lower band.
Also, EMA 200 coincides the lower band.
These two arguments renders the channel lower band a strong support which makes me think that this can be a reversal level.

LONG ABCD DAILY GOLDWe can see an ABCD pattern forming at the 1850 level.
I am inputting an order to buy there with a stop at 1840.

Bitcoin dichotomy Double Bottom, Harmonic or Elliott WaveAn interesting junction approaching whereby Elliott wave versus Harmonics?
So which will win as we are in a motive phase wave (4) or a bullish leg(CD) of a possible Bearish Pattern? We have to remember according to Elliott Wave Rules if (4) exceeds (1) then this Motive Phase down is invalidated at $28,555!
Harmonic Patterns:-
davecharts.files.wordpress.com
Double Bottom:-
thepatternsite.com
Basic Motive Phase:-
thepatternsite.com

UJ: “ABCD-EXT” Setup on “Limit” Entry (3/100)System has identified a “ABCD/Fib-Ext” playbook setup and set sell limit entry during the first hour of the ASIA 12-Candle Window.
RISK: 1R
TARGET: 4R
***DISCLAIMER***
This is a new system based strategy being live tested for the purpose of gathering data. The system generates between 3-6 signals per session upon detecting a qualifying setup and entry signal. Currently being tested only in ASIA and only using USD/JPY pair. The win rate and expectancy are unknown. Please do not take these trades.

GOLD👑 (XAUUSD) KEY LEVEL TO WATCH 👀AND WHYMany skills are required for trading successfully in the financial markets. They include the abilities to evaluate a company's fundamentals and to determine the direction of a market trend. But neither of these technical skills is as important as the trader's mindset.
The recognition of patterns and its body of knowledge of how to react and what to expect helps a trader's success.
Traders are always analysing Trends and Reversals. Their eternal question for traders is Can the trend continues?. Knowing trends and trend reversals are critical for any trader’s success.
Chart patterns classification of 'Continuous' or 'Reversal' patterns helps traders to identify specific patterns and expect their outcome from current price action.
Traders move prices between key support and resistance areas (a tug of war) as their perception shifts between optimism and pessimism. This movement of price adhering to key support and resistance areas create chart patterns.
Reversal patterns exhibit a total shift of trends from bullish to bearish or bearish to bullish in a single pattern structure.
Examples of the reversal patterns are 'Head and Shoulders, Double Tops and Bottoms.
A knowledge of reversal patterns helps traders to estimate the 'end of trends' to execute trades in a timely fashion for maximum gains.
This knowledge also helps traders to time the trades in the opposite direction and to place smaller stop levels.
Here I discuss one of the key reversal patterns
Chart Pattern and present examples of them.
GOLD has been trading an ABC Bullish Pattern from 1804.76, little I know about ABCS:
One of the best ways to confirm symmetry in the markets is to check price and time using two or more cluster confirmations. Another key method to compute these patterns is to use percentage change of price between market highs and market lows. Symmetry is a science by itself, and traders take great advantage of knowing the potential turning points and levels using these methods.
Symmetry is visible in all markets and in all time-frames. Symmetric rallies and declines give traders an advantage to determine the key turning points. A cluster of similar extensions and similar retracements at key price ranges, or some important levels provide insights into future significant resistance and support levels. In addition to knowing key turning points, the benefits of trading symmetric price and time cluster levels include low-risk trades.
The ABC Chart pattern and its related AB=CD Chart Pattern are prime examples of "Symmetry" in the markets. These "Harmonic" patterns help traders to identify buying and selling opportunities in all markets and in all time-frames. The ABC and AB=CD patterns are first described by H.M. Gartley in his book 'Profits in the Stock Market." (1935). The main advantages of trading harmonic patterns are that they allow traders to determine risk vs. reward ratios beforehand as they forecast key market turning points and profit targets for traders. The ABC pattern (can be a continuous or reversal pattern)
The key point in identifying an ABC and AB=CD patterns is to correctly detect the A, B, and C key inflection (Pivot) points in a chart while they are forming. These inflection points are determined from key swing highs and lows of various levels, and for its correction waves to determine distinct "swings." The potential C point is usually forecasted by the fib. retracements (0.38 to 0.618) of AB Swing. Once A, B, and C points (and AB, BC legs) are identified, a projection algorithm is applied to compute the Potential Completion Zone (PCZ). This PCZ area is where ABC pattern is expected to complete and may signal continuation of its trend in the first trend direction (AB). Following the completion of BC leg, the projections of AB and BC legs (using fib. ratios)
The swing legs (AB and BC) in ABC pattern are generally in symmetrical proportions both in price and time with consistent slopes. The tractable CD leg has a harmonic relation with symmetry for AB and BC swings. The ABC bullish structures are formed after a prolonged prior down trend or consolidation trends.
A Pattern Completion Zone (PCZ) is computed using AB swing and Fibonacci ratios (50-88.6% of AB). This PCZ area is where 'C' pivot is formed at the end of BC swing and to signal completion of ABC pattern.
Trade Entry:
After ABC pattern is completed, it is advisable to wait for the pattern to confirm a reversal signal using any momentum-based indicator or price confirmation mechanisms. I use various confirmation and trade entry methods, but one of the methods is price crossing 2-bar high after 'C' in ABC Bullish pattern or a 2-bar low after 'C' in ABC bearish pattern.
Stop:
A Stop is placed few ticks below C (in Bullish) or few ticks above C (in Bearish) levels.
Targets:
The ABC Pattern targets are computed using the AB and BC swings. The height pattern (AB) is used to project target levels from (-level using fib. ratios. The first target zone is (62-79% AB) from 'C' and second target zone is (127-162% AB). A secondary target level is set at 100% AB Level .
In resume price has reached the 100% AB: 2040.55.
Now what could we expect from price?
As mentioned above The ABC Chart pattern and its related AB=CD Chart Pattern are prime examples of "Symmetry" in the markets.
Gold on the daily chart the price resembles an AB=CD and the price is trading below the entry level 2012.36.
Stops: 2068.32
Targets:
38% AD: 1928.00
50% AD: 1890.61
62% AD: 1853.38
79% AD: 1800.41
Let me explain more about AB=CD patterns below


UK100 LongIn continuation to Analysis of UK100 on 11th September, the price has retraced 50% after breaking the down trend. It is time to take long positions and aim for 7900 above which could be reversal as shown by AB=CD pattern.

AUDCAD Harmonics PatternIt is Forming AB=CD and there is no Divergence. First trading it till the PRZ level with 1:1 Risk Ratio and then at PRZ we will look for divergence if we find any divergence then we will long it on HL and HH. If there will be no divergence then we will wait until it forms

Down Weeks Ahead for UPSWeekly chart of UPS
UPS in the third impulse wave of its Corrective Wave (red coloured wave). However, we are only half-way into the third impulse corrective wave.
UPS had a support at 155 level, which it lost yesterday.
UPS is below 50 and 200 SMAs.
During the third impulse wave of the Motive Wave (green coloured wave), UPS made a large gap from 125 to 135. There is a support just below this region. That's where UPS is likely to stop its current downtrend.

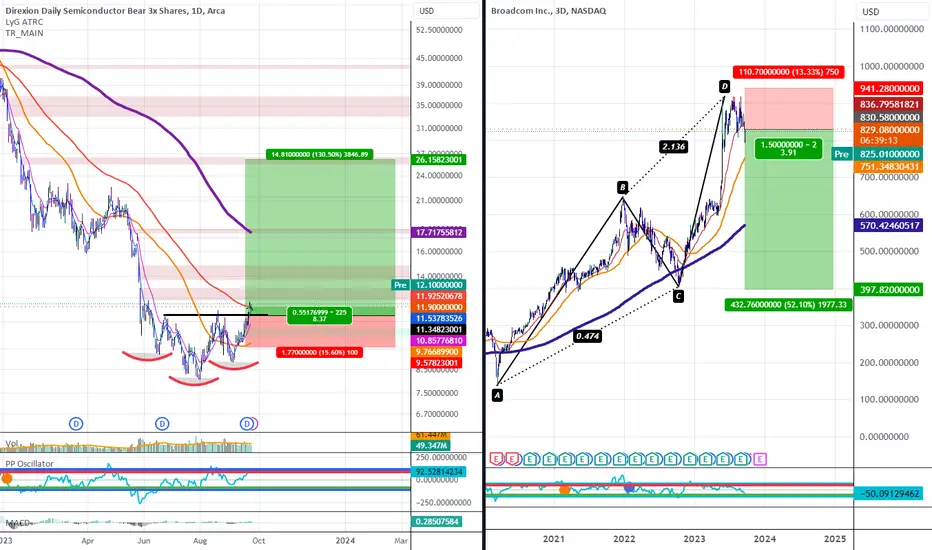
AVGO and SOXS Preparing to Move BigSOXS the 3x Inverse ETF for Semiconductors, has broken out of a Bullish Head and Shoulders and now sits at the 89EMA. If things go as expected, SOXS should be clear to at least give us a 60-150% rally. At the same time, we also have a Bearish AB=CD on AVGO and what looks to simply be filling of a gap it made at $830 after breaking below its own slanted Bearish Head and Shoulders neckline as seen here:
If things go as I expect them to, we will see AVGO open the week to aggressive downside with minimum overall targets as deep as 50% below current prices.
Counter-Trend Trading OpportunityEURUSD is currently experiencing a bearish trend, but for those who are counter-trend traders, there may be an opportunity to buy at the AB=CD pattern completion at 1.0602.
It is important to wait for confirmation from a magic candle confirmation before executing this strategy.
The initial stop-loss should be set at 1.0562 (-40pips) or -400 USD/lot.
Our first target should be set at 1.0668(+66pips) or +660 USD/lot.
Before making any trades, it's critical to do your own analysis and follow your trade plan.
As always, it's essential to approach investment opportunities with care and caution. But if you're ready to take a calculated risk, this could be an exciting opportunity for you. Happy trading!

Merit Circle (MC) formed bullish AB=CD for upto 22.50% pumpHi dear friends, hope you are well and welcome to the new update on Merit Circle (MC) token with US Dollar pair.
Recently we caught almost33% pump of MC as below:
Now on a 4-hr time frame, MC has formed AB=CD move for the next price reversal.
Note: Above idea is for educational purpose only. It is advised to diversify and strictly follow the stop loss, and don't get stuck with trade.

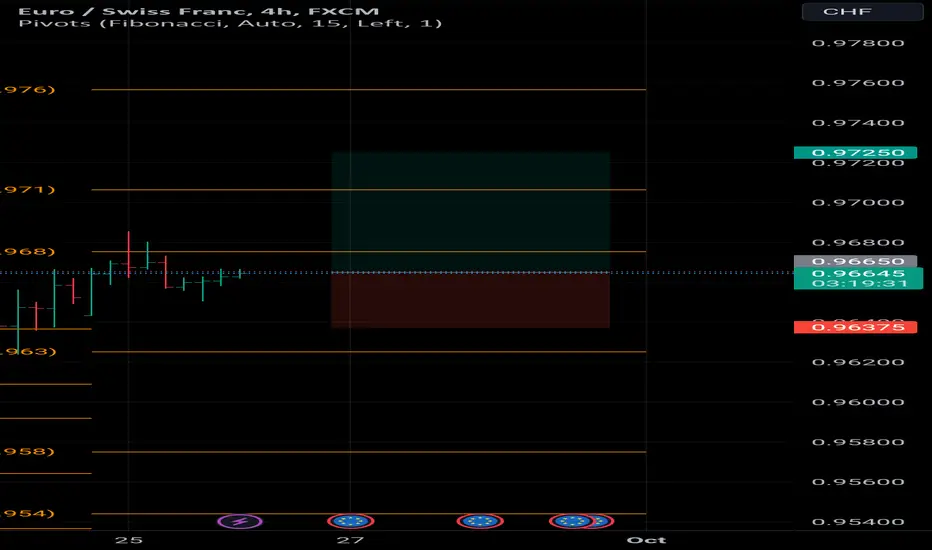
USDCHF H1 DEEP CRAB + ABCD + RSI DIVERGENCEHello traders. I see DEEP CRAB pattern, ABCD pattern and RSI divergence on USDCHF H1 chart. At the same time, based on the Elliott wave count, I predict that the price is approaching the end of the 5th wave.
TARGET 0.89380
STOP 0.90120
Good luck everybody.

AUDUSD ShortHello All,
I am sharing my technical analysis on AUDUSD, if we draw XABCD pattern in this chart, we can see two target here. Keep maintaining Trail SL 30 PIPS always.

USDJPY LongHi All,
Let's take long shot one USDJPY now and see the triangle pattern here we might see some upside momentum here in Midterm.
Thanks

META Ready to Get HammeredMonthly chart on META
META has been on a bull run for a year. Take a look at the Heikin Ashi green candles in the uptrend. Not one red candle.
META is now showing first signs of weakness. In last two months, candles formed lower highs.
A huge AB=CD pattern is nearly complete.
META to make one run up to 360 before going down to 280 and then to 200 levels.

MATICUSDTIs MATICUSDT getting ready for some serious bull run?
It seems like the MATICUSDT is in the formation of ABCD pattern.
If the CD leg plays perfectly it will be a sky rocket.

Contrasting Trends, Caution AdvisedIt is crucial to have a good grasp of how to interpret the market before making any trades.
Although the current pound dollar movement leans towards bearish, the weekly chart indicates a positive trend.
To capitalize on this, trend traders should sell, while counter-trend traders can take advantage of a shorting opportunity at 1.2317.
The buy zone lies between 1.2313 to 1.2689, with a weaker bullish movement on the weekly chart.
Remember to always conduct your own analysis and avoid blindly following others. If you're interested in learning more, feel free to chat with me.
