SEIUSDT LONG 1DBullish Trend
Entry on Trendline
Expecting bullish trend will continue
AB==CD extra confirmation
AB=CD


Novo 1h longShould get up and at least break the neckline from the bigger SHS/IHS.
Stop below zone or lower trendline.

GOLD LONG VIEW.............
Hello Traders, here is the full analysis for this pair,
let me know in the comment section below if you have any questions,
the entry will be taken only if all rules of the strategies will be
satisfied. I suggest you keep this pair on your watch list and see if
the rules of your strategy are satisfied.
Dear Traders,
If you like this idea, do not forget to support it with a like and follow.
PLZ! LIKE COMMAND AND SUBSCRIBE

BTCUSD / BITCOIN | 4H | WAIT BREAKOUT Good morning, my friends
Bitcoin support level is $96,900.00, while the resistance level stands at $104,600.00.
Right now, I'm just waiting for an upward breakout. Once that happens, I'll provide a clear target.
Don't forget to hit the like button so you don't miss any updates on this analysis.
My dear friends, your likes are the biggest motivation for me to keep sharing my analyses. I truly appreciate everyone who supports my work with their likes—thank you so much!
With respect and love.

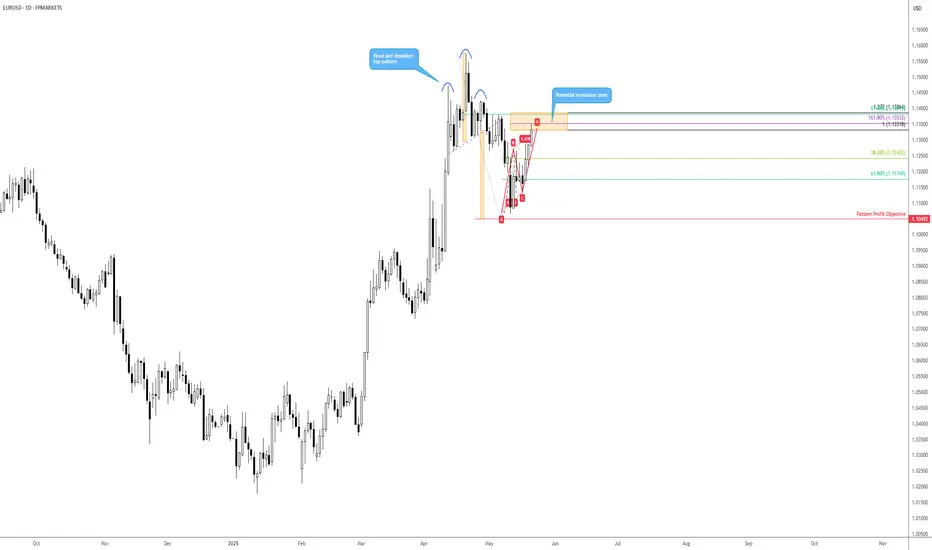
EUR/USD resistance calls for attentionFollowing the EUR/USD (euro versus the US dollar) trading within striking distance of a head and shoulders top pattern’s profit objective at US$1.1049, bulls went on the offensive. Consequently, price has pencilled in an AB=CD bearish formation at US$1.1332, according to the 100% projection ratio and a 1.618% Fibonacci extension ratio of US$1.1353 (B-C reciprocal). However, in terms of a resistance zone, I would be inclined to include the 1.272% Fibonacci projection ratio at US$1.1386, which shares chart space with a 61.8% Fibonacci retracement ratio from US$1.1382.
Harmonic traders tend to target the 38.2% and 61.8% Fibonacci retracement ratios derived from the A-D legs, which, assuming a temporary peak in price at current levels, reside at US$1.1242 and US$1.1175, respectively.
Gold to infinity and beyondSince April 22, Gold has completed an ABCD pattern and appears to be in a strong uptrend. Ride it to infinity and beyond.

USDJPY:Is it a beginning of major bullish trend? Read CaptionThe price of USDJPY has shown a mixed volume, making it difficult to determine the trend. However, if we analyse the data, we can see that USD is gaining strength in the coming time. This could be due to the strong news coming in this week, which may divert the USDJPY towards the 150 price region. There are four potential targets that price could hit and surpass. Please use this analysis solely for educational purposes, as it does not provide any guarantees.
Good luck and trade safely.
Thanks for your support! 😊
If you’d like to help us out, here are a few things you can do:
- Like our ideas
- Comment on our ideas
- Share our ideas
Team Setupsfx_
❤️

EAST it's easy, but only for professionals, long term positive.#EAST timeframe 1 day
Created a bearish AB=CD pattern
Sell point around 34.90
Stop loss / reentry 35.85 (estimated loss -2.77%)
First target at 33.00 (estimated profit 5.00%)
Second target 31.95 (estimated profit up to 8.60%)
MACD supports this idea
NOTE: this data is according to timeframe 1 day.
NOTE: stock remains positive for long term.
It's not advice for investing, only my vision according to the data on the chart.
Please consult your account manager before investing.
Thanks and good luck.

ORWE - fast and secure #ORWE - Timeframe 15 minutes .
Created 2 Bullish patterns ,( Gartley - AB=CD ) with same targets .
Entry level at 21.95
Stop loss 21.80
First target at 22.35
Second target 22.63
Third target 22.83
Also MACD and RSI show positive diversion that's may support our idea .
note : chart on timeframe 15 minutes
Its not an advice for investing only my vision according to the data on chart
Please consult your account manager before investing
Thanks and good luck

SPX : Where Where - according to the F
This is a continuation of the previous SELL idea. This time, we go into the details, where we can actually see price action moving in lock-step.
Lets make lots of money. Please keep the SL tight.
Good luck.

ADA/USDT – In a strategic zone: Rebound or false hope? H4 VisionThe price experienced a bullish impulse, followed by a correction that returned to a former resistance level that became support.
🔁 This area also corresponds to the Fibonacci golden zone, which increases the likelihood of a rebound, at least technically.
🎯 Possible scenarios:
1️⃣ Start gradually accumulating in this zone
2️⃣ Wait for the ROB to break for confirmation
3️⃣ Confirm an EMA 7 / SMA 20 crossover for greater probability
📉 Stop Loss: below the SMA 200 H4 (or according to your money management)
🎯 Objective: return to the last high
⚠️ This analysis is purely educational – this is not investment advice.
💬 What's your opinion? Are you accumulating or are you still waiting?


GOLD - Bullish Trend Continuation w/ Bat Pattern & Complex PBGold has been on a tear for sometime now & well, you know what they say, all good things must come to an end. In saying end, we don't necessarily mean a forever end, but perhaps sometimes a break.
After failing to make a new high, it seems like Gold has reached it's excess or exhaustion phase & is beginning to show signs of relief. If this relief were to continue, not only do we have a good structure level to look for buys at, but it's also accompanied with a potential bullish bat pattern.
Please leave any questions or comments below & if you'd like to share your views from either a fundamental or technical perspective, please do so as I love the conversation.
Akil

Monthly Analysis – EUR/USDGiven the upward movement over the past few weeks, I expect a correction followed by a continuation of the bullish move toward the order block, which would also complete the ABCD pattern — and then, a potential sweep of the monthly low.

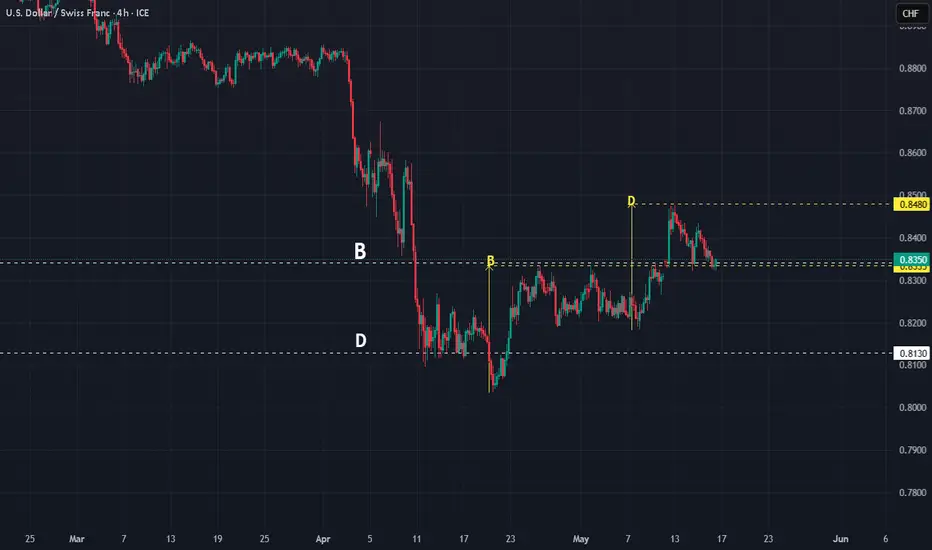
USDCHF : The fine point in playing the DSo far, I have been writing about playing the D - The D is he final point in the price movement, something which we ANTICIPATE.
What do we anticipate?
We anticipate a REVERSAL. In simple terms, we trade 'opposing' the trend.
Why?
The explanation is simple - Buy when Low. Sell when High.
Once the complete structure is complete, then we have a clear picture of price action. Our understanding is correct. Price did as we anticipated.
Now, price had bounced upward from a long term D, chances are it will go up more. Price is now a two Bs, one BIG, and another small. Not a coincidence but it is price telling us something - a confirmation of future direction.
BUY. The R/R is fantastic.
Good luck.
SPX : A Classic Blow-Off Top FormationWhat we are seeing now is NOT healthy. The rise is not due to a great economy. This rise is due to great stress in the system - no fundamentals, just positioning, leverage, and illusion. All the clues are there for all to see.
And when this time it collapses, it would be UGLY.
This is another GOOD time to SELL.
Good luck.

Bearish AB=CD - Sell at Current Price!FX:EURUSD has broken its bullish support and formed a bearish AB=CD pattern. AB=CD is a bearish continuation pattern which aligns with the overall price action.
I am shorting EURUSD at current market price and expecting retracement until Point D to complete the pattern!

GBPUSD's Upward Reaction from Point "D" Could Stay LimitedGBPUSD broke below the 1.3210 support level, confirming a newly formed short-term downtrend channel. The lower line of the channel and the projected point D of an extended ABCD formation have converged, and GBPUSD is now attempting an upward reaction from that area.
The 1.3210 level has now become the most immediate resistance. If it is broken, GBPUSD could make its way toward the upper boundary of the channel. However, momentum currently favors the bears, so any upward moves may present selling opportunities, whether from 1.3210 or the upper line of the channel.
If the downtrend channel fails, this strategy becomes invalid.

ETHUSDT: Progressing Well 01/05/2025 UPDATEThe ETHUSDT price is moving well, currently trading above the 1700$ area. We anticipate a continuous rise, potentially reaching $2400 first and then $3000. Our swing target remains at $4500. The current price behaviour and momentum suggest an extremely bullish outlook.
Good luck and trade safely!
Thank you for your unwavering support! 😊
If you’d like to contribute, here are a few ways you can help us:
- Like our ideas
- Comment on our ideas
- Share our ideas
Team Setupsfx_
❤️🚀

BTCUSDT: Drops Towards $53000 region may help us hitting $80000.BINANCE:BTCUSDT price currently in making of AB=CD pattern, it is likely to touch and reject at the $53000 which area remain crucial for most of the swing investors. The following news we can significant impact in the crypto market also 50k to 53k area remain extremely bullish. With accurate entry at 530000 area when we can target 80-100k possibly.
