BTC Bearish ABCD Setting up to Drop Down Towards $16,741Recently, BTC has been showing promise to begin a macro breakout and run up to over $100,000, but even more recently on the lower timeframes, it's been giving off some bearish signs at a Bearish ABCD PCZ that we could actually go back down to around $16.75k from here before actually beginning the true run up towards the 6 digits.
We have made three Consecutive Lower Highs on the RSI and are likely setting up for a Double Bearish Divergence on the MACD; if we come back down to test the levels of 16.7k, that would be the secondary test of the 1.618 Butterfly PCZ to which we could then more confidentially rise from.
AB=CD

AUD/USD Bear trade IdeaPotential trade setup for AUD/USD, its likely to break the rectangle on downside and complete the the Harmonic pattern AB=CD

EUR-CAD|POSSIBLE REVERSAL|LONG SETUP|HARMONIC TRADINGThe current technical analysis of the EUR-CAD currency trading pair reveals an DECREASING trend that has been shaping from last few hours. However, there is also an indication of BULLISH divergence and presence of Bullish AB=CD HARMONIC pattern suggesting that the bearish momentum of EUR-CAD may be losing its momentum.
Looking at the charts, we can see that the price of EUR-CAD has been steadily FALLING forming Lower Highs and Lower Lows, indicating a clear down trend.
However, there is a notable bullish divergence pattern emerging, indicating that the bearish momentum may be losing steam. While the price of EUR-CAD has been decreasing, the Relative Strength Index (RSI) has been showing a upward. This divergence between the price and the RSI suggests that the price may be oversold and due for a correction.
Considering all the technical indicators, it appears that the EUR-CAD currency trading pair may take the bullish movement from the ENTRY PRICE mentioned in the chart. Thus, it can be an opportunity for a LONG TRADE if it breaks the ENTRY PRICE.
Risk to Reward Ratio is suggested to 2% of the total portfolio.

Sharda Corp ViewSharda Corp best for short term swing trade gave BO with high volume and retest also done. Entry 520-530 SL 472 target 596 and 670 with in next 2-6 months.

Bearish ab=cd on GBPUSDGBPUSD has formed an inverted head and shoulders on the H1 timeframe and is heading towards last week Friday's peak. Within this formation, a bearish AB=CD pattern coincides with the hesitation zone. PRZ tips suggest that a convergence of Fibonacci numbers and specific price patterns provides a highly probable area for a reversal. The PRZ aligns with the Hesitation Zone, which is a valid resistance point, so price may face strong resistance.

NASDAQ - 15k the Key level this week.SKILLING:NASDAQ is still down after Fridays high so now 15k becomes the key level to watch for this week. This is just a short example of how I look at things.
I hope it helps. Enjoy the week.


AUDCAD - CTS Trade (How to Identify Key Levels of Structure)In today's video we're looking at a structure-bases CTS trade. CTS stands for Combined Technical Score & it was a method taught to me by my trading mentors as a way to stay consistent with what we're looking at & with what we value in the market by creating a list of technical factors & assigning them a point score.
I'll also show you how I go about identifying key levels of structure so that I know which areas of the market to lock in on.
If you have any questions or comments please leave them below.
Akil

#23 NZDUSD Double ABCD and 0.618 Retracement from last swingThe last leg was preceded by an ABCD, which expanded to the 1.618 extension. I hope that the same thing happens now. There is a 1.618 ABCD expansion from the lows, in a 0.618 retracement from the last swing high. My stop is 50 pts higher. I am entering at the market now at 0.62282

harmonic pattern formed in Ashok leylandharmonic pattern formed in Ashok leyland, target defined in the chart
ABCD pattern also formed

NZDJPY - Bearish AB=CD Harmonic Reversal PatternHi Traders,
on above chart, I am looking for buy opportunity in first phase on breakout of B point and if D point trigger that would be a potential reversal zone, I would take 2nd trade of short sell on trend reversal.
follow my idea as per my trade plan, if you agree with my idea.

EURAUD ABCD in the major trendABCD measured move. It has paused into a Trading Range for a while. A reversal might be unfolding. Im buying at 1.5871 with the stop 50 pts lower

NZDJPY ShortNZD/JPY is displaying a potential head and shoulders pattern, indicating a possible trend reversal. The left shoulder, head, and right shoulder form successive peaks, with the head being the highest. A neckline connects the lows between the shoulders. If the price breaks below the neckline, it could signal a bearish move. Additionally, RSI divergence suggests weakening bullish momentum, supporting the bearish case. Furthermore, there is a possibility of an AB=CD pattern, indicating a potential target for the downward move. Traders should monitor the price closely for confirmation of the pattern and consider risk management strategies before making any trading decisions.

GBPUSD Bearish GBP/USD is showing a head and shoulders pattern, suggesting a potential trend reversal. The neckline break would confirm this bearish signal. Additionally, RSI divergence indicates weakening bullish momentum, while the AB=CD pattern suggests a potential target for the downward move.

Butterfly possible? Any help is appreciated Ive never used butterfly patterns but thought this looked close to one....Perhaps it's possible 🤔
If you could offer any insight I'd appreciate it, thanks

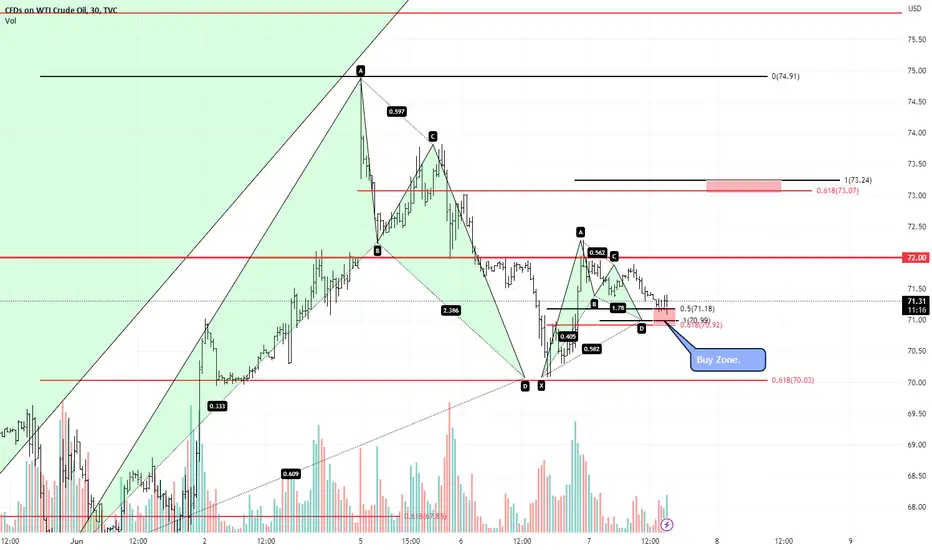
US OIL - Potential upside move to 78.00TVC:USOIL After the Gap up on Monday we got a nice retracement back to the 61.8% level yesterday followed by a 200 point rally.
Now there is the same pattern on a smaller scale but the same set up.
if it holds above 71 then the intra-day upside target is 73.00 but there is a chance that on the higher TF we could get to 78.00.
See how this one plays out.
I will post updates as it goes along.
GBPCAD 4H ABCD into a Major Resistance AreaHere I can see an ABCD pattern unfolding into the previous Trading Range (TR). The completion area is in the resistance area of the previous TR. Therefore, I hoping for sellers to come in there. I am inputing an order at 1.69 with a 50 point stop.

Long oppourtinity in nifty. The AB = BC harmonic pattern is a technical analysis pattern used in financial markets, particularly in the field of harmonic trading. It is based on the Fibonacci ratio and seeks to identify potential reversal or continuation points in price movements.
In this pattern, the length of segment AB is considered equal to the length of segment BC. This equality suggests a potential symmetry in price action and implies that the market may exhibit a similar price movement from point B as it did from point A.
Traders who follow harmonic patterns use this information to anticipate future price behavior. They look for other technical indicators and confirmations to support their analysis and make trading decisions accordingly.
It's important to note that while harmonic patterns can be useful tools in technical analysis, they are not foolproof and should be used in conjunction with other forms of analysis and risk management strategies

JPN225JPN225 (Nikkei 225) is showing a bullish flag pattern, RSI divergence, and a double top reversal pattern. Traders are advised to wait for a breakout below the last printed lower low point to consider a short trade, indicating a potential trend reversal in the market. Risk management is essential.

End of a trend?GBPUSD is trending upwards, but an AB=CD pattern could mark the end of the uptrend. The PRZ coincides with the LQP 1.275 and could serve as a resistance level for the pair. Price could play around this zone and go through to 1.275, or the resistance may be too much and cause a price reversal. Look out for extension patterns as the trend reaches its end.

Retest $25KThere are several converging factors to retest the 25K breakout. Two likely patterns are the bullish Gartley and/or inverted AB=CD, with a Potential reversal zone (PRZ) at $25.4K.
I shorted since prices went back into the 29K/26.5K range. If price reaches $26650, I will try to play the BC and CD waves of the Gartley.
Good luck with your trades.

Nas100Hello dear trader or investor
This chart about as100
So according to us nas100 may be make good fall so what’s you think about it?

gbpusd sellIn this analysis, after breaking that support line and strong fall, you can sell at the specified price and stop
. Don't forget about stop-loss.
Write in the comments all your questions and instruments analysis of which you want to see.
Friends, push the like button, write a comment, and share with your mates - that would be the best THANK YOU.
P.S. I personally will open entry if the price will show it according to my strategy.
Always make your analysis before a trade
