NZDUSD ADVANCE HARMONICS PATTERN NZDUSD has formed on its hourly chart an advamce harmonics pattern AB=CD.
The price is trading above near the short entry level EL: 0.61363,
targets
50% AD: 0.60702
62% AD: 0.60504
AB=CD

SHIBUSDProjecting of moving new exciting cryptocurrency. I know nothing about it yet and own non of it. But my project seems right for me. I think it could be enough for my dear audience.

XAUXAU prediction. Just a quick view on behaving on gold markets into the near future. Please do not take it too seriously.

Counter-Trend MoveThis could be for you if you are waiting for a counter-trend move. A Bearish Gartley Pattern is expected to complete at 1.2605, but the earliest for that is on 12 Jun 23, 1200(utc+3); any earlier than that, the trade would be invalid.
If a break and close above 1.2605 occur, I will wait for an M.C confirmation at 1.2659 on the ABCD pattern.
Both of these Harmonic Patterns are counter-trend moves. On GBPUSD, that means a pullback trade. Overall, my sentiment remains bullish on the GBPUSD.

2281 (Bullish Setup. AB=CD, C&H Formation)Price has taken support from important zone
Trednline, Horizontal Support confluence
Price is in Uptrend (Formation of HH, HL)
Completion of AB=CD targets
New formation of AB=CD in process
Cup & Handle formation is in process
SL and TPs are specified
Ride the trend with trailing SL

The ABCD Pattern: from A to DHello dear @TradingView community!
Are you familiar with the ABCD pattern?
The ABCD pattern is a highly effective tool utilized in trading to identify potential opportunities across diverse markets, including forex, stocks, cryptocurrencies, and futures. This pattern takes the form of a visual and geometric arrangement, characterized by three consecutive price swings or trends. When observed on a price chart, the ABCD pattern exhibits a striking resemblance to a lightning bolt or a distinctive zig-zag pattern.
Importance of the ABCD Pattern
The significance of the ABCD pattern lies in its ability to identify trading opportunities across different markets, timeframes, and market conditions. Whether the market is bullish, bearish, or range-bound, the ABCD pattern remains a reliable tool.
By recognizing the completion of the pattern at point D, you can get a perspective trade entries. Furthermore, the ABCD pattern helps you determine the risk-to-reward ratio before initiating a trade. When multiple patterns converge within the same timeframe or across different timeframes, it strengthens the trade signal and increases the likelihood of a profitable outcome.
Finding an ABCD Pattern
The ABCD pattern has both a bullish and bearish version. Bullish patterns indicate higher probability opportunities to buy or go long, while bearish patterns suggest opportunities to sell or go short.
To identify an ABCD pattern, it is essential to locate significant highs or lows on a price chart, represented by points A, B, C, and D. These points define the three consecutive price swings or legs of the pattern: the AB leg, the BC leg, and the CD leg.
Trading is not an exact science, so traders often employ Fibonacci ratios to determine the relationship between the AB and CD legs in terms of both time and price. This approximation assists in locating the potential completion of the ABCD pattern. When patterns converge, it increases the probability of successful trades and enables you to make more accurate decisions regarding entries and exits.
Types of ABCD Patterns
There are three types of ABCD patterns, each having both a bullish and bearish version. To validate an ABCD pattern, specific criteria and characteristics must be met. Here are the characteristics of the bullish and bearish ABCD patterns:
📈 Bullish ABCD Pattern Characteristics (buy at point D):
To effectively trade the bullish ABCD pattern, you might consider the following characteristics:
1. Find AB:
Identify point A as a significant high and point B as a significant low. During the move from A to B, ensure that there are no highs above point A and no lows below point B.
2. After AB, then find BC:
Point C should be lower than point A. In the move from B up to C, there should be no lows below point B and no highs above point C. Ideally, point C will be around 61.8% or 78.6% of the length of AB. However, in strongly trending markets, BC may only be 38.2% or 50% of AB.
3. After BC, then draw CD:
Point D, which marks the completion of the pattern, must be lower than point B, indicating that the market has successfully achieved a new low. During the move from C down to D, there should be no highs above point C.
4.1 Determine where D may complete (price):
To determine the price level at which point D may complete, Fibonacci and ABCD tools can be utilized. CD may equal AB in price, or it may be 127.2% or 161.8% of AB in price. Alternatively, CD can be 127.2% or 161.8% of BC in price.
4.2 Determine when point D may complete (time) for additional confirmation:
For additional confirmation, you can analyze the time aspect of the pattern. CD may equal AB in time, or it may be around 61.8% or 78.6% of the time it took for AB to form. Additionally, CD can be 127.2% or 161.8% of the time it took for AB to form.
5. Look for Fibonacci, pattern, trend convergence:
Convergence of Fibonacci levels, pattern formations, and overall trend can strengthen the trade signal. Therefore, you should look for instances where these elements align.
6. Watch for price gaps and/or wide-ranging candles in the CD leg:
As the market approaches point D, it is important to monitor for any price gaps or wide-ranging candles in the CD leg. These may indicate a potential strongly trending market, and you might expect to see price extensions of 127.2% or 161.8%.
📉 Bearish ABCD Pattern Characteristics (sell at point D):
To effectively trade the bearish ABCD pattern, you might consider the following characteristics:
1. Find AB:
Identify point A as a significant low and point B as a significant high. During the move from A up to B, ensure that there are no lows below point A and no highs above point B.
2. After AB, then find BC:
Point C should be higher than point A. In the move from B down to C, there should be no highs above point B and no lows below point C. Ideally, point C will be around 61.8% or 78.6% of the length of AB. However, in strongly trending markets, BC may only be 38.2% or 50% of AB.
3. After BC, then draw CD:
Point D, which marks the completion of the pattern, must be higher than point B, indicating that the market has successfully achieved a new high. During the move from C up to D, there should be no lows below point C and no highs above point D.
4.1 Determine where D may complete (price):
To determine the price level at which point D may complete, Fibonacci and ABCD tools can be utilized. CD may equal AB in price, or it may be 127.2% or 161.8% of AB in price. Alternatively, CD can be 127.2% or 161.8% of BC in price.
4.2 Determine when point D may complete (time) for additional confirmation:
For additional confirmation, you can analyze the time aspect of the pattern. CD may equal AB in time, or it may be around 61.8% or 78.6% of the time it took for AB to form. Additionally, CD can be 127.2% or 161.8% of the time it took for AB to form.
5. Look for Fibonacci, pattern, trend convergence:
Convergence of Fibonacci levels, pattern formations, and overall trend can strengthen the trade signal. Therefore, you should look for instances where these elements align.
6. Watch for price gaps and/or wide-ranging bars/candles in the CD leg:
As the market approaches point D, it is important to monitor for any price gaps or wide-ranging bars/candles in the CD leg. These may indicate a potential strongly trending market, and you might expect to see price extensions of 127.2% or 161.8%.
💜 We would love to hear your feedback!
Did you find the article on the ABCD pattern helpful? We strive to provide valuable and informative content for traders like you. Your feedback is important to us as it helps us improve our articles and better serve our readers.
Please take a moment to share your thoughts and suggestions. Did the article cover the topic comprehensively? Were the explanations clear and easy to understand? Is there anything you would like us to add or elaborate on?
We appreciate your time and input. Thank you for being a valued reader, and we look forward to hearing your feedback!

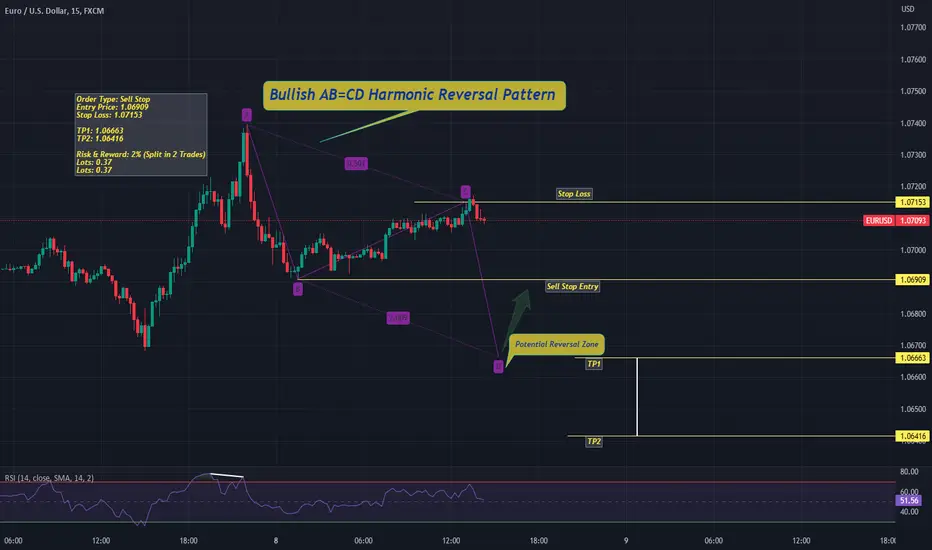
EURUSD - AB=CD Harmonic PatternHi Traders,
On the above chart I am monitoring at 15m time frame. As per my analysis, it seems to be printing a bullish AB=CD Harmonic Reversal Pattern. In such scenario, I took two trades. First trade is Sell Stop entry and 2nd trade instant buy entry (depends on (PRZ) potential reversal zone trigger) and trend printing proper HH & HL.
If you guys are agreeing to my trade plan you can follow my trade plan. 2nd trade plan would be update if PRZ trigger.
Trade Safe!
AmerisourceBergen Corporation: Bearish AB=CD & 3 Drives PatternABC currently is Bearishly Diverging on the MACD and RSI around the 2.414-2.618 PCZ of a Bearish AB=CD where it has also developed a Bearish 3 Drives Pattern and a Bearish Shark. If we get the action I'm expecting to see from here, it will come down and break through the trend line and then continue down to the 0.886 retrace at $77 in a dramatic way.

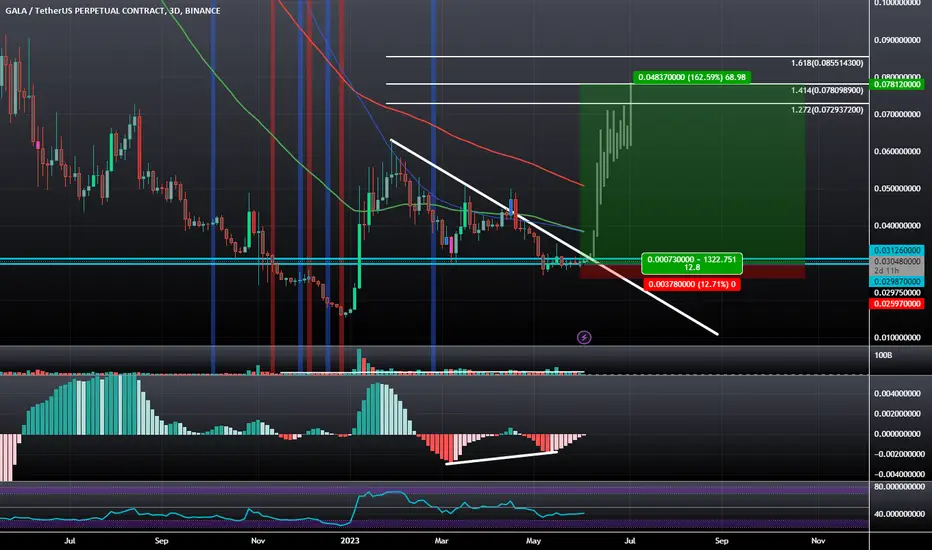
GALA Games: Potential AB=CD BAMM Bullishly Diverging at SupportGALA looks like it could be setting up for a double bottom at a local support it's created for itself. During this process it's formed some Bullish Divergence and has given us a potential Bullish Dragon Trend line; if it breaks out I would think this would be the start of an AB=CD movement up to the 1.414 Extension of 7.8 cents
GBPUSD Short Until the D pointAs price breaks another LL and forms another LH, GU continues to descend. I reckon this ab=cd pattern could yield some significant support for price to change character and do some corrections. If not, I reckon a shot towards the next LQP 1.22500 could yield this change of character instead.

NXPI Semiconductors: Bullish ABCD BAMM ProjectionNXPI is trading within a weekly consolidation structure that appears to be bottoming out and preparing to make at least an 0.886 retrace, and recently it has formed a Bull Flag and it has also confirmed Hidden Bullish Divergence on the Monthly with a MACD Bullish crossing.
Out of all the big chip suppliers, NXPI is one that has yet to make any crazy moves up and is still trading within a value area, but that likely wont last long as it catches up with the rest of the sector as it is an active supplier within the sector.

Great Location Doge#Great position with good risk to reward
After breaking the long-term trend line, the price has had a good rally (A) and a slow correction has taken place in the form of wave (B) and I expect wave C to complete.
enjoy

INJUSDTWill AB=CD pattern play its role in INJUSDT.?
INJUSDT has completed its AB=CD and also getting support from daily inclining trend line.
Will INJUSDT show some bullish momentum from this region?

USDSEK: Head and Shoulders at the PCZ of a Bearish ABCDUSDSEK is trying to confirm a Right Shoulder of a Bearish Head and Shoudlers Pattern at the PCZ of a Harmonic Bearish AB=CD. If it is able to goback down from here and break through the neckline then we could see action similar to what we saw on the EURHUF.

STOP! Read before you consider to engageHALT! Don't follow this trading idea blindly.
You should know that I've a strong bias to long the GBPUSD on the higher timeframe, the daily and weekly chart.
I'd engaged in a strategy that I've personally tested for the past 12 years.
The ABCD pattern showing up on the 8 range bar provide such an opportunity for me to engage the trade.
What is really needed is for the first target to be hit and that would give me the right to shift stops to entry and enjoy the ride.
The first 34pips(340usd/lot) of profits is what I need to let that happen and I'll keep my second target open.
If you do not plan your trade in advance, don't jump in.
If you had not traded ABCD pattern in your life, don't jump in.
If you do not have the unwavering bias to long GBPUSD, don't jump in.

Wave C Movement in #ATOMAfter the 5-wave correction of ATOM# and the rapid movement of A, the correction of B has taken place.
I expect price to complete wave C by September 4th .
Otherwise, the analysis is invalid.
