Bitcoin - Dump and Pump | Crypto resurrected - next 125,000 USDLast week Bitcoin and the whole crypto market dumped like crazy, but on Sunday at the start of March, the crypto market was resurrected from the abyss! After Trump's post, the crypto market pumped in a very short period of time. But let's take a look at the technicals.
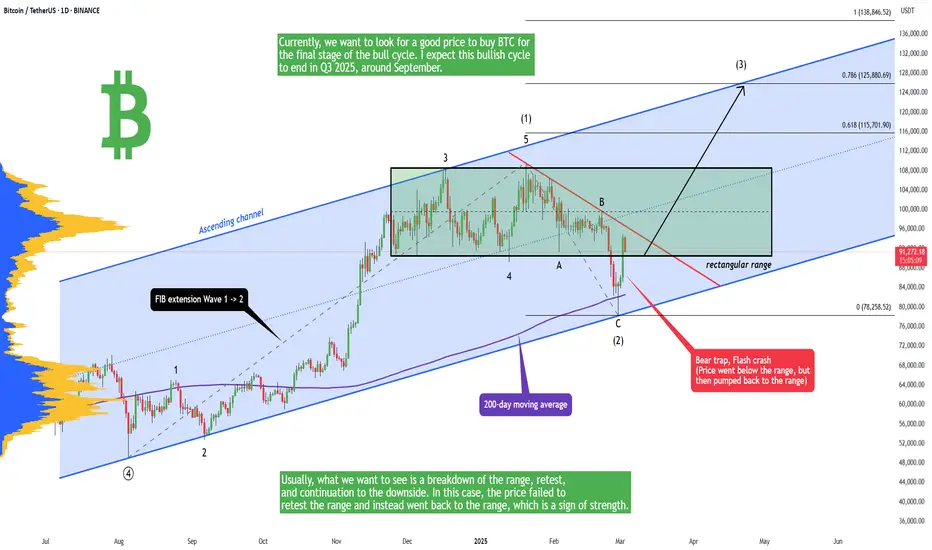
The price dropped below the rectangular range but then pumped back into the range. What does it tell us? Usually, what we want to see is a breakdown of the range, retest, and continuation to the downside. In this case, the price failed to retest the range and instead went back to the range, which is a sign of strength. Currently, we want to look for a good price to buy BTC for the final stage of the bull cycle. I expect this bullish cycle to end in Q3 2025, around September.
The price of Bitcoin is inside this huge ascending parallel channel on the daily chart, and as long as this channel holds, we have to be bullish. Let's take a look also at the weekly timeframe. What we can see here is a bullish hammer with an extremely long wick (reversal candle). The price also got rejected from the 20-weekly moving average.
Write a comment with your altcoin + hit the like button, and I will make an analysis for you in response. Trading is not hard if you have a good coach! This is not a trade setup, as there is no stop-loss or profit target. I share my trades privately. Thank you, and I wish you successful trades!
AB=CD
GOLD can have some retracementWith bearish divergence on daily TF, there is a possibility that the price can fall in the area between the 2738-2682 range, and in that region, we can also see a support level, which is a good thing as the price is following our AB=CD pattern and before hitting the target of that pattern which is 3070 there is opportunity for us to add more positions

Bitcoin Threat - Last chance is now! Or crash to 40k! (-63%)Bitcoin crashed by 12% in the past few days to 86,800, exactly to the last available support of the whole bull market! This is the last support; otherwise, the bull cycle is over, and we will have a tremendous crash to 40K in 2025/2026. So why is this the last support?
First, we need to look at the price action because bitcoin has been going sideways since November. We can clearly see an expanding triangle on the daily timeframe. Expanding triangles are very uncomfortable patterns for traders, as the whales take liquidity on both sides (buyers and sellers). And this is exactly what happened recently: Bitcoin crashed to 86.800 below the previous swing low and took all stop-loss orders from traders while remaining in the expanding triangle continuation pattern.
Bitcoin really cannot afford another crash; otherwise, the bears will break the expanding triangle, and the bull market will end. Bitcoin must go up right now! I am bullish until the end, and I still see that Bitcoin is in an uptrend. But if the price falls below 86,800, expect 40k later in 2025/2026, so this is the last chance!
What is also bullish? The price is still above the main green trendline. We want to see this trendline hold until the end of the bull market. From the Elliott Wave perspective, the price is starting last wave (5) to finish an impulse wave of higher degree. 125k is a significant resistance because of the 0.618 FIB extension. So, the threat is big for Bitcoin - 125k or 40k? Let me know in the comment section! (write 125k or 40k).
Write a comment with your altcoin + hit the like button, and I will make an analysis for you in response. Trading is not hard if you have a good coach! This is not a trade setup, as there is no stop-loss or profit target. I share my trades privately. Thank you, and I wish you successful trades!

BTCUSD WILL ACCUMULATION This base on Wyckoff Analysis
Effort VS Result as you see on current price that fall with weak candle and high volume. Price candle small and high volume thats addressed Big Whale is accumulate the price or they collect liquidity at lowest price or they buying at best price before price raising UP. And Now you can see the BOS is already occur and test test until SL Buyer Triggered and TP Seller Triggered Thats we call liquidity sweep and make confusing the retailer.Please aware don't sell your position until price hit 150k-200k.

XRP Bullish Setup – AB=CD Pattern on 1H Timeframe!#XRP is in a strong uptrend, showing no bearish signs, and currently forming a classic AB=CD pattern on the 1-hour timeframe. This pattern is a well-known harmonic structure that often leads to a continuation of the trend!
Key Technical Insights:
🔹 AB=CD Pattern Completion: Price is approaching the 0.618 Fibonacci retracement zone.
🔹 No Bearish Signs: Momentum remains bullish, with increasing volume.
🔹 Confluence Support: The 0.618 FIB level aligns with previous demand zones, increasing the probability of a bounce.
Trading Plan:
Entry: Around the 0.618 FIB level, Price is 2.65
🔹 Targets: TP at 2.88
🔹 Stop-Loss: Below structure 0.5 FIB level, Price is 2.6
What do you think? Will #XRP respect the AB=CD pattern and continue higher? Drop your thoughts in the comments!
Like & Follow for more high-probability trade setups!

Bitcoin will +27%, ETH +139%, LTC +251%, SOL +100% (Best coins)In this analysis, we will look at 4 major coins that are good to hold for the upcoming weeks! Because alt season is starting, we want to focus on strong altcoins. Starting with Bitcoin.
Bitcoin (BTC) - expect + 27%
Bitcoin is in a strong uptrend (ascending channel), and as long as Bitcoin is in this channel, we are very bullish. We can expect Bitcoin to hit 125k in the near future. I know this is not a lot; that's why we want to focus on altcoins! Definitely avoid coins such as XRP or TRUMP because these coins are already pumped!
Ethereum (ETH) - expect +139%
Ethereum still didn't hit an all-time high in this bull cycle, which gives us a great opportunity to buy it cheap. Ethereum is definitely undervalued compared to other coins, so this is a clever buy. Technically, the price is in an uptrend and near the ascending channel support. This gives us an excellent buying opportunity for 2025.
Litecoin (LTC) - expect +251%
Litecoin was in a range for 3 years! That was a really long time, but currently the price is breaking out of the range and forming a bull flag. This is a very strong combo, so we definitely want to buy on the buying side. Sorry for traders or hodlers that were waiting 3 years without any profits. We are traders; we want to buy at the best moment and take profit after the pump!
Solana (SOL) - expect +101%
Solana is another extremely bullish altcoin, and as with the previous ones, we are also in an uptrend (ascending channel). Because the price is near the support trendline, this is a great opportunity to buy it with a tight stop loss. If you are satisfied with 100% profit and pretty low risk, you can go for it. If you want more profits, go with Litecoin or use leverage on futures SOLANA.
Want to know the analysis of your altcoin? How much % ? Easy, hit the like button and write a comment with your altcoin, and I will make an analysis for you in response!

Harmonically Bullish on Procter and Gamble. PGXABC bullish zigzag, within a structure harmonically consistent with a developing XABCD. In harmonic reactions, retracements are often indicative of extensions to follow, which in this case is 1.618. This conveniently aligns in a Fibonacci cluster with a .886 larger retracement, consistent with a Bat Harmonic. One thing about Bats is that they are the most common and the most reliable out of the harmonic family. Interestingly, MIDAS, VZO, Stoch and BB%PCT all flipped on literally the same candle? Fractal resonance anyone?

META Shorts - IntradayOne approach to identify bearishness in an asset is the gap it leaves and rejects from recent PD arrays. In this case, the setup was there as the price didn't even gravitate towards the H4 SIBI and rejection from RB giving confirmation for Draw on Liquidity for Previous Day low.

SONIC - Will double (+100%) in a week (Launch 27 Feb)!Sonic is forming a strong reversal pattern on the 4h chart - ascending triangle. This is a strong sign that the bottom may be in and we may see a 100% rise in a short period of time. On the chart, you can see 3 strong levels that we need to take into consideration.
Sonic: Mainnet Launch and Hackathon
Sonic is set to launch its mainnet on February 27 2025, with the Hackathon kicking off on February 17. This mainnet, named Mobius, symbolizes "The beginning of infinite continuity." The Möbius strip, when cut at any point, seamlessly loops back into itself, representing the interconnected nature of blockchain. No matter how different the paths may be, they eventually converge, embodying the fusion and unification of the ecosystem. The name Mobius reflects Sonic’s vision for the future development of the project.
In 2025, Solana’s on-chain narrative continues to evolve, with various SVM-based projects striving to address challenges such as high concurrency, low latency, and cross-chain compatibility to expand the Solana ecosystem’s boundaries. SVM (Solana Virtual Machine) serves as the execution environment responsible for processing transactions, smart contracts, and programs on the Solana network.
Sonic is the first SVM expansion chain on Solana.
Now, can this coin 10x? Yes, but this will definitely take some time. If you want to trade this coin, which I highly recommend due to its high volatility, you can take the following trade.

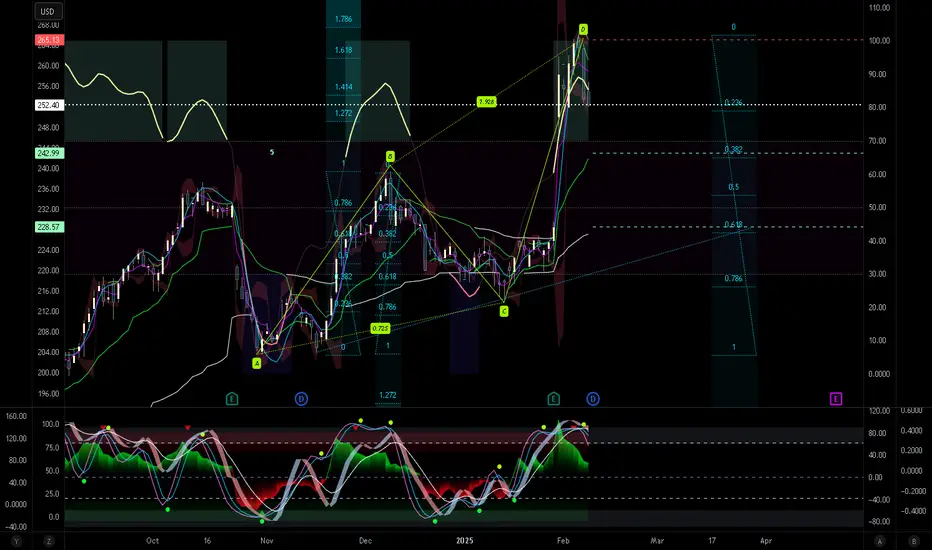
Bitcoin - No one is expecting this move! (must see)A lot of people are turning very bearish on Bitcoin, but I don't think it's time to be bearish, the bearish trend is not confirmed at all, and the price of Bitcoin should first touch the long-term major trendline (2017 -> 2021 -> 2025). You want to sell at the touch of the trendline. The second option is to use the Fibonacci extension tool and look for the 1.618 FIB. I did it for you, and the 1.618 FIB is exactly at 122,069 USD.
Bitcoin is currently in the final stage of the bullish cycle that started in 2022 (15,632 USDT) and is predicted to end in 2025 (around 125,000 USDT). This was a pretty good investment, but if you are jumping in right now, you will most likely get hurt in 2025 and 2026. Let's take a look at history to see what we can expect in the next few years.
Bitcoin crashed by 84% (in 2018) and 77% (in 2021). These are the classic bear market crises that Bitcoin experiences every 3–4 years. It's because we have halving events (reducing rewards for miners in BTC) every 4 years from a fundamental perspective. You may know that Bitcoin is highly volatile. History is telling us that in 2025/2026 a huge bear market and crisis are ahead.
From the Elliott wave perspective, we are in the final wave (5). We can expect an ABC correction in 2025/2026 which would bring the price down to 50,000. I bring you very strong technical data that you can use on your trading decisions.
In conclusion, I am currently optimistic about the price of Bitcoin for the next weeks and months. I think Bitcoin will hit 120k to 125k before we experience a major drop or flash crash. It's safe to buy/long Bitcoin, but do not forget to take profit!
Write a comment with your altcoin, and I will make an analysis for you in response. Also, please hit boost and follow for more ideas. Trading is not hard if you have a good coach! This is not a trade setup, as there is no stop-loss or profit target. I share my trades privately. Thank you, and I wish you successful trades!

ADA: AB=CD Pattern - 1hr Time FrameAnalysis Overview:
#ADA has recently shifted from a Bullish trend to an downtrend, forming Lower Lows (LLs) and Lower Highs (LHs) on the Small timeframe. Currently, #ADA is developing an AB=CD pattern, signaling a potential continuation of the bullish momentum.
Key Observations:
✅ Uptrend Confirmation: Price action is forming consistent HHs and HLs.
✅ AB=CD Pattern: Price is aligning with the classic harmonic formation.
✅ No Bearish Reversal Signs: No significant bearish divergence or trendline break.
✅ Entry Strategy: Waiting for HLs to form and price to complete the AB=CD structure.
Trade Plan:
🔹 Entry: At the completion of the HL and AB=CD pattern.
🔹 Stop-Loss: Below the previous HL to minimize risk.
🔹 Take-Profit: Near key resistance levels or Fibonacci extensions.
🔹 Risk Management: 1:2 or higher risk-to-reward ratio.
Conclusion:
If the AB=CD pattern completes successfully, we can expect #ADA to continue its bullish move. However, waiting for confirmation and applying proper risk management is crucial to avoid potential reversals.
📊 Let me know your thoughts in the comments! Do you see any additional confluence?

Bitcoin Seasonality - Best Month (October) and Best Day (Monday)It's very important for every Bitcoin trader to know its seasonality because this will significantly increase the probability of successful trades. I have been trading Bitcoin for almost 10 years, and I successfully use seasonality patterns to predict Bitcoin price movements. For example, you don't want to go long on Bitcoin during August or September; that's probably a very bad idea. The biggest market crashes usually happen in September. But you definitely want to go long in October or April, as these months are the most promising. Knowledge of these patterns will give you an advantage over standard retail traders. Every trade matters.
Average return by Month (%)
January: +5.1%
February: +12.1%
March: +4.8%
April: +18.7%
May: +14.2%
June: +4.4%
July: +6.1%
August: -3.1%
September: -8.4%
October: +22.2%
November: +17.9%
December: +7.3%
Average return by Weekday (%)
Monday: +0.63%
Tuesday: +0.18%
Wednesday: +0.54%
Thursday: +0.40%
Friday: +0.37%
Saturday: +0.45%
Sunday: +0.10%
Currently I am bullish on Bitcoin as the price is in an uptrend and the bear market is not confirmed; I expect Bitcoin to hit 115k probably at the end of February/March. What I also expect is an alt season - alt season is starting right now! So it's time to buy some altcoins. Ethereum should outperform BTC in the next weeks as well.
Write a comment with your altcoin, and I will make an analysis for you in response. Also, please hit boost and follow for more ideas. Trading is not hard if you have a good coach! This is not a trade setup, as there is no stop-loss or profit target. I share my trades privately. Thank you, and I wish you successful trades!

ETHUSD about to drop for more than 500 dollars!!Based on my trading algorithms ETHUSD will drop for 500 dollars!

Trend Continuation on Deere & Co. DEWhat is most striking about this picture is the sudden change in price action - this may be a sign of continuation of trend and completion of XABC harmonic pattern. Technicals on VZO, Stoch RSI are quite suggestive. BB%PCT quickly flipped back to bullish. The bullish engulfing candle crossed vWAP, US and MIDAS lines simultaneously. Good luck out there and manage your risk.

Completed AB=CD Pattern for DOG/USDPrice action on the weekly timeframe of DOG/USD (Dogecoin versus the US dollar) recently touched gloves with an equal AB=CD support pattern at US$0.21452, a base complemented by a 1.27% Fibonacci extension ratio and a 61.8% Fibonacci retracement ratio. Traders long the pair tend to take aim at the 38.2% and 61.8% Fibonacci retracement ratios derived from between legs A and D at US$0.29907 and US$0.36312, respectively.

Bitcoin - Buy now! Ready to pump to 125 000 (alt season)I recommend buying Bitcoin as the price is ready to go much higher in February. The current price is 98,000, and I expect Bitcoin to hit 111,000 in the immediate short term. 111k is a strong resistance because it's the top of the ascending parallel channel. Bitcoin has been in this channel for 91 days since November 2024. Then later this year in summer, Bitcoin will reach 125k.
But we should focus on altcoins in the next months! Why? Because a huge alt season is starting! Let's take a look at the BTC.D (Bitcoin Dominance) chart because this is the major indicator of altcoin seasons. As per my analysis, the price recently hit a strong resistance and needs to go down to 48%. We could experience the greatest alt season in years, so be ready! Make sure you have the right altcoins. Ethereum is definitely one of the altcoins that will outperform Bitcoin in the next months.
I am very bullish on Bitcoin and on the overall crypto market for the next weeks and months! Now is the time to buy, but let me know in the comment section, what do you think?
Write a comment with your altcoin, and I will make an analysis for you in response. Also, please hit boost and follow for more ideas. Trading is not hard if you have a good coach! This is not a trade setup, as there is no stop-loss or profit target. I share my trades privately. Thank you, and I wish you successful trades!

Upgoing Zigzag on Verizon. VZA very suggestive bullish engulfing again. Single, isolated Japanese candles are meaningless by themselves. But when taken in context, they can paint a meaningful picture, as in this case.

$1 per DOGE? This is not just a dream...Hello Traders 🐺
Dogecoin is showing strong bullish signals and seems to be on the path to significant growth. Reaching $1 might be closer than you think! 📈🔥
But why am I telling you this? 🤔
As you can see in the chart, DOGE has broken above the purple resistance line , which was a major monthly resistance ! Now, it's forming a bull flag pattern right above it. 🚀
Even during the last market dip, DOGE successfully retested this resistance as a strong support , confirming its strength. In my personal opinion, this bull flag is about to break out —and the target ? Yes, around $1 ! This could mean a massive 300% pump !
Are you ready for the move ? 🐕

A U.S. backed crypto that has fallen behind the marketHello, traders! 🐺
First of all, I want to thank you for your incredible support ! My last idea about ETH went absolutely viral on TradingView , and as of now, it’s among the most popular ideas about ETH !
So, thanks a lot! 🙌 Now, let's dive into a hidden gem that could potentially perform like Solana and XRP , both of which have done exceptionally well in the past few months! 🚀
As you can see in the chart above, LINK is currently above the symmetrical triangle and just below a key resistance level around its ATH price at the $36 area .
In my humble opinion, this is a great buying opportunity for LINK because:
1️⃣ The chart structure is a mix of what we've already seen in ETH and what previously formed in XRP. I’ll discuss this in detail in my next idea about XRP, so make sure to follow me to stay updated !
2️⃣ BTC.D is at its peak , so if you ask me— what could be better than buying at a discount ? Especially when it’s a solid and fundamentally strong project like LINK !
Just imagine—if ETH breaks to its ATH and follows my idea all the way to $17K, what could the price of LINK be? 🚀
In the smaller time frame :
you can go into the long position when price break above the wedge resistance line and put your stop loss below the previous low
( this is not a financial advice )

Bitcoin Seasonality - Best Month (October) and Best Day (Monday)It's very important for every Bitcoin trader to know its seasonality because this will significantly increase the probability of successful trades. I have been trading Bitcoin for almost 10 years, and I successfully use seasonality patterns to predict Bitcoin price movements. For example, you don't want to go long on Bitcoin during August or September; that's probably a very bad idea. The biggest market crashes usually happen in September. But you definitely want to go long in October or April, as these months are the most promising. Knowledge of these patterns will give you an advantage over standard retail traders. Every trade matters.
Average return by Month (%)
January: +5.1%
February: +12.1%
March: +4.8%
April: ˇ+18.7%
May: +14.2%
June: +4.4%
July: +6.1%
August: -3.1%
September: -8.4%
October: +22.2%
November: +17.9%
December: +7.3%
Average return by Weekday (%)
Monday: +0.63%
Tuesday: +0.18%
Wednesday: +0.54%
Thursday: +0.40%
Friday: +0.37%
Saturday: +0.45%
Sunday: +0.10%
Currently I am bullish on Bitcoin as the price is in an uptrend and the bear market is not confirmed; I expect Bitcoin to hit 115k probably at the end of February. What I also expect is an alt season - alt season is starting right now! So it's time to buy some altcoins. Ethereum should outperform BTC in the next weeks as well.
Write a comment with your altcoin, and I will make an analysis for you in response. Also, please hit boost and follow for more ideas. Trading is not hard if you have a good coach! This is not a trade setup, as there is no stop-loss or profit target. I share my trades privately. Thank you, and I wish you successful trades!

KASPA accumulation from ETH strategy, continued..I was waiting to sell about 25 more ETH to accumulate ~1 million Kaspa if KAS/ETH hits ~0.000025 or lower; base on the orange measured move drawn and circled (at the bottom thick yellow support line).
However, it appears a bullish is starting to form on the FG{50/15} histogram, and the previous daily candle on the 7Feb2025 engulfs the previous red candle on the 6Feb2025.
If KAS/ETH is able to break above the golden pocket (dashed horizontal thick yellow line), and then subsequently breaks above the top of the narrowing wedge (defined by thin white lines), then it is likely for KAS to continue above the 50 Fib retrace level and to the top of the thick yellow long-term resistance level.
Note: Here the Fib levels were redrawn, as comparted to my earlier published analysis.
If KAS/ETH breaks below the golden pocket at the 65% retrace lvl, then opportunity to accumulate KAS from ETH at or below 0.000025 ETH per KAS will then become likely.

Prepare yourself for a $17K ETH !
Hello, Traders 🐺
As I promised you, my dear friends, in my previous idea about BTC.D (link to BTC.D idea is below this post) , I’m here to share some amazing updates on ETH , which I’ve been wanting to share for a long time.
Honestly, guys, I’ve been waiting for the right time to do this because I’m a dedicated trader , and I believe that trading is all about perfect timing . In my humble opinion , this is the beginning of the ETH season , and you should definitely consider buying some.
(This is not financial advice! Do your own research.)
So, let's begin:
As you can see, every single time , we have had a final shakeout before the pump , and right after that , ETH has made a massive and explosive move .
I’ve tried to make it as clear as possible for you guys by highlighting all the necessary details on the charts . However, if you still have any questions, feel free to ask them below this idea.
Also, don’t forget to follow me and like this idea to show your support! 🚀🔥

IBM Pivoting downward. IBMA nicely proportional AB=CD pattern here, with RSX divergence (momentum) present. This is significant. Crosses and confluence on VZO and Stoch RSI, BB %RCT downgoing. Fibonacci offer some static goals. A word on goals - we discourage use of anything static in the markets. The nature of markets is such that the system is far too dynamic for any rigid rules to be profitable. We thus use a dynamic system, such as an indicator based algorithm for exits.