USDCADHi traders, USDCAD is setting up for a downside move watch price action in a lower timeframe and look for short.
NOTE : My view or idea is just a technical base not combined with fundamental so trade wisely GOOD LUCK.
Abcpattern

Atom short abcd pattern After hitting all tp in long atom making abcd pattern for short term if weekly dump come we see completing this Pattern

USDCHF to sell soon?Using the three drives pattern, we can consider that the leg C has been reached (0.618 fib ratio of the entire pattern). This means that buyers are exhausted, reaching a great resistance zone for confluence on the D1.
Here we observe RSI bearish divergences on H4 and H1, with a double top pattern.
Wait for a big candle close below the neckline for more confirmation.
Good luck everyone,
Joe.

Correction of A Bullish Wave What's certain is that we're correcting the upside from 21 July.
It's started.
I think the C corrective wave could be more complete than this and will be in the range of 1714.
With Momentum returning in this area, we expect the end of the correction, and the move for the first resistance in the 1767 range.
If the price stabilizes below 1707, this analysis is not valid.
Good luck

GBPCHF LONGFor a very long time, since 1993 GBPCHF is in down trend and it has created completed the 3rd wave on 1 august 2011. Till then its in a flat correction for the 4th wave of the circle. And for the 4th wave its forming ABC pattern while A & B of the ABC flat correction is also completed and moving for the C leg of the 4th Wave. Today is 15th August, and historically August is the bottom of the 3rd wave, so we expect long position for this pair. For this idea our invalidation level also marked. All the best!

Bitcoin Possible Bullish Scenario 27-28K TargetDare we dream? On Bitcoin . I'm a recovering pessimist, but old habits die hard, so I don't favour this right now. I am more partial to a move down (not too far), but this would be the bullish scenario if the bulls just steamroll the bears after that bounce off the 200 weekly MA. From 22870-27000 (range high includes a 27-28K profit target). This also closes the CME gap, so there's that.
I would actually be in favour of a slightly more bearish scenario, but just posting this because it is possible. I lean more towards a move slightly lower down from here into the mid to low 22Ks (say 22100-500) prior to a move higher, but I am posting this because it is a possibility from here. Also fair warning, I don't really us a lot of Elliot Wave. Also supporting the "slightly more bearish scenario" would involve a trip down into the mid-to-low 22Ks which would likely lure in more bears (late bears) to short, and set up a possible bear trap, and use their money to catapult us higher. I might draw this out, but I don't think I need to atm.

Bitcoin: Positive sideBitcoin could to ending this ABC correction pattern, but we could to forming an accumulation zone from this zone. But in case that we break-out the resistance of $30k. This could be confirmed with pull back, and if pass this test, then, Bitcoin will return to the bull rally.
This it's the positive side only that using some key factor that affect the #Bitcoin price.
1) Inflation rate (Gross Domestic product)
2) Interest rate
3) U.S. Dollar news by Federal Reserve (correlated)
4) Macroeconomic news
***It's very important to read what happen in Forex market (correlated with U.S. Dollar) to know the perspective by medium to long term, and using this fundamental analysis, we could to project the decision on how the global market will work.
Anyway, I will make an analysis in the negative side to know if Bitcoin will forming any bearish correction from this point like 2018 when we forming the descending triangle around 6k and drop 50% to $3k on the 4th quarter of 2018.
I hope that this idea support you

Ethereum could to ending this ABC correction patternEthereum could to ending this ABC correction pattern in weekly timeframe what we look an interesting point to view that in based what will be the reaction of Forex market for the next weeks, I can to take a good plan to change my mindset and look possible bought in the new bull rally, but there're some point that we would need to confirm.
1) Fundamental Analysis
2) Technical Analysis
3) Look the sights by medium to long term in based of these first 2 points.
Well, I share this screenshot in weekly analysis that we formed an ABCD correction pattern and we have the same measurement using Fibonacci for harmonic. So, in based of the ABC correction pattern, we could to se a new bull rally soon. But, this rally we need to support by negative news in the global economy, with more correlated with U.S. Dollar, look the interest rates, Gross Domestic Product and more macroeconomic data to confirm it that Ethereum it's in the good point to bought. By the contrary, we could to invalided this pattern and in case of more crash, so, we don't ending the bear market. We're in the bear market yet, but using some point mentioned above, you can to take better decision to invest in crypto or stocks.
Now, I look that in monthly timeframe, we closed up pretty positive to consider a bought, but I'm interesting to trade and check-out the short timeframe like Daily if we could to see a opportunity to trade Ethereum to long.
I hope that this analysis support you!!!

CRO longterm targets.hello everybody.
CRO seems to be at the end of an ABC correction and compeleting C wave.
according to the 100% wave A retracement and 261.8% wave B extention
and these two levels overlaped.
this level is a good support level.
and momentum is in oversold area and pulledback to exit this condition.
after end of correction we can see a yellow target level that i show on my chart.
this level contains three important factor:
1-moving average 200
2-old valid trendline
3-50% fibo retracement level of ABC correction.
.
.
.
FUNDAMENTAL:
CRO have good fundamental and good news these days.
the most important news was partnership of crypto.com
with qatar fifa worldcup.
and in these 4 5 month we can see good grows in this lovely altcoin.
.
.
.
dont forget to manage your capital and risk.
.
.
.
if you take a trade you must set a good stoploss.
(NOTE!!! this article is my own opinion and its not a trade advice.
please tarde on your own opinion and use others opinion to improve your
analyze.)
.
.
.
so i will do that.please support me and i wish use your experience
and you can help me to improve my abilities.
thank you all.have good days.

ZIL butterfly pattern#ZIL/USDT
$ZIL can shape butterfly pattern if price hold the support zone above 0.786 fib level of last swing high.

ada 15m tf0.618 bounce
expecting an abc correction wave
to form the head for HnS prediction chart pattern

2306 GBPJPY Bear comes back, sell to 163 for 300 pips.Hello traders,
GJ did not reach that high we were looking for.
And on 4H chart, you can see a bearish M head with lower B for sellers. It finished ABC( green) wave in a rough way, it will make a simple strong bearish new ABC (red ) wave down to 167.8-163 very soon based on this chart. So keep eyes on the final candle to see if it is a strong bearish one. Orders from Euro and London session could pull price down, and New York session could make it down further.
GOOD LUCK ON THIS PLAN TO SEEL GJ.
LESS IS MORE!

SPX Possible Elliott PatternI seldom use Elliott wave simply because of the extreme bias it has. I know that the Elliott wavers will say that
there is safe measures in place to correct your hypothesis, but why correct it, just simply use divergences or
some other method of analysis where you remove as much bias as you can? Anyways I do sometimes use it
from a long term and hopefully completed pattern. I mean by that is that I do not add the hundreds of fractals
that others do and settle with the pattern being finished or next to finished.
Here I will borrow from Elliott wave in negating this premise that the markets are about to bottom in saying that
if there is a new bottom and with big volume then this hypothesis is invalidated.
Long term investors should be looking at this. Stops would go below the lowest low. To be safe wait for oscillator
confirmation. Let's hope this is correct. I getting tired of the silly bears.


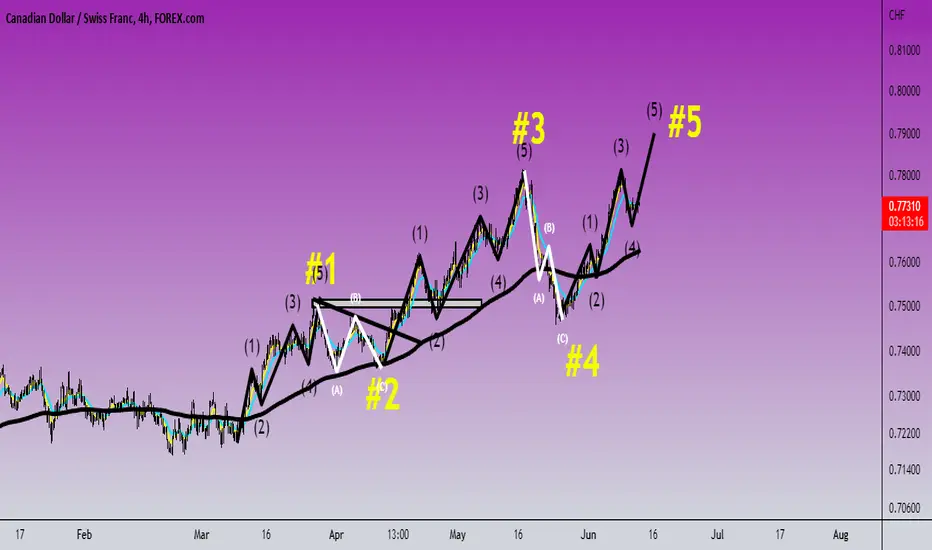
CAD/CHF: Elliot Wave Analysis ProjectionCanadian Dollar/Swiss Franc forming an Elliot Wave Cycle that could to continue up to find the Elliot Wave #5 in this timeframe. But analyzing more deep, the yellow number reflect the Daily timeframe what I draw more better here in my own analysis here:
We're forming the phase #5 of this Elliot Wave Cycle. And look in H4, we see that we're in the good point that we can to bought in the drop of this phase #4 of this Elliot Wave Cycle in H4 timeframe, and now, we're in the interesting point that we could to find up long position following this model and example
Everyday i work better in my analysis and I earn experience to make professional analysis with nice design and template, more understood, classic and modern
I hope that this idea support you.
In some minutes, I will post my 2nd analysis of CAD/CHF to know if we're in the good point to bought!!!
Irregular flatWe are in this waves elliots ABC irregular flat.
Same on ETH
One push to the down and all in. 22/21/20k
And we'll be rich.

GBPUSD is Screaming For a Reversalthis is not a financial advice guys ,it's just an idea worth sharing

SPX - so CLEAN so FRESH Elliott Waves always BLESSHey traders,
We are today analyzing the SPX, and we are going to prepare for a LONG, because we are soon entering the C wave.
" Stock indices in the United States began lower on Friday, driven down by Tesla and Apple shares, as a strong employment data stoked fears of tighter monetary policy and rising inflation "
LMAO
They can talk about anything in the news or what, Elliott Waves is always before the news.
SOooo, either we long now, or at 38.2%, but the strongest objective is right now at 23.6%
No more description needed, everything is on the charts
and also on my previous charts
GL HF

AUDJPY, Sell opportunityhello ladies and lads.
If the counts are correct and if the price breaks lower the trigger, there is a great selling opportunity here.
Keep AUDJPY under your watch.
cheers.

USDCAD Bullish possibility
Hello ladies and lads. Hope you are well.
According to the elliotWaveStructures that we have in mind, there seems to be an opportunity for us to go long on USDCAD for days.
If the price does not fall deeper than our invalidation point (1.24027), we need to consider this possibility.
We do not have any entry signal yet, but it is good to have it on your watchlist.
Cheers.

GBPUSD. Possible Short on GBPUSD in coming hourshey, hope you are well
Based on this chart and what we can see, we are probably at the end of wave 1 structure. So, there is a high probability that we encounter a correction.
I believe if the Trigger line breaks, we can go short and reach our TPs.
Cheers.

WTICOUSD ABC BEARISH PATTERN WTICOUSD has formed an ABC bearish pattern on its hourly chart.
The price is trading below the entry level with potential targets projections to
WALL 110.761
TP1 108.437
TP2 106.776

FTM AnalyzeHi friends.
AN ABC correction will compelete in 38.2% retracement.
divergence between Rsi and price is clear (like i show it).
also momentum is in oversold area.
we see an volume profit support in 0.37$
and a volume profit resistance in 0.7$.
Good luck Friends.
(this isnt trade advise)
