AUDUSD Potential UpsidesHey Traders, in tomorrow's trading session we are monitoring AUDUSD for a buying opportunity around 0.64200 zone, AUDUSD is trading in an uptrend and currently is in a correction phase in which it is approaching the trend at 0.64200 support and resistance area.
Trade safe, Joe.
Abcpattern

EURUSD is Nearing an Important Support!!Hey Traders, in today's trading session we are monitoring EURUSD for a buying opportunity around 1.15400 zone, EURUSD is trading in an uptrend and currently is in a correction phase is in a correction phase in which it is approaching the trend at 1.15400 support and resistance area.
Trade safe, Joe.

DXY Potential DownsidesHey Traders, in the coming week we are monitoring DXY for a selling opportunity around 99.000 zone, DXY is trading in a downtrend and currently is in a correction phase in which it is approaching the trend at 99.000 support and resistance area.
Trade safe, Joe.
AUDUSD Potential UpsidesHey Traders, in today's trading session we are monitoring AUDUSD for a buying opportunity around 0.64500 zone, AUDUSD is trading in an uptrend and currently is in a correction phase in which it is approaching the trend at 0.64500 support and resistance area.
Trade safe, Joe.

Gold Potential UpsidesHey Traders, in today's trading session we are monitoring XAUUSD for a buying opportunity around 3,336 zone, Gold is trading in an uptrend and currently is in a correction phase in which it is approaching the trend at 3,336 support and resistance area.
Trade safe, Joe.

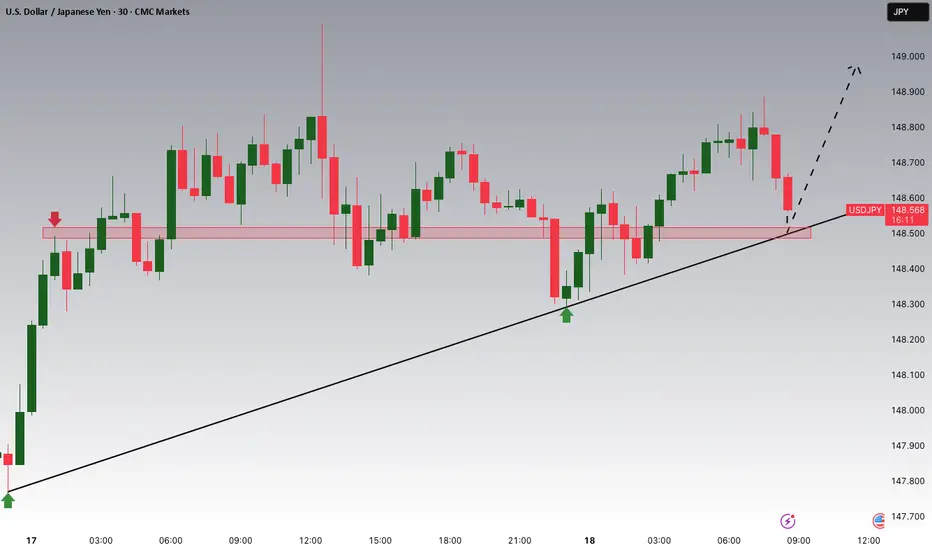
USDJPY Potential UpsidesHey Traders, in today's trading session we are monitoring USDJPY for a buying opportunity around 148.500 zone, USDJPY for a buying opportunity around 148.500 zone, USDJPY is trading in an uptrend and currently is in a correction phase in which it is approaching the trend at 148.500 support and resistance area.
Trade safe, Joe.
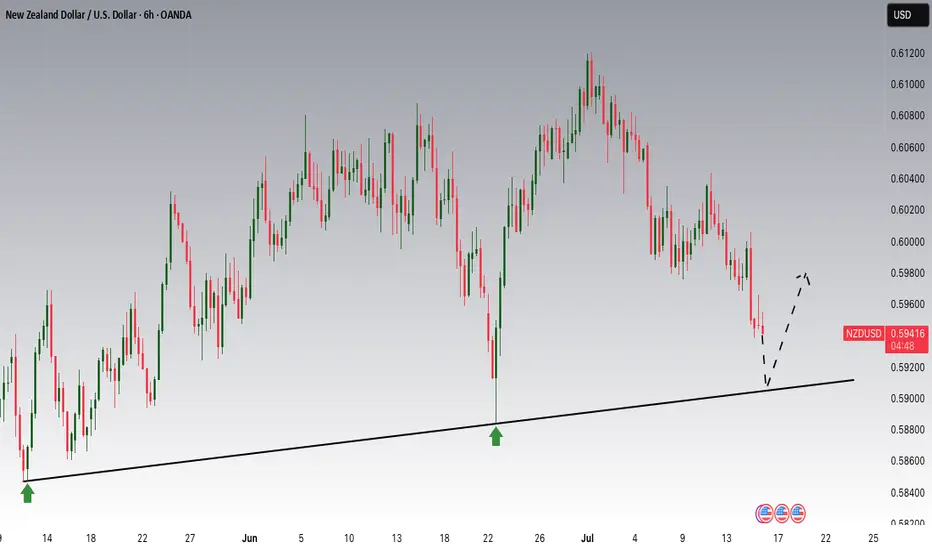
NZDUSD is Nearing an Important SupportHey Traders, in today's trading session we are monitoring NZDUSD for a buying opportunity around 0.59100 zone, NZDUSD is trading in an uptrend and currently is in a correction phase in which it is approaching the trend at 0.59100 support and resistance area.
Trade safe, Joe.
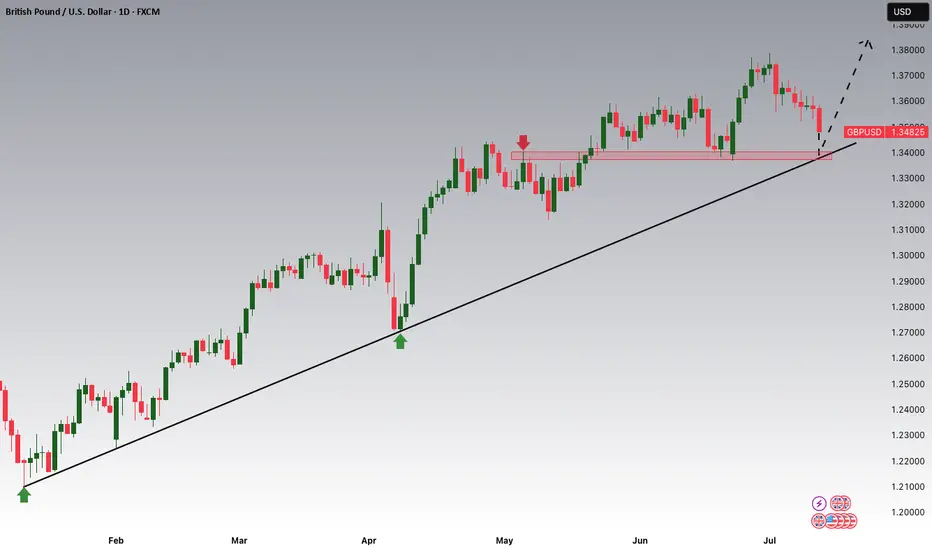
GBPUSD is Nearing the Daily Trend!!!Hey Traders, in tomorrow's trading session we are monitoring GBPUSD for a buying opportunity around 1.34100 zone, GBPUSD is trading in an uptrend and currently is in a correction phase in which it is approaching the trend at 1.34100 support and resistance area.
Trade safe, Joe.
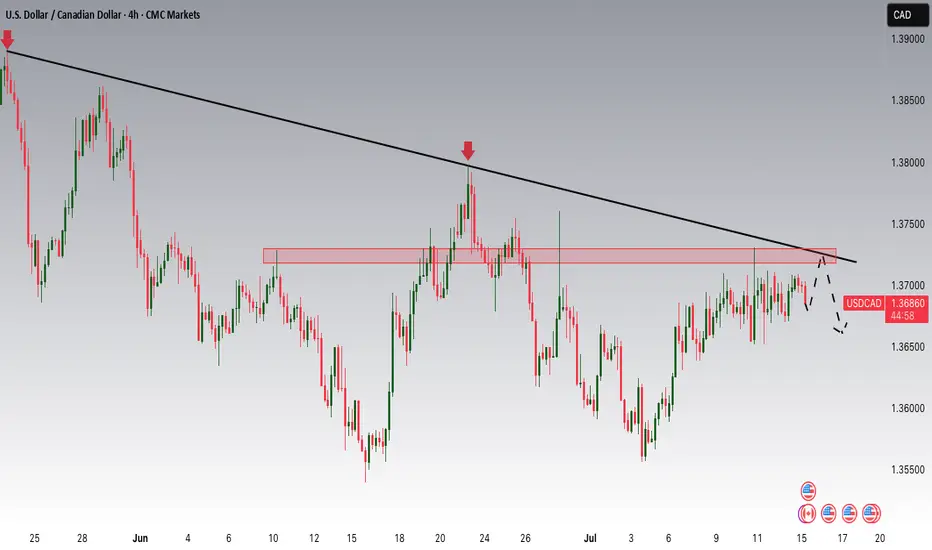
USDCAD Potential DownsidesHey Traders, in today's trading session we are monitoring USDCAD for a selling opportunity around 1.37200 zone, USDCAD is trading in a downtrend and currently is in a correction phase in which it is approaching the trend at 1.37200 support and resistance area.
Trade safe, Joe.
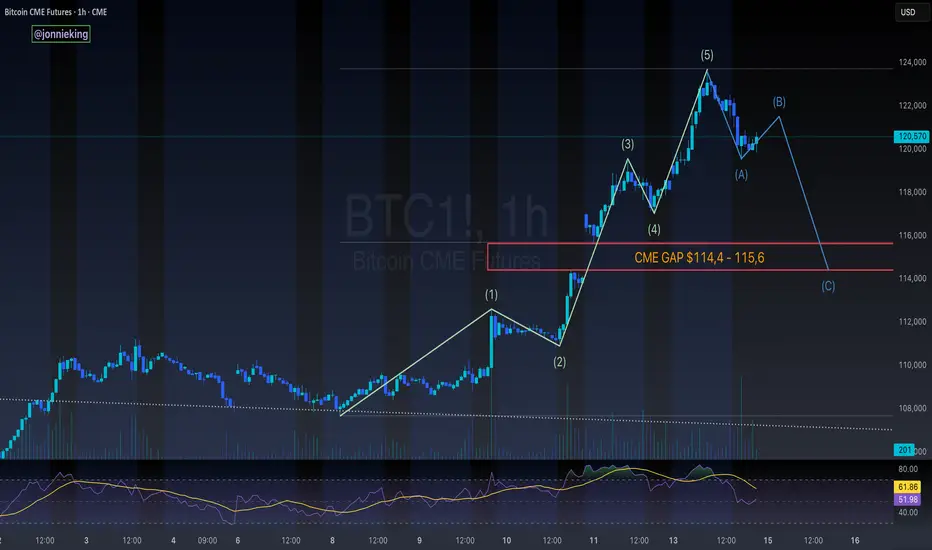
$BTC 5-Wave Impulse > ABC Correction > CME GapCRYPTOCAP:BTC appears to be headed towards an ABC correction after this impulsive 5-wave move to the upside
Would be a great opportunity to fill the CME gap ~$114k
Lines up perfectly with the 50% gann level retracement to confirm the next leg
don't shoot the messenger..
just sharing what i'm seeing 🥸
NASDAQ Potential DownsidesHey Traders, in today's trading we are monitoring NAS100 for a selling opportunity around 22,800 zone, NASDAQ is trading in a downtrend and currently is in a correction phase in which it is approaching the trend at 22,800 support and resistance area.
Trade safe, Joe.

NAS100 Setup Locked In — Ride the Drop from the Order Block!Hey Guys,
I'm planning a sell trade on the NAS100 index from a designated order block. Once price reaches the sell zone, the position will be activated.
📍 Trade Details:
- 🟢 Entry Level: 22,869
- 🔴 Stop Loss: 22,930
- 🎯 TP1 – First Target: 22,839
- 🎯 TP2 – Second Target: 22,794
- 🎯 TP3 – Final Target: 22,671
📐 Risk-to-Reward Ratio: 3.24
Your likes and support are what keep me motivated to share these analyses consistently.
Huge thanks to everyone who shows love and appreciation! 🙏

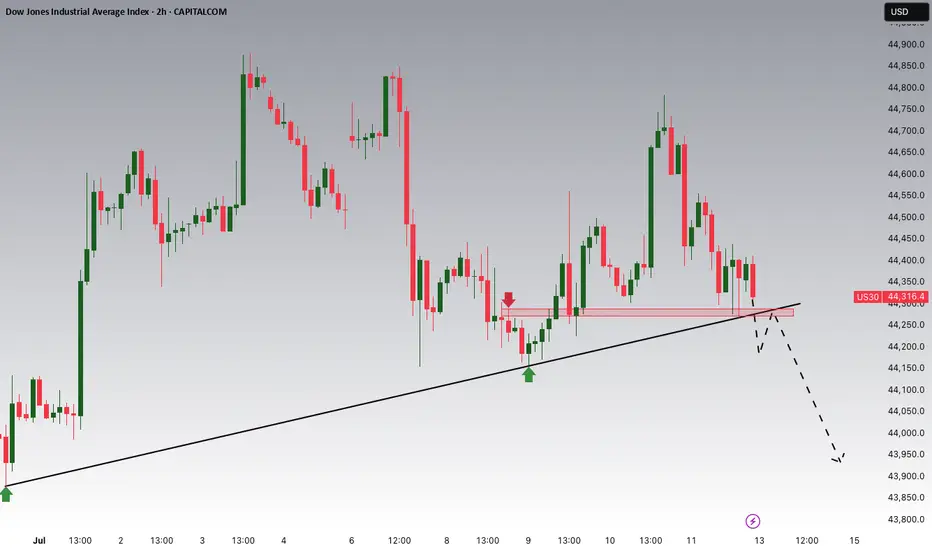
Dow Jones Potential DownsidesHey Traders, in the coming week we are monitoring US30 for a selling opportunity around 44,270 zone, US30 is trading in an uptrend and currently seems to be attempting to break it down, if we get dips below the trend we will be looking for a potential retrace towards further downsides.
Trade safe, Joe.
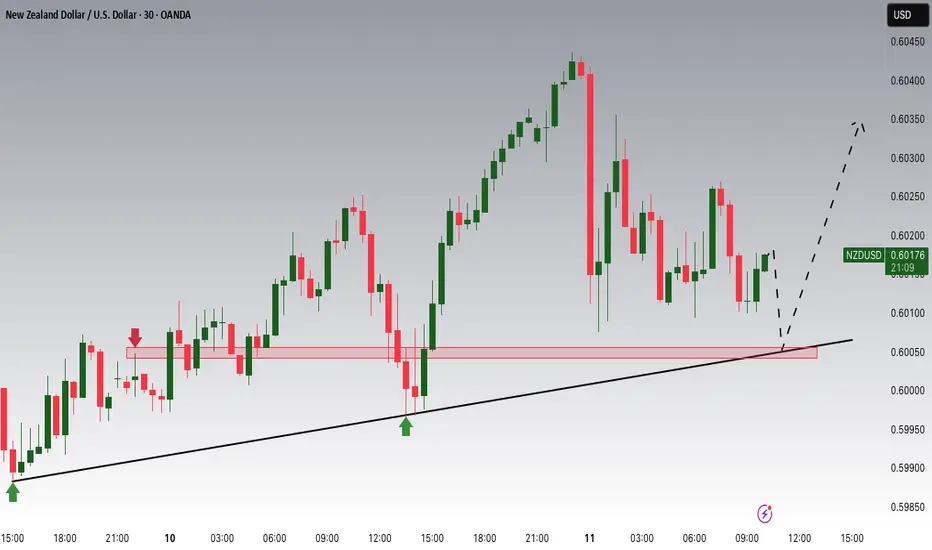
NZDUSD Potential UpsidesHey Traders, in today's trading session we are monitoring NZDUSD for a buying opportunity around 0.60000 zone, NZDUSD is trading in an uptrend and currently is in a correction phase in which it is approaching the trend at 0.60000 support and resistance area.
Trade safe, Joe.
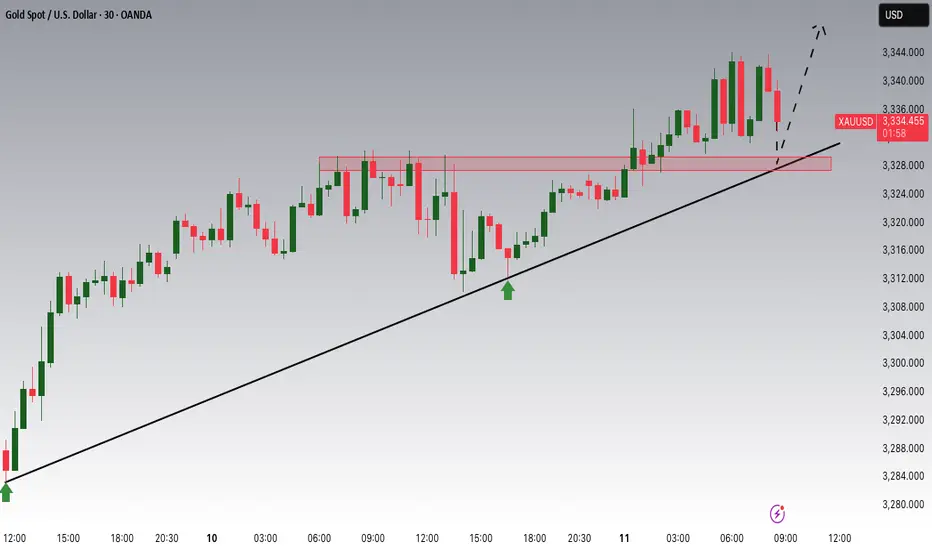
Gold Potential UpsidesHey Traders, in today's trading session we are monitoring XAUUSD for a buying opportunity around 3,330 zone, Gold is trading in an uptrend and currently is in a correction phase in which it is approaching the trend at 3,330 support and resistance area.
Trade safe, Joe.
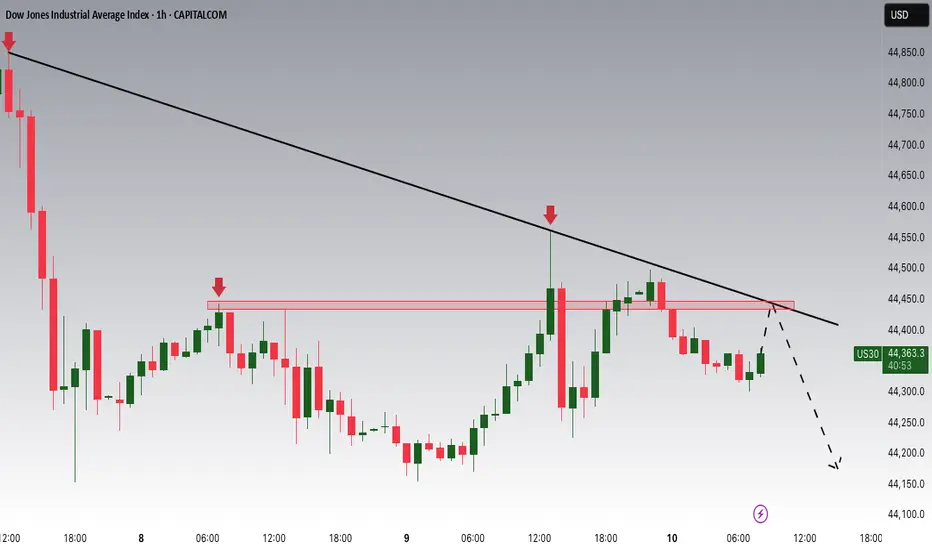
Dow Jones Potential DownsidesHey Traders, in today's trading session we are monitoring US30 for a selling opportunity around 44,450 zone. Dow Jones is trading in a downtrend and currently is in a correction phase in which it is approaching the trend at 44,450 support and resistance area.
Trade safe, Joe.
USDCAD Potential DownsidesHey Traders, in today's trading session we are monitoring USDCAD for a selling opportunity around 1.36900 zone, USDCAD is trading in a downtrend and currently is in a correction phase in which it is approaching the trend at 1.36900 support and resistance area.
Trade safe, Joe.

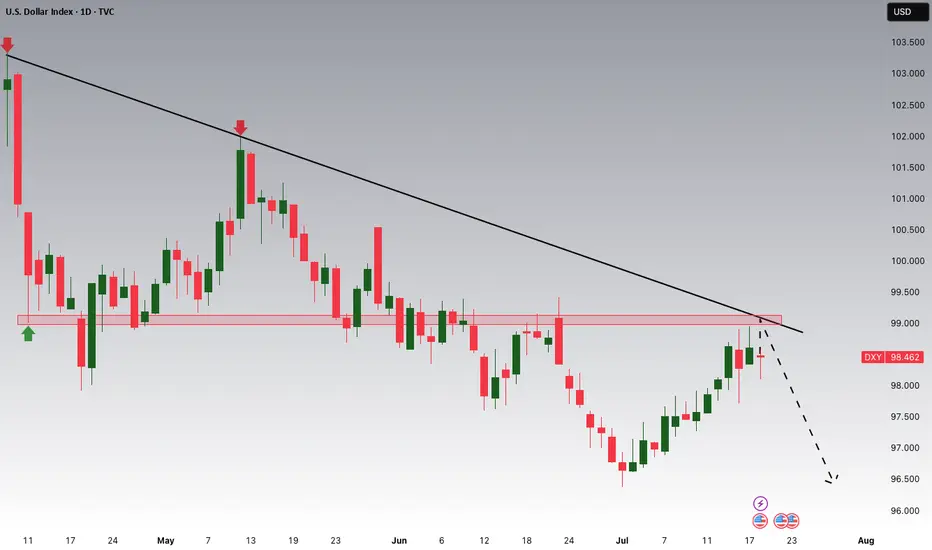
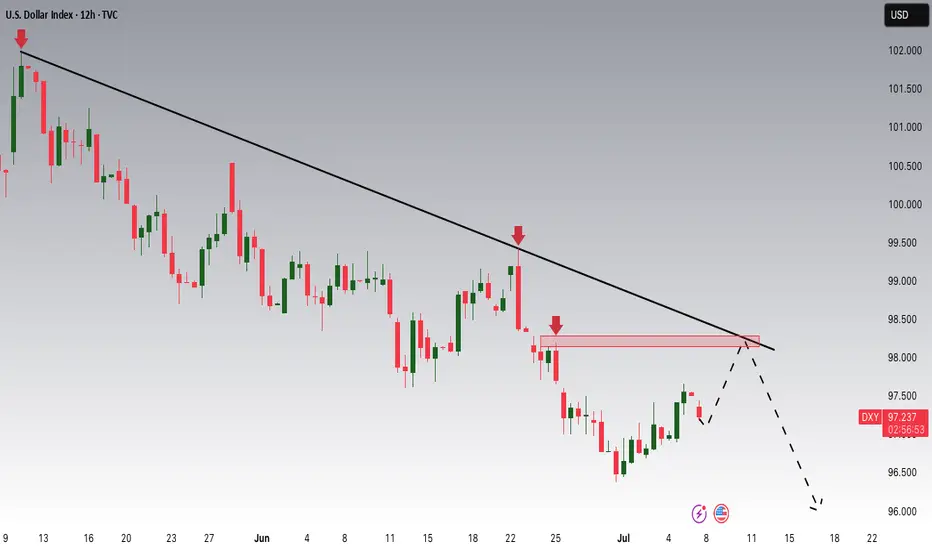
DXY Potential DownsidesHey Traders, in today's trading session we are monitoring DXY for a selling opportunity around 98 zone, DXY is trading in a downtrend and currently is in a correction phase in which it is approaching the trend at 98 support and resistance area.
Trade safe, Joe.
NASDAQ Potential DownsidesHey Traders, in today's trading session we are monitoring NAS100 for a selling opportunity around 22,750 zone, NASDAQ is trading in a downtrend and currently is in a correction phase in which it is approaching the trend at 22,750 support and resistance area.
Trade safe, Joe.

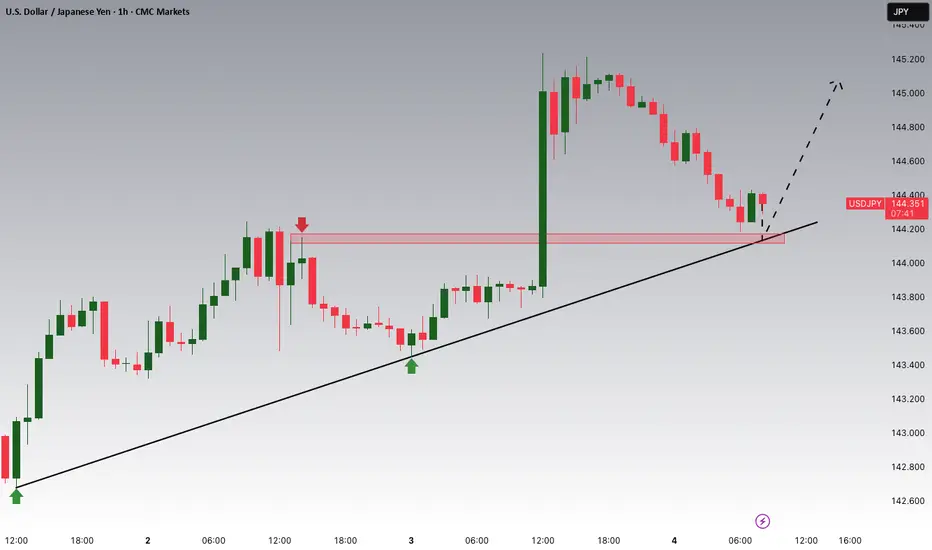
USDJPY Potential UpsidesHey Traders, in today's trading session we are monitoring USDJPY for a buying opportunity around 144.100 zone, USDJPY is trading in an uptrend and currently is in a correction phase in which it is approaching the trend at 144.100 support and resistance area.
Trade safe, Joe.
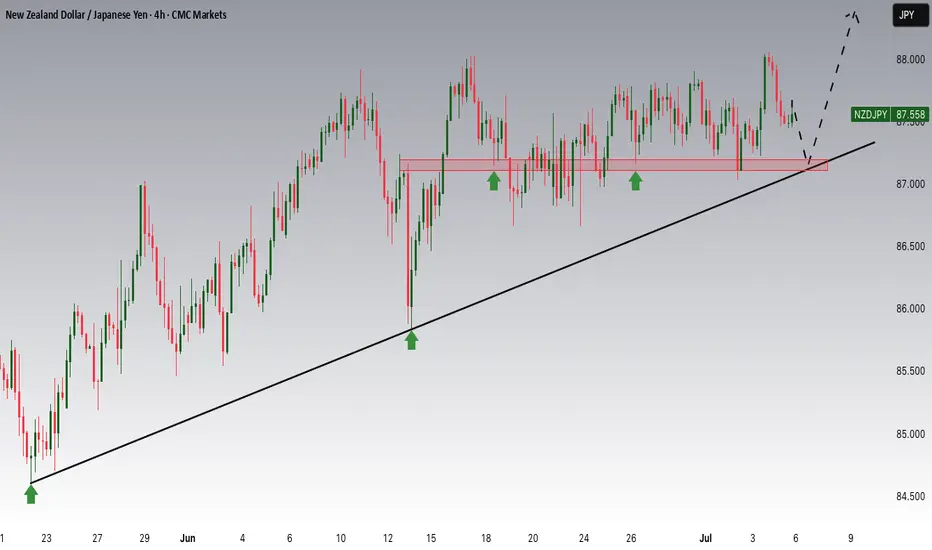
NZDJPY Potential UpsidesHey Traders, in the coming week we are monitoring NZDJPY for a buying opportunity around 87.200 zone, NZDJPY is trading in an uptrend and currently is in a correction phase in which it is approaching the trend at 87.200 support and resistance area.
Trade safe, Joe.
Gold is Nearing an Important Support AreaHey Traders, in today's trading session we are monitoring XAUUSD for a buying opportunity around 3,340 zone, Gold is trading in an uptrend and currently is in a correction phase in which it is approaching the trend at 3,340 support and resistance area.
Trade safe, Joe.

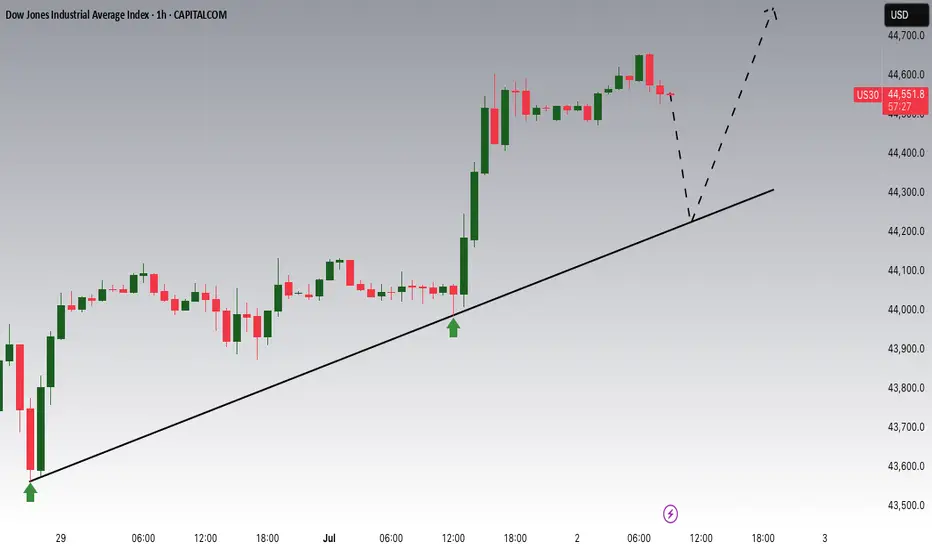
US30 Potential UpsidesHey Traders, in today's trading session we are monitoring US30 for a buying opportunity around 44,230 zone, Dow Jones is trading in an uptrend and currently is in a correction phase in which it is approaching the trend at 44,230 support and resistance area.
Trade safe, Joe.