Abnb

ABNB with a double bottom pattern?!Airbnb!! This might indicate the beginning of a reversal! The only thing issue regarding this analysis is that, it would have been better if the distance from the 2 bottoms were more than 3 months. Besides this, it looks pretty clean! And i'm liking this 0.786 region.

$ABNB - Major Buy Zone! -4 HR Timeframe
-Inverse Cup and Handle
-MACD = above signal
-RSI = Sexy af and room to run
-Price targets labeled
-Set S/L (stop loss) at $119.61
Calls:
$145c 8/6 (3.00)
$148c 8/6 (2.00)
$155c 8/6 (0.69)

ABNB - Hitting the Potential Support!-Normally S1 at around $130 would be great support but still hasn't proved itself. For mid and long-term investors like us, this is a dip price to buy of course but for short-term retail investors, a buy signal hasn't formed yet.
-There is still a potential to drop to S2 at around $120.
-For long-terms, buy the dip guys, short-terms should wait!

$AAPL $ABNB $MSFT $SHOP I OptionsSwing WatchlistAAPL 1D I After catching the break to the upside on AAPL, it seems a bit overextended. Our price target is near $155, the RSI is already showing a bearish divergence.
ABNB 1D I Expecting a run up into earnings on 08/12. $130 has to hold or it could flush. Watching for a possible reversal with volume around this area.
MSFT 1D I MSFT has been trading within a channel since the end of 2020. A bearish divergence is present and a pullback is expected soon.
SHOP 1H I Watching above $1,450 for calls, and below $1,425 for puts. Risky plays as it leads into earnings. We are seeing a possible bull flag or descending H&S.
ABNB - 5 wave impulse soon! ABNB currently forms a range that has a corrective effect. I like to trade breakouts. And here I expect an upward impulse soon in my imminent scenario. ABNB still has some room to build another low. A possible level would be 135.93. According to my calculation, the probability of a retest is still 35%, as we have not overcome the high of 1 (orange / 153.82) yet. If this is the case, only 157.39 have to be overcome. I am trading a superordinate wave 3. Statistical target 180 USD. Pullbacks are worth buying. Anything above 129 USD is ok and wouldnt invalidate my setup. I expect a 5 part upward movement soon.

Over $158 61% Fib and she's gone After being shorted and slowly consolidating, abnb has some huge upside potential with summer time travel in the works followed by earnings in Aug.


ABNB early entry?May be or maybe nothing. Would like to see close above 156.50 with good follow through day. Support and resistance levels as marked.

ABNB - long from 136 area KEY NOTE - SPECULATIVE SETUP - not a financial advise - do your own analysis
⏳ Analysis TF - 15 minutes
A correction is possible with a little room to move lowed without impacting the trend higher
Looking to buy at dips around 133 to 136
Retracement to support area
Analysis / Trade Setup / Long and then short
± Short-term Bearish # Long term-Bullish
± Support and Resistance in play
± Major Falling broken
± Bullish trend reversal
± Go long for more $$$
± HAPPY TRADING

ABNB - WHERE THE HATERS AT? LOOKING FOR 160PT - ASCEND TRIANGLE
All,
ABNB looks good as I previously compared was indentical to BMBL on wave 2 big buy would have big returns and it did. Only question does it break out the top of this ascend triangle here or bounce down one more wave in pattern off trend then break. Need to see next week.
Outside factors:
-Obviously DJ/SPY tanking is never good for companies overall.
-Breaking below 2nd yellow uptrend (in pink would be a small put position for $10 150 to 150) Do not think this is likely at all though

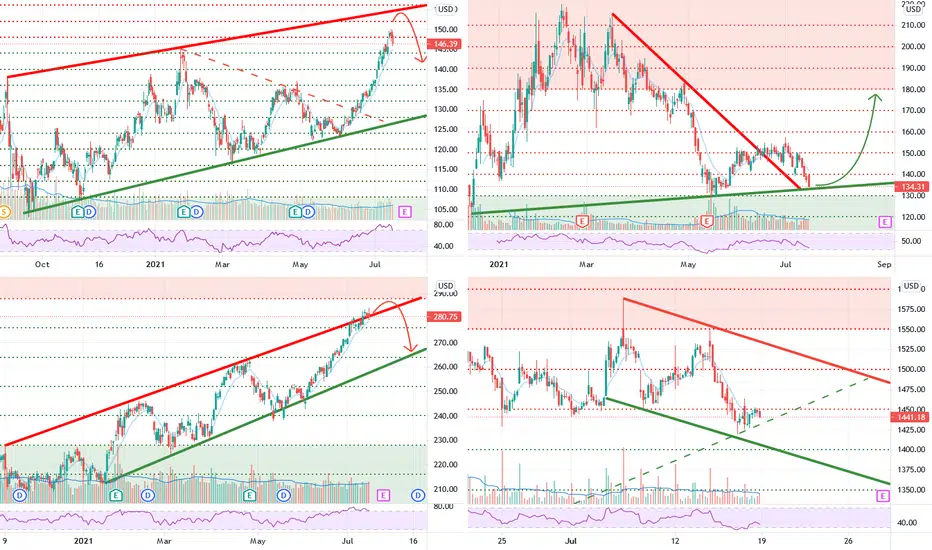
TSLA PUT PLAY (IF IT FAILS) HUGE GAIN 460SAll,
Pretty obvious what happens when TSLA hits this downward trend. I will be buying PUTS .. IF!!!
1) it clearly loses buying pressure
2) no positive news
3) selling pressure
4) BREAK of previous high
Any of these not occuring and it finally/somehow breaks it there will be a massive bull run at least 740+ afterwards in which I will be bullish.

$AAPL $NFLX $ABNB $SNOW I OptionsSwing WatchlistABNB 2H I Following ABNB closely as it is breaking a downtrend from March and travel is near pre-covid levels.
AAPL 1D I Tested and broke out of the triangle we highlighted last week. We want to see a consolidation outside of the triangle before the next run.
NFLX 1H I Our bullflag paid last week, we want to see NFLX consolidate above $500 and continue its run up into earnings.
SNOW 4H I Following growth stocks, particularly cloud stocks as they are making a quick comeback. SNOW is near IPO levels and we want to see consolidation above $250 for continuation.

AIRBNB - ABNB - ADDING WAVE 2 - 160-175PT CALLSAll,
I think ABNB once retraces a tad more will be ready to move up onto wave 3. In the even SPY crashes we may see a double bottom instead. Otherwise I will be adding soon maybe today just depends.

Technical analysis update: ABNB (8th June 2021)ABNB has been publicly traded since 10th December 2020. ABNB has enjoyed wild ride up and down since then. Currently, we think there is high possibility that ABNB bottomed out on 19th May 2021 and that there is good chance it will continue upwards. Stochastics, MACD and RSI are bullish. In addition to that moving averages are also bullish. We would like to update our short term price target for ABNB to 160 USD per share.
Disclaimer: This analysis is not intended to encourage buying or selling of any particular securities. Furthermore, it should not serve as basis for taking any trade action by individual investor. Your own due dilligence is highly advised before entering trade.


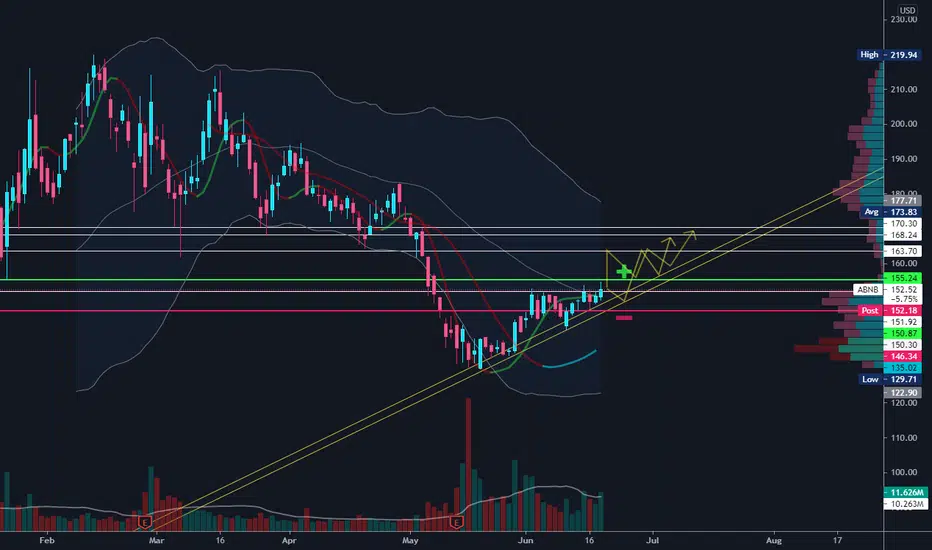
ABNB: Retest of 21EMA, Then a Rally to the 50DMA?ABNB lost some steam yesterday after testing a 153 handle. We saw some light inflows today at the open, which have now been erased, but we look poised to test the 50DMA sitting around 156.36. We also have room to run toward the upper band of the triangle around 160 if the 50DMA is captured, where we should see strong resistance and possibly a continuation of the recent (persistent) downtrend. A break above the upper band resistance would see us breakout and a new uptrend would form. The major headwind here is sentiment around growth. If the Fed comes off even remotely hawkish, growth is going to tank...

ABNB - LONG - CHANNEL NEEDS TO BREAK TO MOVE HIGHERThis is a complimentary analysis from my 1st chart on ABNB, looking for a short term channel break to enter with stop/loss at the channel, and profit targets at 1:1 fib ext and 1:1.618 fib ext. The volume profile is showing empty volume in this area so it is likely that we should see hyper movement to the upside soon here just waiting for the ignition. I will not enter this until 2 30m candles close above the current channel.

$ABNB So close to the break today...Love this one for a reopening position. Beautiful cup and handle still looking primed for a break out

ABNB updateABNB 2HR TF
-----------------
Analysis
Wave 3 of 3 in motion, failed pennant breakout last week but bounced nicely off bottom channel trendline with lots of room to the upside to run.
*Levels and in depth analysis on previous post*
