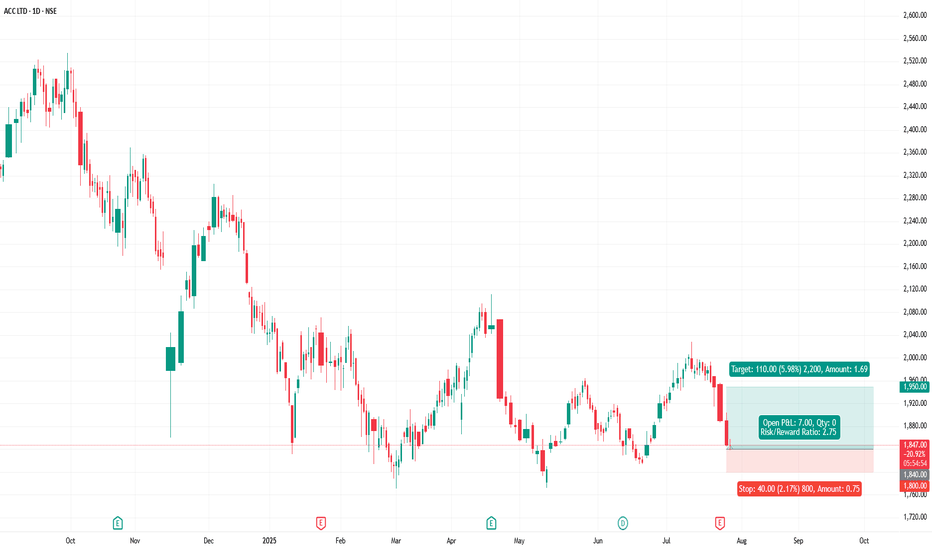
ACC - ACC Ltd (Daily chart, NSE) - Long PositionACC - ACC Ltd (Daily chart, NSE) - Long Position
Risk assessment: Medium {support structure integrity risk}
Risk/Reward ratio ~ 2.75
Current Market Price (CMP) ~ 1848
Entry limit ~ 1845 to 1835 (Avg. - 1840) on July 28, 2025
Target limit ~1950 (+5.98%; +110 points)
Stop order limit ~ 1800 (-2.17%; -40 points)
Disclaimer: Investments in securities markets are subject to market risks. All information presented in this group is strictly for reference and personal study purposes only and is not a recommendation and/or a solicitation to act upon under any interpretation of the letter.
LEGEND:
{curly brackets} = observation notes
= important updates
(parentheses) = information details
~ tilde/approximation = variable value
-hyphen = fixed value
Accltd
Analysis for ACC LTD
We have a fresh Monthly Supply formed which is a Source Supply and we have a Monthly fresh Destination Demand.
We have further divided the Supply Demand Equilibrium into 5 parts giving us an understanding for which specific area should we Buy or Sell into.
Now the most important part the trade analysis.
We have a short position for a reward of 2.4 at the risk of 1.
ACC - Elliott Wave CountACC - Elliott Wave Count
ACC finally breaks down from the c to d channel so we can expect down side target of the 1400 range with Wave E.
Please note that this information is solely for educational purposes, and it is essential to exercise caution when trading.
NSE:ACC NSE:ACC1! BSE:ACC
BULLISH ENGULFING ON WEEKLY CHART !!Hello to everyone
A significant decline has been seen in the price. The price trading near key demand zone and price respects the support level and moved towards upside on weekly chart. Price also formed bullish engulfing formation on weekly timeframe, which is showing that price has strength to go upside. If price respects the bullish pattern than we can expect good bounce back rally in the price.
#ACC LTD 📊
👉Price at key demand zone 1660/1675📈📉
👉Bullish Engulfing Formation on weekly chart
👉Support seen at 1660/1665✅
👉Reversal sign📈
👉Targets 2045/2165 +🎯
👉Add to your watchlist👍
ACC LTD Wait for breakout & retest.The idea here is about ACC LTD.
mentioned below are the points to be considered
Points as per TA on a Weekly Chart:
1. Inverse Head & Shoulder Pattern almost complete.
2. Bullish Ascending triangle formation with top flat & bottom rising.
3. Trading way above 20 & 200 EMA on weekly chart.
4. Strong Kumo breakout on weekly chart (Ichimoku Cloud).
5. RSI is at 60.28 on a weekly Chart.
6. MACD way above signal line.
7. Hull Moving Average is a Buy Signal on a weekly chart.
8. Wait for breakout & retest @ 2400.00.
9. Stop loss just below lower low of right shoulder.
10. Projected target as per inverse Head & Shoulder on the chart.
Disclaimer: “The above is an idea only and not any kind of financial or investment advice. So please do your own DD (Due Diligence) before any kind of investment”.
Do you like my TA & ideas !!
Want to keep yourself updated with current market action, then please follow my profile for more analysis.
Cheers.
ACC Short Term BreakoutThe stock has previously broken out with good volumes and retested the upper trendline, the point of entry. Trade is supported by brokerage calls and Supports Nearby.
Risk Reward Ratio - 2:1.
SL is placed below the previously upper trendline. Target is placed near the swing high based on fundamentals.
ACC - Weak Price ActionThe price structure looks weak and there is a probability that the stock can fall further towards 1730- 1710 levels.
To continue weakness, should sustain below 1900 levels.
Immediate resistance is around 1860
The trend change level is 1900.
In conclusion, as long as it trading below 1900, any rally if comes in the stock, might be used to create fresh shorts in the stock.
Disclaimer: These posts are for educational purposes, if you are trading this, Trade at your own risk.
ACC Limited seems to be Dicey a bit and may Fall Soon 20/02/2021as we can see the price has retested its ATH and it was trending in an ascending wedge, where at the Squeeze Section we are observing Bearish Divergence with MACD, which is the sign of trend reversal and probably some retracement of the same bullish trend.
this divergence can act as Hidden Bullish Divergence if the Price break it current Resistance zone in Red Box and its ATH, and the Bullish target can be 2080 easily.
the other scenario of Bearish trend reversal we can target the Support zones up to the Green box where i have mentioned the Heavy Support Zone, we can have 61.8% level as a good target in case of trend fall.
we can short it in any bullish pullback and ride it to the next Support area and trill our SL accordingly above the Support which turns to resistance.
we should have a good eye on NIFTY for better trend prediction on this ticker.
please comment your opinions...


