Accumulation Patterns - very bullish background Coterra EnergyAssessing the market according to the wyckoff method, we see a classic accumulation in the attached chart.
1.2.3 - Shortening of Thrust - smaller and smaller distances between particular lows on the chart. A sign that sellers are losing power.
833.263.173 - decreasing volume on lows. The numbers in the chart are the sum of the number of shares sold on swings divided by 100k (ex on chart 833 = 8,330,0000)
742 - The largest buying wave in the system confirms that institutional capital has been pumped in.
A very interesting last candle suggesting that there is still an upsell and most likely we are dealing with the absorption of short selling by professionals
Value with a large potential range of growth
Indicators used: Wyckoff Wave Chart
What do you think about this chart?
Follow us for updates!
Accumulation

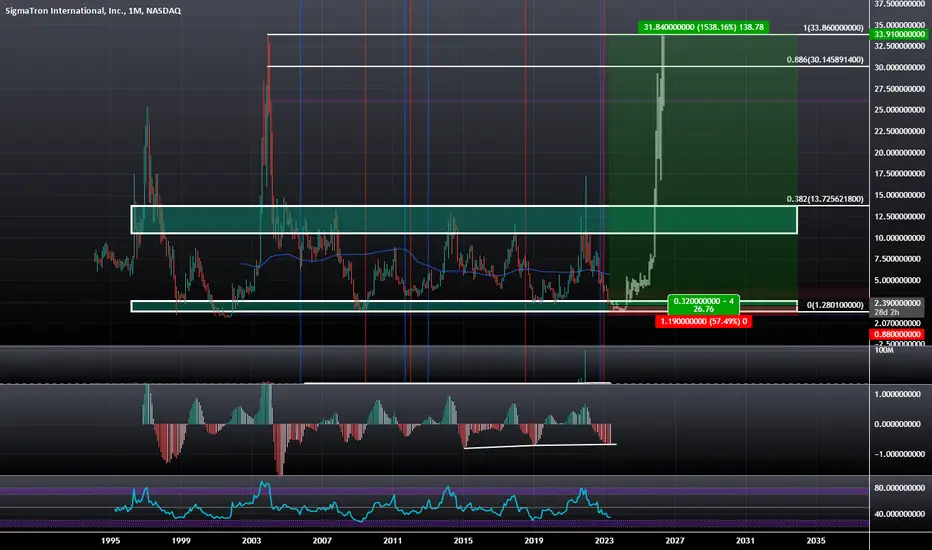
$SGMA: Bullish Divergence within a Range at Support LevelWe have a good amount of Bullish Divergence at the Support level of a long standing range as well as what looks to be a future W shape that could take us up to a minimum of $30.
Wyckoff Cycle - Practical Example 📚Dear TradingView community and fellow traders,
I am Richard, also known as theSignalyst.
I find the BTC weekly chart to be intriguing as it appears to be following the famous Wyckoff Cycle.
I would like to apply Richard Wyckoff's four market stages/phases to this chart for analysis as a practical example.
1️⃣ Distribution
BTC appears to have rejected the 68,000 level and is now in a distribution phase
2️⃣ MarkDown
After breaking below 56,500 back in November 2021, BTC entered the MarkDown phase and began making lower highs and lower lows.
📉 The bearish impulse movements were initially large and steep. However, starting in July 2022, the bears seem to have exhausted themselves, resulting in a flat and small impulse movement.
According to Charles Dow, this signals an early alert for a potential shift in momentum, which brings us to the Accumulation phase as per Richard Wyckoff.
3️⃣ Accumulation
BTC is currently trading within a big range between 15,500 and 25,000 in the shape of an inverse head and shoulders as it forms a minor lower low followed by a higher low.
4️⃣ MarkUp
BTC broke above the previous major high marked in gray, indicating that the bulls may finally be strong enough to take over for the first time since late 2021, thus entering the MarkUp phase.
🏹 BTC is now approaching a key resistance/supply zone. For the bulls to remain in control from a long-term perspective, we need a weekly candle close above 32,000. Alternatively, the bears may still form one last HL before BTC breaks above 32,000.
I hope you find this post useful, and I would appreciate your likes and support.
Which scenario do you think is more likely to happen first? and why?
📚 Always follow your trading plan regarding entry, risk management, and trade management.
Good luck!
All Strategies Are Good; If Managed Properly!
~Richard

EURUSD in DepthThis is the bigger picture of the main Idea that I posted on the Daily time frame. Here we can see the accumulation with the beautiful volumes in the demand zone of the range. The level of control can be seen on the daily time frame in the attached idea and it is in the same are of the demand zone. So the Level of control is validated and playing an important role in defending the price to not falling.
So we have now the complete setup. Good luck.

EURUSDPrice is playing around an important level of control, it's clearly accumulating above it, we can see this accumulation in lower time frame, but the daily time frame is to understand what the volume is telling us. EURUSD clearly don't wanna fall soon, so I predict yo see price moving to the liquidity zones upside, and we will see how price will react with each of it before taking the next decision.

BTC long run outlook everything has been confirmed using MA200 plus adding a reversal trend following mid-May 2023 to 2024 onward. correction point would be expected to be around 24800 price point with confirming accumulation breaking trend upward of 31300 point, but a rejection point seems to be expected here minor shorts may be happened due to heavy buying and selling. overall if breaks reversal shorts to longs could confirm the long run from 31300 points to its ATHs zone.

Oil Accumulation/Volume Divergence Classic- Accumulation phase along with low volume may indicate we have started to
halt shorting and may return to an imbalance marked by the white Rays,
Good signs shown early in NY session, we will monitor this price action as the week continues.
Disclaimer : Not financial Advice, I am not a Financial Advisor

GBPUSDGBPUSD seems like it will not fall. A big consolidation is taking place in the daily time frame. In the intraday frame this could be a good trade to catch, a lot of positions already been accumulated in the demand area down.

Bitcoin Wyckoff and Elliott WaveThis is the structure I have been discussing on Twitter, YouTube, and elsewhere since the June 2022 swing low. Wyckoff methodology indicates that it is likely accumulation. The Elliott Wave count may or may not be correct locally. We want to see an impulsive breakout above that ascending red dashed resistance to signal that the wave ((ii)) flat structure may be complete, but a breakout above wave (b) is required to add confidence to that count. Further breakdown has a target of the daily pivot. If the count is correct, then wave ((iii)) of 3 has a minimum expected target of $42350 from here. The Daily RSI is printing hidden bullish divergence at the moment, but we need confirmation that it is complete. The daily Stoch RSI has reset into oversold, so a breakout of oversold would add more support to the idea that wave ((ii)) is complete. We can also note the red parabola. While price remains above that curved line we should continue to expect higher, overall, rather than a larger pullback.
Let's see if we can get that rally from somewhere around this area.

XRP Breakdown and Re-accumulation This fractal pattern has played out 2 other times in the charts and looks like it could play out again.
Both in 2017 and in 2021 XRP broke out of is descending resistance and then started to bleed back to its trend line.
This 2023 fractal closely resembles the 2017 fractal, if we start to see a slow bleed into the 4th quarter of the year, watch for 1 strong sell wick to the down side in the accumulation zone, that will be your buy signal.
Both fractals in the past had a strong capitulation wicks which were quickly sucked back up into the tight range.

BTCUSDT wants 30k?BTCUSDT had an accumulation phase of 270 days, which is a period of consolidation before a potential move in either direction. After the breakout from the accumulation phase, the price is now heading towards the first weekly resistance level, which is at a psychological price level of $30,000.
It's possible that the price may reach this level and experience a rejection, as it is a significant resistance level. However, if the price manages to break through this resistance level, the next clear resistance level is around $40,000, which is a significant level to watch for traders.
As shown on the chart, the price is currently testing the 0.382 Fibonacci level as resistance, which is another key level to watch for traders. The 0.5 Fibonacci level is around the $30,000 area, which is the first weekly resistance level that the price is currently approaching.
–––––
Follow the Shrimp 🦐
Keep in mind.
🟣 Purple structure -> Monthly structure.
🔴 Red structure -> Weekly structure.
🔵 Blue structure -> Daily structure.
🟡 Yellow structure -> 4h structure.
⚫️ Black structure -> <= 1h structure.
Follow the Shrimp 🦐

🔥 BNX Breaking Out After AccumulationI've made several BNX analyses over the last couple of months, but after the 100:1 swap the token has only been losing value.
However, after a 1 month+ accumulation phase BNX has finally broken out and is looking for more.
I'm waiting for a move above the dotted resistance before considering an entry. Patience is key here. Targets in blue.

Accumulation Manipulation Distribution Ran into this 'AMD' concept on Twitter, never looked at charts as such. Can this NASDAQ:SMH Daily chart play out as such? Does it make sense to indicate Accumulation Manipulation and probable Distribution like this, or do we need more for this (?)
Keeping an eye on it this way is harmless. Let's watch and see how it plays out. Always keep learning.

Solana ($SOL) - Sleeping Giant | VatsikEvening Folks,
Here I provide some context around my analysis on Solana and I predominantly focus on specific technical criteria, I am a structural price action trader.
I think retail is sleeping on this giant - letting it drift away from portfolios via the uncertainty of its future, similar to that of Ethereum in 2019. This is fair, as an investor, to be wary of.
Will it recover, is the narrative of NFT's over, is FTX the collapse of Solana?
Time will tell, but from a purely objective and technical standpoint, I will let the chart speak for itself before making my ultimate decision.
Boiling it down - consolidation under resistance = bullish pressure and supply pinching -> asset appreciates in value (price).
We had bearish consolidation in Q4 of 2022 and lost support (see chart). Now? We are seeing bullish consolidation below resistance and about to lose 28 dollar area resistance imo - a major high time frame area of interest, much like 6k shelf on Bitcoin last bear market. Reclaiming this critical level is essential and powerful.
Solana is ranging within a downward sloping channel with shallow corrections, above a major market structure break (msb) at 15.5 dollars that has already been tested.
Hold the local 20 dollar support and origin of current leg breakout, hold the downward sloping channel's low, and of course hold my directional control point (DCP) at 15.5 (bears fully back in control below my DCP level) then price has no where to go but UP. Anything in the green zone, above my DCP, is bullish as bulls are in control. Higher lows on a trending asset = bullish.
Breaking red to the upside, on high time frame resistance, with multiple candle closes (Daily or H12) and we will push to the lower quarter range (QR) in the prior range we traded in mid-late 2022.
Channels don't disappear if they or broken, they tend to come back later, once price enters them again. They always exist and price likes to trade at them (up/down) - imagine your favourite spot to grab lunch, you likely frequent this location often and in turn have good and bad experiences there.
Eventually the macro range EQ and upper 50th percentile (higher QR and RH) will be tested, believe this.
If Solana survives this market and pulls out ahead, we will see new all time highs imo.
Again, while we sleep on it, it is making moves and following the above criteria, fundamentals aside, price will release with expansion on a supply pinch from initial and re-accumulation.
This range it is attempting to reclaim is only the beginning, until the real supply pinch occurs from the re-accumulation we are witnessing in front of our eyes right now.
Choose your side, I know mine.
Manage your risk and DYO! NFA
Vatsik

$LINK Accumulation Range
Crypto and a fave of mine, Chainlink .
$LINK has been in a range for almost a year. With crypto in general moving up in Q1 of this year this is one to watch.
There is a diagonal resistance from Aug 2020 on the horizon. Diagonals over a long period are ones to watch and a flip here could see buyers rush in.
This is probably a good place to accumulate but if you want to wait for a breakout to trade, you have two areas:
1. The flip of diagonal resistance
2. Breakout from the range top.
Link is definitely one to watch.

Bitcoin - Analysis for the next few weeksAfter the accumulation that took place from June 2022 to March 2023, it is now time to test the breakout from the accumulation. There is a strong resistance zone at the $28000 - $30000 USD level that will be difficult to break through. However, breaking through it should lead to a fast move towards the next zone at $37500 - $40000 (where bitcoin distribution occurred in the past, when it was bought below $15,000).
In the near future, I suspect a pullback after the recent growth to around $25000, where there is an interesting support line that dates back to January 2021. I believe that there is a re-accumulation taking place at these levels.

DYDXUSDT is in accumulation PhaseBINANCE:DYDXUSDT is creating an accumulation phase on the $2.5 area above the demand zone on $1.8.
An accumulation phase is a period of time when the price of an asset moves sideways or consolidates within a range, typically after a significant price move or downtrend. During this phase, buyers and sellers are balancing their positions, and the market is forming a base of support for a potential future uptrend. Accumulation phases are often characterized by decreasing trading volume and volatility, and can last from several days to several weeks.
According to Plancton's Rules, if the price of BINANCE:DYDXUSDT grabs new liquidity and breaks out below the $2.5 accumulation zone, it may suggest a bearish trend. Traders could consider entering a new short position with the expectation of a continued downtrend, with the potential next target being the $1.9 area.

DATAPRP accumulation phaseDATAPRP still below EMA 200
Accumulation phase weekly Chart
Support 0.170
Need to breakout with strong volume For next phase.

SFP/USDT 1D. Basic trend. Local situation. Channel.In the basic trend of the coin a downtrend channel has formed. The price is now near the medium of that channel.
In the secondary trend we have pumps from time to time. From the last pump a downtrendline has formed in the secondary trend.
In was broke out and retested. Shown on the chart. From that breakout a symmetrical triangle started to form. The basis of it is 180%(666).
The price locally is near the support of that symmetrical triangle. Locally it's in consolidation for more than a month with buy outs time to time.
The nearest local target is the resistance of that triangle(near 40%). The more medium term target is about 180% which lays on the top of the basic trend channel(downward one), the top of the secondary trend up channel and it's also the target of the secondary downtrend(which was broken previously).
With this coin also it's brother TWT might move, but the cap of the last one is slightly higher than the SFP.
Also i guess it's worth to notice that there was a manipulation with the capitalization of SFP. It raised more than 3x, while the priced hasn't moved that much.
You can check it on the coinmarketcap on the page SFP, by clicking market cap near the chart.
With TWT, however there's no such thing happening, but there is abnormal capitalization from the start of the trading pair on binance(huge pump before listing).
Time cycles also tell us that there's a pump possible closer to 14-16 april.
I attached my ideas on ru language. It's on TWT and SFP.

BITCOIN ($BTC) - Re-accumulation or Distribution? If this is in fact a re-accumulation range, we do not want the lows of current range to be broken.
Green liquidity zone would be a perfectly healthy correction - but it would lead me towards this current PA not being a form of re-accumulation, which does make a difference regarding where we are in the market cycle.
Vatsik

NIFTY Prediction for 2023This is basis two things from 2015 when similar patter emerged. I have matched with 2015 keeping the time lengths in mind.
1. What are the phases?
2. How long do the phases last?
IS there any match with Elections for the final pump heading in 2024 Generals?
All the points match up beautifully to the perfection. Please refer to my previous one given below for matching with 2015
This is not for trading, this is for investment accumulations.
Note : For traders there's always a bull market somewhere, stick to high relative strength stocks and keep SLs. Thats all, simple.

$DNA Possible Accumulation. Fib levels very reactive.A pretty compelling argument for a classic Wyckoff Accumulation pattern. We know some people like Woods are investing heavily into this market, so it's not a long shot to assume there are others. Whether we see a spring or LPS our way up to SOS is TBD, we could shoot in either direction as it stands. PTs are at $7-$15 according to analysts. This seems to line up with extensions. OBV shows each consecutive low on the PA is higher on the OBV. This is a great indication of an increase of strong hands ownership. Overall, I think I am mostly bullish at the current level. Should we happen to dip lower for a spring, I will significantly add to my position.

AAPL insider trading and net cash flow from positive to -70Mil AAPL with all of it's great achievments has what seems started to run out of steam.... With insider trading recently and net cash flow going from a surplus in 2019 to trending negative since and at -$70 mil currently.... I see signs of weakness. Looking at the chat there are clear signs of manipulation and gapping up over solid resistance areas to get to where it is today. This recent pull back for re-accumulation looks like a failed re-accumulation mid run. This is apple so I am not sure how much of a fight this will put up. However, I feel confident this will drop to at least close the gaps. 8 Days should be enough for the $161 traget. 36days should be safe for a Price target of $152. Which seems ambitious when looking at it from the top but its been on a straight 45 degree angle since Mid March. However, this is the same stock that took from Jan 2021 to Mar 2023 to finally make support out of the $140s. If this pulled back to $152 it would be completly conservative compared to those 2 years.
This $152 area is the last place there was synergy between volume and price. Which means this is the last place buyers and sellers saw eye to eye for a period longer than a few hours.
If you like or are intrigued by this analysis pls like and follow and of course hit the BOOST button as thats how more people will be able to see this.
This isn't financial advice and I wouldn't suggest blindly following my trades, if you see the price going against save your profits and or money and look for another entry.
by iCantw84it
04.06.23
