Accumulation

BTCUSDT - ConsolidationHello traders!
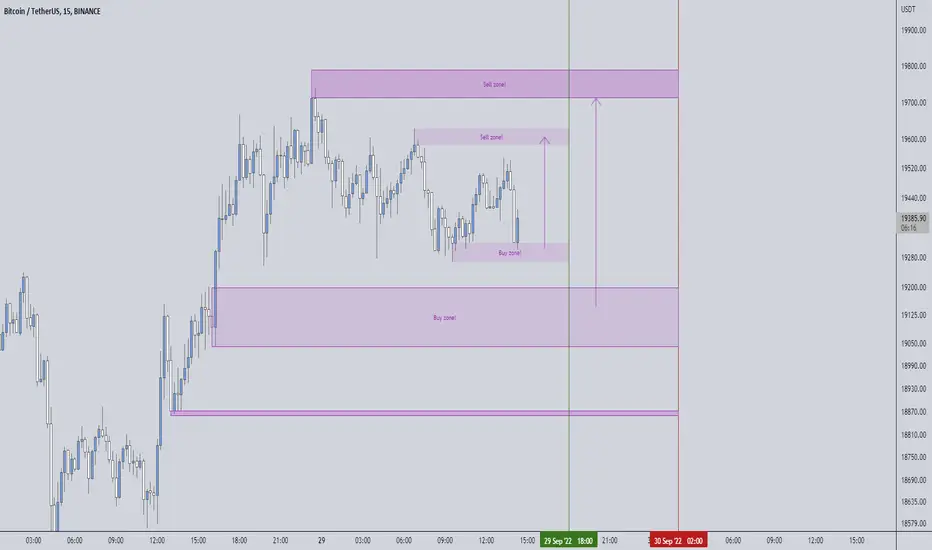
Trading bitcoin at this time is becoming more and more difficult because volumes are decreasing and thus we are getting into a larger consolidation that accumulates a number of orders that sooner or later decide to create a large volume candle in one direction or the other.
The question is where, we will never know, but we can open positions in both directions, but we need to find a suitable opportunity to buy and sell, from which we can assume that the M15 is currently in consolidation and that is why I have marked the zones where I would like to look for a buying opportunity as well as a selling opportunity for such a consolidation, always pay attention to a good distribution of TPs so that you do not have to close any of the positions at a loss if the price turns against you, if it helps us to open positions in both directions and then a breakthrough comes, we can make good money.
IMPORTANT WARNING:
---------------------------------------------------------------------------------------------------------------------------------------------------------
Rebounds from marked zones created by trading positions of large institutions such as banks or various financial funds may not create new HH or LL and therefore it is very important to collect partial profits at least according to these rules. This will help you to keep your equity curve constantly growing and protect your funds from big drops if the price unexpectedly turns against you. But the decision is only in your hands.
I personally prefer setting up multiple TPs , here's an explanation:
1) 1:1 allows you to take a 50% position and thus secure a balance against loss in case the market turns
2) 2-5 :1 means profit (25% trade volume ), after reaching this TP I move SL to BE
3) 5-10 :1 means bonus money with rest of trade volume (again 25%)
Money is lying on the ground, just bend down for it! Be patient and wait for the price to reach a strong zone and open a position!
Long BTCUSDTInvesting and trading is a game of probability where the market moves up, down or sideways. Hence, the probability of a trader winning is around 33.33%.
In my previous idea, one guy thought he was smart when I talked about this accumulation and refused to admit that he is wrong.
The crowd and retails are always wrong, people are too bearish at the bottom of a cycle and too bullish at the top of the cycle.
Sometimes, trading and investing is so simple with just copy and paste. But some people tried to be smart,
A lot of traders try to be right after I warned about the institution Wychoff's manipulation and some refused to listen and give into whales manipulation.
Some traders tried to aim for 16k price for BTCUSDT to buy the dip, but it never happened, the only way you can get rich is to buy at 20k and HODL.
Talked about it so many times and yet people still love to donate to the market trying to be smart.
The cryptocurrency , Bitcoin or BTCUSD is now trading at the golden support again with whales manipulating retails to short at support before doing a Wychoff's accumulation and reverse to the upside.
The manipulation was a huge success but I tried to warn the stubborn poor retails traders but yet they refused to listen. Only few listened, I hope they are in profits now.
Bitcoin prices had been ranging around at 20k as I said and now it had made a double bottom , soon it will continue to go up and everyone will get rich. A double bottom of a double bottom .
It had made an impulse correction and soon will go to 35k to fill the gap and beyond, to da moon.
On weekly, the chart had not broken the low and is making a higher high, soon it will go to the moon, buy now.
Amplify your gains by using leverage, long here and u can be filthy wealthy. Time to go all in and get rich.
Bitcoin or btcusd had made a double bottom technical structure. Bitcoin is doing the same Wychoff's accumulation and soon shall reverse the trend and bottoms here.
Do not be tempted by whales to short on bear traps!!
Warning, DO NOT short the market and get short squeezed. Buy the DIP.
I see a lot of retail traders lost money shorting bitcoin at 20k instead of buying it, this is your last buying opportunity before we move up to 35k to fill the CME gap.
The whales had been doing manipulation on bitcoin and ethereum .
It had already made a 5 waves up and will do a correction before pushing further up to 35k to fill the cme gap.
DO NOT MISS THIS last chance to buy the dip opportunity.
The whales are tempting you to short bitcoin so that they can push the prices up by doing this sideways movements.
Do not be deceived by the whales manipulation.
This manipulation by whales are food for them as retails traders getting liquidated easily.
The whales are accumulating. It is trapping breakout traders to short here, this will bottom here.
Long btc . Sick of this sideway obvious manipulation by whales.
On a higher time frame, it made a impulse and ABC correction, soon it will moon and everyone will get rich like WOW?!
This is not a signal and do not follow but a trade idea. Use your brain to trade and don't follow blindly!
Disclaimer - This analysis alone DOES NOT warrant a buy or sell trade immediately. Before you enter any trade in the financial market, it is very important that you have a proper trading plan and risk management approach

$SPY $SPX - #SPY #SPX Where is the S & P 500 Index headed next?On Friday September 23rd, the FED held a very important meeting to discuss the current issues that we are facing economically, while most of the comments were bleak, there were a few clues that our supply chain could finally see a light at the end of the tunnel by next year (not without heartache of course).
The largest issue we are facing is supply chain & employment retention issues.
The supply chain will be slowly improving now until the end of the year.
If you are following my social media page, I've stated that shipping prices will see a decline beginning this week (shipping is a large part of our supply chain issues).
The second large issue is understaffed production. I believe this will adjust as more corporations begin laying off workers, the job market will tighten, making entry level positions more competitive.
Real Estate will get slaughtered into the New year to make housing more affordable, but keep in mind we do have a shortage in homes (considering how many millennial/gen Xers are still living with their mamas). New home builders cannot profit with high inflation, high interest loans and a declining real estate market. The will begin to pay off debts first to avoid the new high rates and then buy back single family homes to flip for profits and/or buy back their own beaten down stocks. As FED pivots, homes will get purchased again so not at all am I expecting a 2008 scenario.
When the FED decides to pivot, the best place to hold cash will be BITCOIN, GOLD, SILVER, STOCKS, (possibly real estate if you have cash on hand) ect and at that time $DXY will drop and the Dollar will no longer be the best store of value.
I listened to the entire 2+ hours of the FED meeting and after analyzing the current data and Jerome Powell's hawkish nature, I'm NOT expecting a big bounce in the S&P 500 Index anytime soon.
The shorts are piling in and for good reason because we will definitely drop down and make a fresh low this year. A pivot in our current sentiment isn't happening next month, the bounce going into October will be much weaker than the previous one we just had, maybe just to squeeze enough shorts out of existence before actually making the plunge into the final accumulation pattern.
I will keep updating my thoughts as more data is printed but for now this is an estimate of how I see the price action flowing on The S & P 500 Index.
Happy Sunday!!

Possible rise for Bitcoin to break the topPossible rise for Bitcoin to break the top
But the level of 19020 must be broken strongly
Beware of false BREAK

LUNC 30 min bullish dragonWe have a possible bullish dragon for LUNC on the 30 minutes chart at the bottom of a range. We got the head, body, spine, and two legs. Let's hope this breaks out

DOGE gonna BITEPA getting sandwich'd hard. Only matter of time until it explodes.
Might either directly go from here or after some sideways action for accumulation (similar to ALGO, see here )
Target
Shorterm Local 0.618 @ 0.475 (6x)
Midterm Major 1.272 @ 0.926 (13x)
Hold my beer pls
----
No financial advice, do your own research, don't be stupid

Possible Wyckoff Accumulation range on LUNCTracking this possible range of accumulation a bit early but it looks like we've hit a secondary test (ST) in phase B and possibly going into phase C with the last point of supply (LPS) being accumulated by holders and market makers. It goes with the narrative that everyone just jumping onboard with staking and becoming a validator node for the network.

Long BTCUSDTInvesting and trading is a game of probability where the market moves up, down or sideways. Hence, the probability of a trader winning is around 33.33%.
A lot of traders try to be right after I warned about the institution Wychoff's manipulation and some refused to listen and give into whales manipulation.
Some traders tried to aim for 15k to buy the dip, but it never happened, the only way you can get rich is to buy at 20k and HODL.
Bitcoin or BTCUSD is now trading at the golden support again with whales manipulating retails to short at support before doing a Wychoff's accumulation and reverse to the upside.
Bitcoin prices had been ranging around at 20k as I said and now it had made a double bottom , soon it will continue to go up and everyone will get rich. A double bottom of a double bottom.
It had made an impulse correction and soon will go to 35k to fill the gap and beyond, to da moon.
On weekly, the chart had not broken the low and is making a higher high, soon it will go to the moon, buy now.
Amplify your gains by using leverage, long here and u can be filthy wealthy. Time to go all in and get rich.
Bitcoin or btcusd had made a double bottom technical structure. Bitcoin is doing the same Wychoff's accumulation and soon shall reverse the trend and bottoms here.
Do not be tempted by whales to short on bear traps!!
Warning, DO NOT short the market and get short squeezed. Buy the DIP.
I see a lot of retail traders lost money shorting bitcoin at 20k instead of buying it, this is your last buying opportunity before we move up to 35k to fill the CME gap.
The whales had been doing manipulation on bitcoin and ethereum .
It had already made a 5 waves up and will do a correction before pushing further up to 35k to fill the cme gap.
DO NOT MISS THIS last chance to buy the dip opportunity.
The whales are tempting you to short bitcoin so that they can push the prices up by doing this sideways movements.
Do not be deceived by the whales manipulation.
This manipulation by whales are food for them as retails traders getting liquidated easily.
The whales are accumulating. It is trapping breakout traders to short here, this will bottom here.
Long btc . Sick of this sideway obvious manipulation by whales.
On a higher time frame, it made a impulse and ABC correction, soon it will moon and everyone will get rich like WOW?!
This is not a signal and do not follow but a trade idea. Use your brain to trade and don't follow blindly!
Disclaimer - This analysis alone DOES NOT warrant a buy or sell trade immediately. Before you enter any trade in the financial market, it is very important that you have a proper trading plan and risk management approach

APE/USDT SETUP hello traders
Liquidity has been seized and distribution has begun, and I expect a sharp drop in prices


MICROSOFT ACCUMULATION AREAMICROSOFT ACCUMULATION AREA, long-term
1ST entry 2022 possible 2nd entry 2023


XAUUSD LONG hello traders
The gold is under the control of the bears, but the buyers are still strong, and liquidity will be expelled before the price drops, so you can look to buy or wait for a good selling opportunity

ETH - diamond top or the beginning of accumulation phase ?Hello,
Looking at the ETH post merge can note few observations:
1. We are most probably in a Diamond Top reversal pattern on the 1D chart which is already in play ---> Target: The previous range high right below $1,300.
2. The current price action on the 1D chart looks A LOT similar to the one we had back in the period February-May, 2022.
3. The ETH/USD 1W chart suggest a Wyckoff Distribution #2 is still in play with the price being in Phase D currently. So, we are looking at the following grim scenario
4. But what if we are already in the Accumulation phase ? (bullish case)
Well then we are to see something like this
Cheers,

EUR CHF LONG hello traders
in today session i buy eur/ chf target 1.27 fb level target 2 supply zone

AUD/JPY SETUP High success rateHELLO TRADERS
I placed a pending buy order at the demand area, stop loss below the accumulation, the target is the same length as the strong bullish wave
This is my view of the AUDJPY currency pair
Let me know if you agree or disagree in the comments


DXY (ANALYSIS ) Support and Resistance
liquidity
price action
Accumulation
break out
pullback
impulse wave

BTC LONG hello traders
Bitcoin is approaching demand levels, I expect the selling liquidity to be expelled
It may be a temporary rise,
To execute a buy trade I need a strong reaction from buyers from the demand levels

