JICPT| Tencent in the late stage of accumulationHello everyone. It's been a while since I published ideas regarding Tencent. After analyzing the global market to identify the sweet spot to park the assets for my client, Tencent again got my attention.
From the daily chart, we can see the key anchored level around HKD412 is well respected after massive sell-off with above the normal volume. In my opinion, Tencent is in the process of accumulation, perhaps, the late stage.
The upper boundary of the sideway channel is HKD515 to HKD528. I'm looking for big size candle with high volume to take over it.
By setting the alert, let's see how it reacts to the boundary this time. The next target after confirmed breakout is HKD644.
What do you think? Give me a like if you're with me.
Accumulation

GME Breakout daily candleGME range expansion today after a 9 bar consolidation. 15% more rally estimated based on the mode. Previous mode was accurate.
Bought ATM Feb 18 calls for $10.00

XRP - The Trend Has Started To Reverse To The UpsideXRP has held the lows and with recent BTC pump it is safe to say that we have reversed from here. We could still hang out at these prices for a bit but not very long. I still expect prices to pause at certain trading ranges (colored boxes) but generally not for long as we have accumulated long enough to eventually expect parabolic rise of some kind.
I am not a financial advisor so none of these should be taken as a financial advise. Be well.
BINANCE:XRPUSDT

Doge Wyckoff Method Accumulation Schematic #2 Phase CI dont know much really, I just drew some stuff with my crayons. but check It out, I like I like !

ADAUSD Accumulation and DivergenceImportant things to note:
BTC has swept the lows, yet there is no sign of a liquidation candle.
This leads me to believe there is no fuel and the open interest you see are FOMO shorts.
Since they are collaterized with stablecoins, this makes sense.
So like I said before, I believe we are at a bottom at 40k for BTC.
I also expect the bears to be punished next for their FOMOs.
There will likely be pain here and there, but I still believe we are going to range in 40-53k for awhile longer.
ADA has finally capitulated and broken support to test lower support.
ADA has a rather clear accumulation zone with bullish divergence.
I believe ADA will see a spring soon.
Important dates to note:
I will be adding the ADA upcoming events soon.
Hey everyone! If you are reading this and have not been shaken out, first let me say congratulations! Not many people make it this far. Overall, I still believe we are at the bottom of our range of 40-53k. We have swept the lows for BTC and yet there was no liquidation candle sending us to 32k. Even more, open interest has been climbing which leads me to believe these are FOMO shorts. Another reason is the contracts have been collateralized with stablecoins vs btc which is something you do when you are shorting. There is not much to see when it comes to on-chain data, no alarms, no top indications, nothing. So, I believe this whole China ban actually set us back a few months. I do not think crypto has recovered just yet. Now, for ADA we finally saw the capitulation that the rest of the alts say (especially ETH), by breaking its support and heading down. If you look at the structure of the blue box you will recognize this as an accumulation zone. All we need is a spring which I believe will come in the form of the bullish divergence we see on the chart. This will send the price up to test the resistance, hit a support and if all goes well, break past resistance. It is important to take every test one step at a time. Do not get ahead of yourself. Especially while BTC is trading in the "no mans land" zone. I will be updating my other charts with entries as well! Enjoy! Also, whoever sold their ADA to me this morning, thank you, I will see you again at the top! LOL. Thanks again everyone!
So, tell me what you think!
This is not financial advice. Do your own due diligence.

Wyckoff accumulation pattern in 33-38k rangeJust an idea, but if my conclusion correct, BTC is in a Wyckoff accumulation pattern, that is between 33-38k. If the upper zone test will success, we are ok... if not, we go to under 30-32k levels.

Accumulation now over?Price has been trading within this range for the better part of 2 months now. Most probably an accumulation after the markdown. We are almost about to rocket out of there.
Looking for the spring and a close within this range again and show signs of building support
Alternatively We look for the break and retest of the resistance for a continuation down the channel

Lets be real: the big picture (SPY)if you zoom out and really think about it we havent held a downtrend for long enough to say a broader bear market taking years to regain. even if it lasts less than 9 days, we have always bounced at accumulation levels such as this even during corona and the following recession. im not saying trust this as the bottom, but there is long money willing to make bull, and a temporary short squeeze is normal under these conditions. sunday there will likely be continued selling, but aiming for at least gap to close up is reasonable. after that, the magnitude and direction of volatility based on that move with fib auto trend extension will determine how far we will go in this last week of january. if we head down immediately, or we dont retrace enough to find a higher low, we could see further downside which, for the time being, is almost certain upside is almost certain as well. tutes, mm, smart money is going to play the oversold bounce game for a while when they find a place. we are entering an accumulative phase soon. this does not mean higher prices are guaranteed. accumulation means a sell climax is beginning. panic selling to new monthly lows is a contrarian buy for swing trades.
427 is a low target
434 is a pivot
437, 447 are high target
may the force be with you, always.

Wychoff accumulation GBPUSDENTRY will be LPS - Last point of supply where it will react of the order block where the TEST tested the spring


BTCUSD - NEAR ENTRY!!!Price has neared our area of interest, price has already reacted off that lower orange area. but we need to see an accumulation at this lower area before we start to see price go higher. At least, that is my opinion.
Lets see what happens!

BITCOIN's Perfect WYCKOFF Pattern!Hey guys!
Hope all is well. These are sure times of uncertainty. Market crash? Recession? Supply Chain Issues? Collapse of Evergrande? Hyper Inflation? Central Bank Digital Currency? These are all factors deciding the market currently. Be patient - Bitcoin's rally's happen in a four year cycle. This is when emotions need to be taken out of the picture. We may see another couple of years of consolidation and accumulation before Bitcoin decides to rally again. I think we may see 20K next year as a spring for Bitcoin before the next rally - and mark my words, it will be a big one. We need a decentralised world, one where politicians can't control the supply of currency for self interest. Cryptocurrencies are the way, and it is for the people to decide.
I will keep updating this as we go, but for now - predictions on price action are silly.
Love, peace, Seb.

Long on Kritinut Buy kritinut fast .
Big player accumulation happening
very Soon it will double inshallah

Bitcoin OlympicsLook at the similarities between both wyckoff accumulations.
The only thing that scares me is that all of crypto twitter expects this. crypto twitter might not be the best indicator, but media is a part of how the fear & greed index is messured so i think it's worth mentioning.
What i mean is that, if everyone expects it to drop towards $40,5k one last time, there will be so much liquidity below that level. This might cause large institutions or the composite man to send bitcoin below 40k towards lower imbalances or orderblocks...


ACC next move is upward very soon 3580acc is about to give breakout hold and wait for good profit .........DM FOR MORE CLEARIETY.................

Bitcoin - Spring in spring - accumulationBitcoin - Spring in spring - accumulation. This is a similar diagram I found on the web. Accumulation continues at the present levels

CAD/CHF Update!As you can see, Wyckoff played out perfectly and moved up 270 pips from the test of the schematic which was shown in the post on December 15th! There was loads of opportunities for trades during this move up, because once you know the direction price wants to go, it is easier to find trades following the trend. I am now looking for a bigger correction for price to then move up even more.
Feel free to leave a like and a comment about the idea!

URA: Buying The Dip on Boomer StocksThis is the year for my boomer friends to buy the dip on their favorite long time value stocks and commodities. That being said, it appears we have Wyckoff Accumulation happening on Uranium. I'm noticing a lot of dip buying with Pleiades bands widening to the buy side while we are chopping sideways.
I could see one last shakeout (or Spring) to allow the stock’s dominant players to make a definitive test of available supply before a markup campaign unfolds into March.
Short Term downside shakeout targets
23, 22.72, 22.26, 21.60
Longer Term upside targets
27.60, 31.20, 35.11, 40.72
Catalysts
1.) Saudi Arabia to develop 'huge' uranium resources in energy diversity push
www.spglobal.com
2.) Demand from other countries may increase for energy alternatives as price for oil, natural gas, and other commodities keep going up with inflation.
school.stockcharts.com
www.world-nuclear.org

BtcUsd possible buy in the next months if Wyckoff plays outHere's my 5 cents on BTC and what I see as a possible Wayckoff accumulation. For now the accumulation is not complete yet so we have to wait.

BTC accumulating and trading sidewaysI'm just a day trader sharing my ideas, please do not take them as financial advice. Always do your own research.
It's been a while since my last update, and on my previous idea, I expected BTC to spring off support at 41k, which it momentarily did before heading to lower lows.
We had a false breakout to 39.6k, which lasted no more than a few minutes (Scaring a lot of traders), followed by huge buying pressure which took the pair to 42k (5% increase) in a couple of minutes, showing the unwillingness of buyers head down lower, and a lack of power from sellers.
However, this buying pressure alone wasn't enough to break pattern and BTC seems to be trading sideways for the moment between the levels of 41k and 42k.
A daily close above 42k would bring a long of bullish momentum, with short-term targets like 45k (Where local resistance resides), while a close below 40k would send the pair to newer lows, like 38k (Where stronger support can be found).
That being said, there are still clear signs of accumulation, with big wallets stocking up on BTC at a discount, so a bounce from this levels is not out of reach.
The market is highly leveraged right now (And risky), and liquidations and stop losses being hit can increase volatility fast.
I think BTC has reached a decisive point, and looking back in time, we can see that moments like this (Where bottoms are reached) have brought great opportunities (Alongside a lot risk).
I am still bullish, stocking up on every dip, and bringing my average entry price lower.
We have to stay vigilant, avoid entering over-leveraged positions, and remember to always take profits along the way.
Good luck everyone!

BITCOIN BULL TRAP?! IS BTC HUNTING US? NOT AN INVESTMENT ADVICE!
Right now bitcoin brokeout the (kinda)major trend and we may say the bear is over.
However this might be a bull trap too. As you can clearly see there is a wycoff accumualiton pattern going on.
My main idea is; if you still have open orders you may close it or may not it depends on you.
We generally see when bitcoin goes horizontal the dominance relaxes. That means ; You can trade some alts cuz when dominance relax, some alts pump. You can follow the alts in 1hour or 15mins.
SO,i think the danger is still on board. Be careful people.
If the wyckoff pattern goes like this, i belive we gonna rise to the moon.
Happy Trading people.

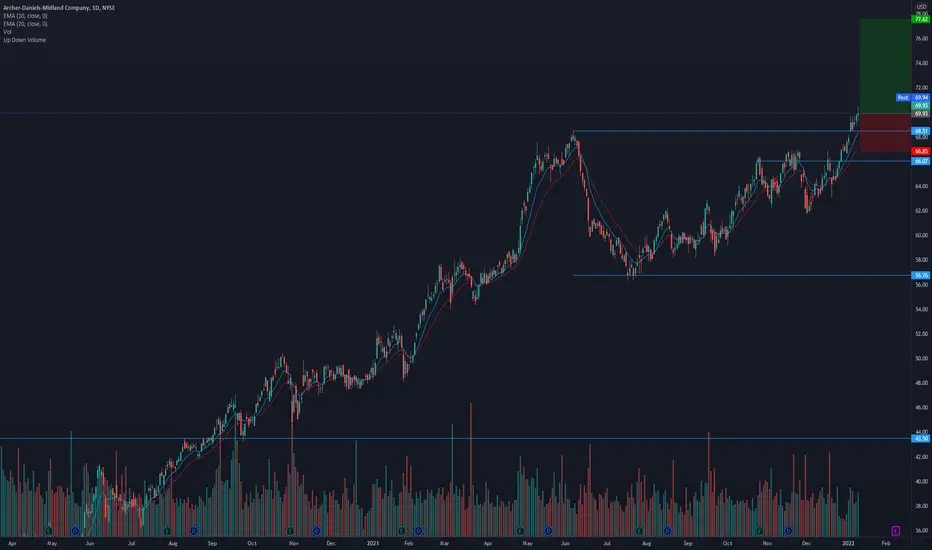
ADM looking to head higher?* Good earnings in the recent quarters
* Good general up trend in the long term
* High 3-month relative strength of 1.04 in the Consumer Defensive sector
* Breaking out of a 7 month base with higher than average volume
* Has a U/D ratio of 1.24 meaning it's under accumulation.
Trade Idea:
* Due to the market conditions I'd suggest you wait for a better entry around $68.51 if you do consider it.
* If you're willing to bare the volatility at the cost of getting into the stock, now's a great time to enter as the price is just breaking out and is only 2.07% away from the broken level.