Polygon Matic testing the last resistance before price discoveryPolygon is in an accumulation phase since the downfall in may 2021.
We are finally back up around previous all time high price ranges.
Bullish news came in that Uniswap is now live on Polygon which is bullish for the whole Ethereum ecosystem.
The RSI shows that we are in the middle of an accumulation phase and therefore its plausible that the final price breakout will occur in 2022 and not yet.
However, in the long run we only see upwards potential for matic.
Currently around 7 billion MATIC tokens out of 10 billion possible are in circulation.
This is ok from an inflation standpoint.
If we go back around the 2$ level this coin looks like a strong buy.
Feel free to comment or ask anything you like.
Always do your own research and keep in mind that my charts and comments cannot be considered financial advice.
Cheers Ctumbler
Accumulation

Bitcoin Summer ReplayDownward accumulation until February then restart bull run in February. Will take a break until then. Adios amigos.

BTC Update !!!! What's next????A lot is going on with BTC at the moment. A common sentiment in the market is not looking great at the moment, and lots of people are starting to believe that we have already entered the bear market.
In my opinion, We are still in the bull cycle. Here is why?
Even though this correction was brutal, it is a very similar correction we have seen in May and September. We are still in the uptrend that started end of 2020 (Thick blue line). The market should be considered bearish if BTC breaks below 39-43k Support zone, which sits on top of the bullish trendline like a wall. Similar to May-June, we can see significant accumulation near the strong support (Green boxes) and 200 MA. The important thing to notice are the Yellow boxes shows the long accumulation during the dip.
Why I'm still bullish?
The current accumulation area (Yellow box) got major bullish confluence indicating a strong bullish signal. We have the strong support of around 39-43k, finding support around Fib 0.786 and bouncing at 200 MA. We have seen twice this year, whenever BTC crosses 200 MA we will see a massive pump follows after accumulation.
What's next?
BTC is currently stuck inside a bullish falling wedge (please zoom in to see the purple falling wedge) and downtrend (thin blue line). It should see a break out for the market to turn GREEN. This could happen if BTC finds support at fib and 200 MA or Correct even further towards 39-43k range to find major support.
Anything is possible until we see some clear confirmation such as -
Bullish - BTC pumps from this confluence area and break out of the falling wedge and downtrend line
Bearish - BTC dumps below 39k (Next major support is around 36k and 32k)
This is not financial advice, please DYOR. Please like and follow to support :)

Weekend Analysis + Market Re-cap This weeks video is me going over 3 potential trades this week
NZDCAD (Short)
AUDCAD (Short)
CADJPY (Long)
I break down exactly what I am looking for right down to the 15min/5min TF's
Hope you all have a great rest of your weekend, Christmas, and have a fantastic 2022
Take care
Ben

Is GBPNZD accumulation ? Wyckoff analysis todayGBPNZD was boken market structure to go upward.
This is quick analysis about GBPNZD today.
Now, i'd like to see price retrace back to "Backup"
Wait to see a confirmation before enter long positions to minimize risk.
Do you like this gold trading idea?
If you find the article useful and interesting, please leave a comment or engage to see more posts !
------------------------------------------
Attention about this Gold analysis
React to price action based on specific trading plans, rather than predictions.
This is my personal idea and analysis, please just see it as an example for reference.
You also need your own judgment, analysis as well as a trading plan to manage risks when trading Forex.
This is a free blog sharing trading ideas.
Z Concepts is a forex and cryptocurrency trading strategy that combines Wyckoff, supply and demand , price action, and some other modern technical analysis .
Happy Trading !

EURUSD building cause for a big moveEURUSD looks like it is setting up to provide some great momentum heading into 2022. The daily and 4h timeframes are still showing bearish market structure forming lower highs and lower lows, however, price has now paused and started moving laterally at a weekly demand zone. This is key. Price action looks to have the classic features of an accumulation or distribution schematic where buyer and seller commitment is being tested at the highs and lows of the range. I see a cause for both a continuation of bearish momentum or for the higher time frame (weekly) to kick in meaning price could become bullish, at least in the short term. Either way, I'll be trading at the range extremes (highs and lows) and waiting for further developments over the coming days as to the longer term price direction. Interesting one to watch...

Bitcoin - possible reaccumulation - Wyckoff at 48-50k zoneWe are dealing with a consolidation at the level of 48-50k. It is possible that we will still reach the level of 46500. If there is a very quick return with the wick, we will go up quickly.

Bitcoin Long trade setup 1 hour chart 10 December 2021BINANCE:BTCUSDT
Bitcoin has been holding the 47k support zone nicely, I think we will stay in this range for a while and I'm planning on opening a long at around 47500 - 47800$ and sell at around 51000$.
ENTRY 47500 - 47800$
SL 46600$
TP 51000$
Risk/Reward ratio 3
2% loss if SL is hit
7% gain if TP is hit

AVAX Long and Short entry zonesBINANCE:AVAXUSDT
Today got back to analyzing some AVAX trade setups. I added the Long and Short entry points that are of my interest. I think we are done with dropping lower for now and will start trading sideways for the rest of the month before making another move upwards.
We could be in for a few boring weeks in the market but this is a good chance to build out your positions for the next move
Upper limit 147$
Lower limit 51$
Accumulation range 77$ - 110$

BTCUSD LIQUIDATED (CHART UPDATE)LOST IT ALL FOR GOOD NOW GOT LIQUIDATED OF MY LAST CAPITAL😌
IF this helps you out pls consider a donation Im sorry I just don't know what to do at this point.
Put the last of it into DENT 0.0058 entry got liquidated at 0.0043 bottomed out at 0.00395 on futures. Didnt anticipate BTC dropping below 46K and now I've got no capital and dont know what to tell my mum.
BTC: 0x03794f2ae7a97f2e308cb0d46fde8d1728e4b694 (BEP20)
159F3K5sZYnAQC4qt929jkkXKfSgNmukbq ( BTC )
ETH: 0x03794f2ae7a97f2e308cb0d46fde8d1728e4b694 (BEP20)
0x03794f2ae7a97f2e308cb0d46fde8d1728e4b694 (ERC20)
LTC: 0x03794f2ae7a97f2e308cb0d46fde8d1728e4b694 (BEP20)
LdH9QfYsPYcjm5hAXfDQrS9Pmmr9QHu8Py (LTC)
USDT: 0x03794f2ae7a97f2e308cb0d46fde8d1728e4b694 (BEP20)
0x03794f2ae7a97f2e308cb0d46fde8d1728e4b694 (ERC20)
TH6nuZUjRakTV7bA25Uk8AVZe5pLSSxMix (TRC20)
bnb136ns6lfw4zs5hg4n85vdthaad7hq5m4gtkgf23 (BEP2) -> MEMO: 106029441
I honestly appreciate all donations. Im really down bad. My first year and lost 90% of my capital. starting balance was $1000. learnt about leverage a month ago and got greedy with it. was going to use litecoin to make it all back but price didnt meet my entry now im stranded. The learning process has been gruesome but I've learnt the hard way. just need to figure out how to tell my mom i lost all her money. Panicking, dont normally do stuff like this but i dont know anyone so i resort to this. THANK YOU IN ADVANCE. Worth a shot.😥

Wait to buy GBPJPY at Quasimodo Level, Wyckoff methodWyckoff Analysis in Forex and optimize entry with QML (Quasimodo)
Potential to buy GBPJPY at Quasimodo Level.
Here's a confluence with Doji decision point.
Wait for confirmation to enter long positions
------------------------------------------
Attention:
React to price action based on specific trading plans, rather than predictions.
This is my personal idea and analysis, please just see it as an example for reference.
You also need your own judgment, analysis as well as a trading plan to manage risks when trading Forex.
This is a free blog sharing trading ideas.
Z Concepts is a forex and cryptocurrency trading strategy that combines Wyckoff, supply and demand , price action, and some other modern technical analysis .
If you find the article useful and interesting, please leave a comment !

Bitcoin - possible falling wedge (update 29 nov idea)We went back to the wedge. Retailers have been capitulated. There is a spike volume which means a strong accumulation. It is difficult to say whether we will continue to consolidate at around 46-50k or whether the purchasing pressure among whales will pull us up quickly.
If the wedge is played, we should quickly return to 63k. Many retailers consider a drop below the 52k uptrend to be the "end of the bull market". In my opinion this is wrong, and it is up to the panicked retailers to buy back the bags.
I have certainly seen two 2-3 day accumulations recently. One at 54k around November 27th and at 49k three days ago. In my opinion, this is a sign of the upcoming further increases.

TRBBTCTRB appears in the accumulation range. In the range of 0.000650 to 0.000750 seems to be suitable for buy. Its targets are available in the specified areas

$EWCZ looks like it's accumulatingEWCZ Euro Wax Center appears to be accumulating after an ER drop (despite beating). Buyers keeping it above $26, I went long commons because I like the R/R and MACD bull cross / momo turning implying a move to the upside , also closed above 8 and 21 EMAs. Stop loss $25.9, first PT $30.

Waiting to long AUDUSD with 2 positionsDoes AUDUSD accumulate ?
Today, i'm waiting to long AUDUSD with 2 positions (EU session)
------------------------------------------
Attention:
React to price action based on specific trading plans, rather than predictions.
This is my personal idea and analysis, please just see it as an example for reference.
You also need your own judgment, analysis as well as a trading plan to manage risks when trading Forex.
This is a free blog sharing trading ideas.
Z Concepts is a forex and cryptocurrency trading strategy that combines Wyckoff, supply and demand , price action, and some other modern technical analysis .
If you find the article useful and interesting, please leave a comment !

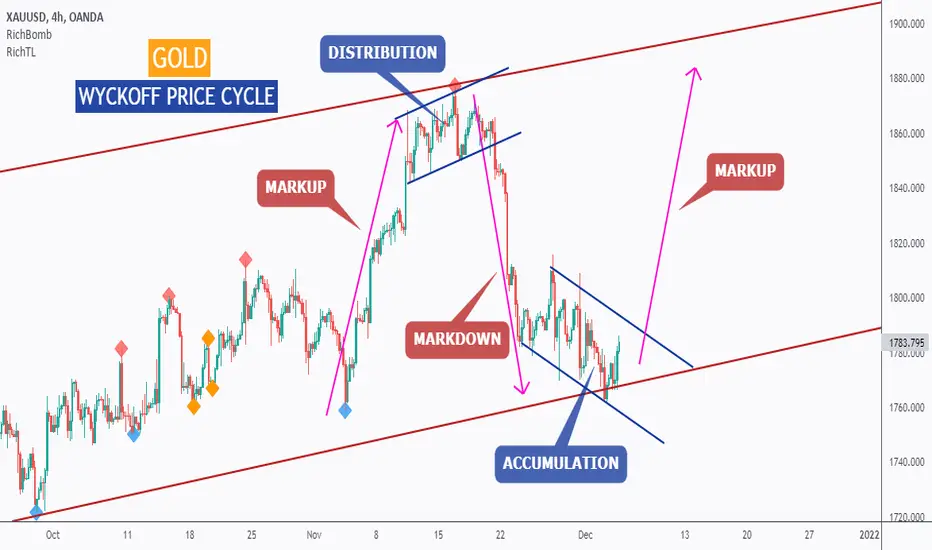
GOLD - Wyckoff Price Cycle!Hello TradingView Family, this is Richard, and if you like this idea, kindly support with a like or a comment.
I found GOLD chart as a great practical example of Wyckoff's Theory.
GOLD is overall bullish trading inside the brown channel and it is currently sitting around the lower bound/brown trendline acting as non-horizontal support.
So we are looking for trend-following buy setups. Unless of course, the bears manage to break below 1750, which would invalidate the idea.
As per Wyckoff Price Cycle, we are currently in an accumulation phase. For the Markup to start, we need the bulls to prove control by breaking the blue channel upward.
As per my trading plan:
I will be waiting for a third swing to form around the upper blue trendline to consider it valid and then buy on its break upward.
OR for a break above the blue trendline, then look for bullish reversal setup on its retest.
Always follow your trading plan regarding entry, risk management, and trade management.
Good luck!
All Strategies Are Good; If Managed Properly!
~Rich
36-38 againWas expecting a rise to 32, and now 38. I do want for sure a break upside 32 to consider 38, obviously. And also since I do expect some more testing that could happen around 31.2, and even back to 29.2, before it moves upward furthermore.
And I do expect a rise to 44 as well on a longer term, but these were my first target zones.
If there would be a break under 29.2, then it would mean 25-26, but for now buying interest has been consistent enough to not go play within that zone.
Weekly
Monthly
Update will be provided as this move through the cycle.

0.15- 0.17 IFLoving how it has been looking and how it does on the long-term.
I do expect a move upside to 0.15 as first target, and even 0.17 eventually. And a break upside 0.135 would be a good sign, that it is on it's way toward these areas.
What I am also waiting for, and would have rather happen then having it moving straight to upward zones, is a retracement to the 0.117 area, where light supply there would be a great place to initiate buys. { happening right now}
If a move back under the 0.97 would happen, I would expect it going back into the accumulation range that did form at the 0.74 floor.
Daily
Weekly
Monthly

LINAUSDT - Accumulation #2 versionPersonal opinion on LINAUSDT chart that looks to be in accumulation , recently markets have moved away from schematic #1 type wyckoff accumulation to the rising gradient #2 version.
First public idea. After 4 years on the sideline want to keep myself more accountable.

Possibility Of An Even Bigger Wyckoff Accumulation In NZD/USD?!After noticing that there may be a Wyckoff Accumulation schematic taking place on the 30 minute chart as seen in my previous post, I have just seen that there could be a possibility of a Daily one forming as well!! We are still very early on in the price action, but if this plays out then it could be huge!
Please feel free to leave a like and let me know what you think about the idea!

Wyckoff Accumulation in NZD/USD, Ready For Big Move Up?!Now, I am very new to Wyckoff, so i could be completely wrong here. But, to me it looks like we could be going through a Wyckoff Accumulation Schematic to gather liquidity before a big move up! As we have forecasted this for the New Zealand Dollar as well, this could add confluence to the possibility of a big move coming!
Please feel free to leave any comments and let me know your thoughts on the idea!

What are Supply and Demand Zones and How to Trade with Them?What are Supply and Demand Zones?
▷ Demand Zone (Accumulation Area):
Accumulation comes from a Latin word meaning to increase something over time.
A strong uptrend can only exist if buyers outnumber sellers. During a trend, price moves up until enough sellers enter the market to absorb the buy orders. The origin of strong bullish trends is called an accumulation or a demand zone. Demand Zone is where traders are willing to buy aggressively because the balance has shifted to the demand side. Here, buyers are dominant and sellers weak.
The demand zone represents a period of implicit buying, typically by institutional buyers, while the price remains fairly stable. This area is characterized by mostly sideways price movement. Before a trend starts, price stays in an demand zone until the “big players” have accumulated their positions and then drive price higher.
This can be contrasted with the Supply Zone, where institutional investors start to sell.
▷ Supply Zone (Distribution Area):
Bearish trends are created when sellers outnumber buy orders. Then, price falls until a new balance is created and buyers become interested again. The origin of a bearish trend wave is called a distribution or a supply zone. At Supply Zone traders are willing to sell aggressively because the balance has shifted to the distribution side. Here, sellers are dominant and buyers are weak.
Support and Resistance Levels vs. Zones
If you have an idea of how to trade with support and resistance zones, you might find supply and demand zones very similar.
You won’t be mistaken; Supply and demand zones are natural support and resistance levels. You’ll often find supply and demand zones just below/above support and resistance levels.
Types of Supply And Demand Patterns
There are two types of patterns: “Reversal” and “Continuation” patterns.
While a pattern is forming, there is no way to tell whether the trend will continue or reverse. As such, careful attention should be paid to whether the price breaks above or below the zone.
▷ Continuation Patterns
If price continues on its trend, the pattern is known as a continuation pattern.
We have two continuation patterns: “Rally-Base_Rally” and “Drop-Base-Drop”
▷ Reversal Patterns
When price reverses after a pause, the pattern is known as a reversal pattern. The established trend will pause and then head in a new direction as new energy emerges from the other side (bull or bear).
Reversals that occur at market tops are known as distribution patterns. Conversely, reversals that occur at market bottoms are known as accumulation patterns.
We have two reversal patterns: “Rally-Base_Drop” and “Drop-Base-Rally”
How to Find Supply and Demand Zones?
On a price chart, the demand zone is characterized by sideways price movement on above-average volume. When a stock price doesn't fall below a certain price level, and moves in a sideways range for an extended period, this can be an indication to investors that the stock is being accumulated by investors and as a result, will be moving up soon.
The demand and supply zones are encompassing the base on the beginning of the move. The most important thing is to first finding a sharp move in either direction, after which you can identify its starting point and roughly define the supply or demand zone:
• Look at the chart and try to spot successive large candles.
• Find the base from which price started the quick move. Usually, before that you have a small sideways move, that is where your supply / demand zone is.
• Draw the zone
It is very hard to be precise with those levels and here it is more of an art than science. To make it easier to identify these levels, you can use another tool for confirmation.
How to Trade with Them?
One way to trade with supply and demand areas is reversal trading. After identifying a previous strong market reversal, wait for the price to return to that area. If a false breakout occurs, the chance of seeing a successful reversal is extremely high.
Some candlestick patterns such as "Engulfing", "Pin Bar" and "Tweezer Blades" can help you identify trend reversals.
Be careful, trading in the opposite direction of the trend is very risky. Technical analysts typically recommend assuming a trend will continue until it is confirmed that it has reversed. Trend reversal trading can be a profitable way to trade the markets. However, like any other trading strategy, there is a correct and a wrong way to do it.
Pros and Cons
Being able to recognize whether an asset is in the demand zone or the supply zone is helpful to investing success. Demand Zone is the origin of a big rally in price. Identifying this area could help investors spot good entry points into an investment before its price begins to rise.
Once the price leaves an demand zone, not all buyers got a fill and open interest still exists at that level. Supply and demand traders can use this knowledge to identify high probability price reaction zones.
As with anything else, supply and demand zones have their cons, as well. Understanding chart movements such as those seen in the accumulation area can work well during times of relative stability. Still, prudent investors know to pay attention to larger economic events that can quickly reconfigure charts (like the covid-19 epidemic)
Key Points
• Accumulation / Re-accumulation zones can becomes distribution/Re-distribution zones over a period in the Stock Market
• The narrower a supply/demand zone before a strong breakout is, the better the chances for a good reaction the next time typically.
• Good supply and demand zones are quite narrow and do not hold too long, which shows strong imbalance between buyers and sellers.
• The stronger the breakout, the better the demand zone and the more open interest will usually still exist.
• Always look for extremely strong turning points. They are often high probability price levels.
• Each time the price re-tests a supply/demand zone, more and more previously unfilled orders are filled and the level is continually weakened.
Conclusions
Supply and Demand Zones are a great way to identify areas of buying and selling as well as support and resistance, but they work best when combined with other kinds of technical analysis.

Market phases explained through ACS' graphA few days ago, I identified the different market phases through this company's graph: uptrend, distribution and downtrend, which could imply that the market is right now within the accumulation phase.
This phase is characterized by the price of these shares being lateral and, when this phase ends, a new trend will begin. Therefore, I consider that keeping an eye on this company can be interesting in order to identify the brand new trend as it starts, so that we can open positions in favour of it.
If we have a closer look at the last candles that have been drawn in this graph, we can appreciate that the price of these shares has recently tried to break the accumulation range downwards. Nevertheless, buyers have been strong enough as to not let sellers to. The uncertainty surrounding the price's future direction is still there, so we will keep on waiting until we observe a clear brekout.
