Rites BO after accumulationThe stock is showing a breakout (Bo) after accumulating at support levels.
This presents a favorable risk-reward ratio (R:R) for trading, especially with a small stop loss (SL).
Volumes are also shooting 'up.
It's worth noting that there’s a trendline that has been respected for a long time.
Breakout should be with a strong candle (TF as we used in chart); then the entry will be after the consecutive candle which should be breaching the breakout candle.
Do your own research before investing
Accumulation

SOLANA // target reached, what now?The market has come all the way down to the weekly breakout and the correction fibo 78.6 with an impulse.
After such a fast impulse bumps into a strong support, chances are high that some kind of a correction of the impulse will come.
It doesn't mean, it turns from here, and goes to new highs, though!
The daily countertrend breaks above the daily impulse base (higher green level), but the countertrend line breaks at the daily breakdown (lower green level). Above that, if the waves support, the bull trend resumes.
Below the long trigger zone, every move up is only the correction of the correction, therefore, quite risky.
There is space to take the long side from here, though, so It may be a good opportunity for a good day trader. I'd definitely wait for H4/H1 to turn waves long.
The price may go to the weekly impulse base, but I would wait with the short until the market is trading below the weekly breakout. The reason is that at this phase, accumulation may kick in, with sudden ups and downs on the market.
What's is your opinion about this market? Fell free to share it!
———
We may not know what will happen, but we can prepare ourselves to respond effectively to whatever unfolds.
Stay grounded, stay present. 🏄🏼♂️
Your comments and support are appreciated! 👊🏼

BTCUSD Wyckoff Accumulation Phase completedLets assume that the strength in the US dollar wont last for too much longer, as Central Banks try and work out how many more trillions are needed in the system.
The BTCUSD had been in a trading range for some time and this week we convincingly left it, with a big dose of Bullish price action.
Will it last? IDK. I am long BTCUSD so I am fundamentally in the Bitcoin 🚀 camp so I am also talking up my own book.
However, if we look to Wyckoff and transpose his teachings on the stages of the accumulation phase, we get quite a convincing outlook to the upside.
It could all be down to the fact that we see what we want to see, or it could be a run on the banks to the crypto-sphere.

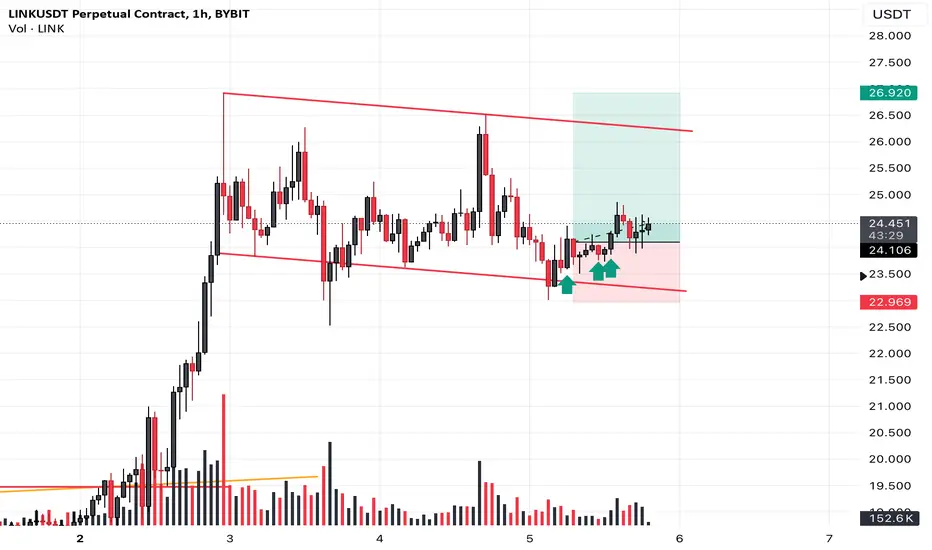
link-- long call
I see overall volume decrease, in addition to that the sellers has a diminished downward result--- a suggestion for seller absorption in the background. i want to see the price behavior around the resistance area.
Gold? Nothing much lately.That's what made me check. Bulls
I don't follow the news much these days, but the safe haven thingy is not going away, Middle-east, Russia, North Korea, it seems to be the cool thing for a leader to do is start a war.
Enter the Gold-price & its safe haven attributes.
I had written Gold off the last few days, doing its daily up and down liquidity checks and price not moving much on Friday.
You will see in the chart on the 30m that gold recently parted ways from a wedge pattern, price moved aggressively south for about 100% move of the width of the wedge, then it moved aggressively north and stopped well north of its exit from the wedge and then made a perfect 38.2% retracement.
So what happened next. Well price has accumulated around this level and price is beautifully above VWAP and the 200ema.
All 3 charts have confluence setups for bulls.
But here is what I don't like. One moment.

WIF/USDT - ACCUMULATION PHASEWIF is in accumulation phase since 18 Nov ,
If WIF broke the accumulation zone then it will go for new higher highs.
We will enter at breakout of 3.655

BTC/USD: Ready to Break the Channel and Soar to 100K Bitcoin (BTC) has been trading within a well-defined descending channel for the past few weeks, showing signs of consolidation. However, several key indicators suggest that BTC is preparing for a breakout, potentially leading to a significant rally that could push the price toward the highly anticipated $100,000 level.
Bitcoin is on the verge of a significant breakout. All signs point to the beginning of a new bullish cycle, with a realistic path toward $100,000. Traders should watch closely for a decisive move above the channel, as this could mark the start of the next major leg up in BTC's journey.
Risk Management: As always, set appropriate stop losses and manage risk carefully. Volatility is inherent in crypto markets, and while the outlook is bullish, it’s essential to stay disciplined.
DISCLAIMER:
This post does not provide financial advice. It is for educational purposes only! You can use the information from the post to make your own trading plan for the market. But you must do your own research and use it as the priority. Trading is risky, and it is not suitable for everyone. Only you can be responsible for your trading

SNPS Breakout Potential to the UpsideNASDAQ:SNPS has been range-bound since 2023 and is finally showing technical patterns that reveal Dark Pool hidden accumulation, pro trader nudges, and the potential for HFTs to gap and run the stock upward.
This stock is setting up to challenge the all-time high. Often in the current Moderately Up-trending Market Condition, HFTs will gap the stock over the resistance level.
So keep the stock on a watchlist to look for pro trader nudges or resting-day candles that indicate the pros are attempting to trigger HFTs to gap the stock up. IF the HFTs gap the stock, then pro traders will take profits immediately, selling into the foray of retail traders chasing the gap. The goal is to enter before a potential gap. The stock may not gap. However, the pattern is indicative of more HFT activity.

Dark Pool Accumulation Patterns Ahead of EarningsNASDAQ:LULU is working on completion of its long-term bottom. It has good PSHI and has been trending up for a while. The company reports this week. It may gap on earnings news. The steady but slower-paced improvement in price is indicative of Dark Pool accumulation.

HIPPO/USDT - WILL IT GO FOR NEW HIGHER HIGHS ?HIPPIO is in accumulation phase, If HIPPO broke the accumulation zone then it will go for new higher highs

Bitcoin: $300k by 2025Long-term Bitcoin analysis using a logarithmic scale. As shown, Bitcoin remains in the long term trend lines set by the top and bottom of the 2014 bear market, if Bitcoin is to remain in these trend lines, it needs to start making an upwards move in early 2019. I have also drawn a few curves that Bitcoin could follow if it is to fall below the trend line.
My first price target is $100k which I expect to be met between mid 2020 and mid 2021. I then anticipate another 12-16 month bear market before finally resuming the bull market and heading towards $300k between 2025 and 2026; I have chosen $300k as that would put Bitcoin on a slightly smaller market cap than gold assuming that 20 million coins had been mined ($6 trillion).
Finally, I have indicated accumulation zones in green, currently between $5.7k and $7k, I expect to move out of this range within the coming few months. Then similarly in the 2022/2023 bear market I expect Bitcoin to fall 60-70% and accumulate between $30k and $40k range.

MANTA 400% Gain IncomingOMXHEX:MANTA - Technical Analysis Request
Three distributions shown. The current range is likely an accumulation before a breakout.
The value are lows shown of the previous ranges will be the most important resistance zones.
From current price 400% possibility to ATH #MantaNetwork
Lows of the range has been swept. Next challenge is to break the trendline and continue upwards.
Calculate Your Risk/Reward so you don't lose more than 1% of your account per trade.
Every day the charts provide new information. You have to adjust or get REKT.
Love it or hate it, hit that thumbs up and share your thoughts below!
This is not financial advice. This is for educational purposes only.

Bitcoin: 2024-2025 Will Be Bullish!!!We are observing Bitcoin here on a much bigger time scale and also from different perspectives.
We all know about four corners of the market or Wall St. Cheat Sheet Psychology of a Market Cycle. But here we have combined all the knowledge, and we see a beautiful view.
As you are all aware, each halving has begun with a nice bullish market, followed by a bearish market cycle, a nice accumulation, expansion, and then another reaccumulation.
With that being said, we are still 4 months away (around 127 days) from the next halving, and recently we witnessed a nice expansion phase that resulted in a ROI of 175%. This is more than enough for the expansion, which means we are going to enter very soon into the reaccumulation phase.
But be careful; this time more people might get greedy and have a FOMO due to the huge exposure to crypto and bitcoin we have had for the last year.

Bullish on BTC. Price Action suggesting upside. No explanation needed.
Simple ICT concepts in play.
Follow for more.
This idea is mine and it is not a financial advice.
It is a mere speculation educational post from me.
DYOR.

EUR/USD: PAT + VPA 10/02/2024Good afternoon,
Today, my focus will be on identifying long entries for a long position, as we appear to have reached a selling climax.
On the 15-minute time frame, a robust demand zone is evident between 1.0300 and 1.0400. The market has made a significant move towards 1.0300, leaving indications of early buying activity from "Market Makers." A notable reversal occurred on October 1st, followed by the formation of a bullish wedge (which is typically a bearish pattern) that pushed the market below the previous low. Currently, we are beginning to form a triangle on the 15-minute chart, which serves as a critical signal for a potential market reversal, particularly since it has not managed to fill the liquidity above it. This downward movement seems designed to eliminate the remaining sellers and early buyers. Additionally, my strategy, "High Clear," has materialized, suggesting that a liquidity sweep of the recent low was anticipated.
I am now monitoring the fourth leg of the triangle as it approaches the lower congestion line, preparing for a potential breakout with the fifth leg. It is important to note that if a sixth leg forms, it would indicate a continuation of the market trend.
I suspect that the market is attempting to prompt traders to shift to short positions, setting the stage for one final significant rally towards 1.1300. I anticipate that the market could reach this level in the coming weeks, unless we observe the formation of a six-legged triangle.
The Pip Assassin
FX:EURUSD TVC:DXY XETR:DAX

RNDR Long Position (Accumulation Phase)Market Context: RNDR has been through an extended markdown phase, with market makers taking profits, driving prices down to fair value. Now, the market appears to be in an accumulation phase, where most of the weak hands have exited. This creates an opportunity for strategic entry, positioning for the next bullish move.
Trade Setup:
Entry: $4.70 - $5.30
Take Profit:
First target: $6.30
Second target: $7.50
Third target: $9.00
Stop Loss: Daily close below $4.50
This trade aims to capitalize on the potential accumulation phase as RNDR prepares for a possible move higher. #RNDR #Crypto #Accumulation #PriceAction #Trading

Stonks go Up..Here's an Aggressive One. buy (risk capital) at 1 cent or 2, Wait for the Triple!!!
-Earnings on Aug. 20th.
-Net Income accelerating.
-Have reduced their debt to Virtually zil.
(Positive revenue. picking-up.)
.43 Quick Ratio
-Not a done Deal, though, company still needs to deliver
-good risk/reward ratio for a 'small' amount of Risk capital.

ENSV very quiet...Consolidating leads to expansion!
I'll keep DCA up when I get some other good wins.
I dont believe we have see the bottom and the previous high is to be taken out. I do not believe that the ATH will get taken out nor will we double top.
I can see Oil to retrace down to $30-45 on my crystal ball. The current administration will continue to gut the strategic Reserves here in America and will cease to give any grants or funding to the oil industry. They are going to push their stupid ass green agenda and cause so many people in corporations to go near bankrupt. It'll end up almost being like a horror movie for many people but if this company survives it should thrive. Also after oil hits around 30 to $40 I think that we could see 160 on the table per barrel.
NOTHING I SAY IS FINANCIAL ADVICE CAN GO TO ZERO I WAS JUST A DUMB ROUGHNECK AND MWD IN THE INDUSTRY AND MY GRANDFATHER HAD AN OIL COMPANY AND MY PARENTS WERE ENGINEERS...

Really as Simple as it seems- Very simple case for NG bulls on a long (2-5 year) basis. Macro trend simplified with nothing more than trendlines
- Shorter term bear play will be described in another post
- NG appears to be making a Jesse Livermore accumulation megaphone pattern as it did in the 90s/2000s
1) red long term downtrend line broken to the upside and retested beautifully.
2) weekly chart shows higher highs and higher lows beginning to develop on a longer time frame after the nasty drop from 2021 highs to lows which bottomed in the 2$ vicinity.
3) Shorter term black trendline still providing resistance upon the 3rd test. Confirmation of a breakout here is yet to be seen (this was where the short play revolves around)
4) major resistance around the upper red horizontal line at roughly 3.19. Lesser resistance just below red horizontal line.
Conclusion: NG has been and continues to be extremely cheap historically.
As NG resolves these resistance zones it appears a 1-2-3-4-5-6-7-8 megaphone pattern will generate as NG eventually reaches the 12-14$ area within the next few years.
Natural Gas expected to tag lower trendline and upper trendline of megaphone pattern accordingly with seasonality and resistance levels along the way.
Volatility is expected as the cylinder widens and price action becomes more erratic, though long term, the trend is bullish, but the Widowmaker is not for the faint of heart. Scaling in, and buying near lower trendline tags is likely most likely to increase probability of maximum profit.

Hamster Combat (HMSTR) Analysis: Acc, Dist & Whale Activity
💡 Overview :
Hamster Combat BITGET:HMSTRUSDT.P is currently presenting some strong opportunities for both accumulation and distribution . Based on key technical indicators and on-chain analysis, we have identified significant support zones for buying, as well as resistance levels for taking profits.
---
Price and Market Dynamics:
📊 Current Price Levels : HMSTR has recently traded between $0.0045 and $0.0065 , showing that the market is cycling between accumulation (buying) and distribution (selling).
- Accumulation Zone : This is where buyers are entering the market, typically in the price range of $0.0045 - $0.0055 . This zone is a support level , meaning the price tends to bounce off these levels because there is high buying demand.
- Distribution Zone : This is where sellers (including large holders or whales) are exiting their positions, pushing the price down. For HMSTR, this zone lies at $0.0060 and above . This is a resistance level , meaning that as the price rises, it tends to hit this ceiling and fall back down due to increased selling pressure.
---
📈 Accumulation Strategy:
- When to Buy : Accumulate HMSTR in the range of $0.0045 to $0.0055 , where it's supported by buy orders and the market sees it as undervalued.
- Why this matters : This is a low-risk entry point because the downside is limited by the strong support here.
- How to do it : Place buy orders in the accumulation zone and plan to hold through the coming upward move.
---
### 📉 Distribution Strategy:
- When to Sell : The distribution zone lies at **$0.0065 and above**, where whales start to exit their positions. If you're holding, this is an ideal zone to take profits .
- Why this matters : Selling in this zone locks in profits before the price faces resistance and selling pressure pushes it back down.
- How to do it : Sell a portion of your holdings as the price approaches $0.0065 - $0.0070 , where we see heavy whale activity.
---
### 🐋 Whale Activity:
- Whales (large holders) have been accumulating between $0.0050 and $0.0060 , signaling their belief in the asset's long-term value. When whales accumulate, it typically means they expect the price to rise.
- However, whale outflows are being observed near $0.0070 , meaning these large holders are taking profits here. This creates strong resistance at that level.
---
⚙️ Key Technical Indicators:
1. MVRV Ratio (Market Value to Realized Value) :
- Low MVRV signals that HMSTR is undervalued , a prime accumulation opportunity.
- Action : Buy when MVRV is low for long-term growth.
2. NVT Ratio (Network Value to Transaction Volume) :
- A declining NVT means the network is growing faster than the transaction volume, often signaling a bullish market.
- Action : Look for long positions as network strength increases.
---
📊 Take Profit and Stop Loss Levels:
- Take Profit :
- Short-Term : Sell at $0.0065 (previous resistance).
- Medium-Term : Sell more at $0.0070 (whale exit point).
- Stop Loss :
- Conservative traders should place a stop loss at $0.0047 .
- Aggressive traders can place it at $0.0050 for tighter risk control.
---
Derivatives and Open Interest Analysis 📈:
- Open Interest is rising, indicating that more traders are entering the market, particularly in the derivatives space .
- Positive funding rates further suggest that long positions are dominating .
- Action : Expect potential price volatility due to this interest; ensure you're managing risk with stop losses and setting take profits at key resistance zones.
---
Mini Report:
Hamster Combat (HMSTR) is showing clear accumulation and distribution patterns based on whale activity and technical indicators. Accumulation is ideal between $0.0045 and $0.0055 , where whales and long-term holders are buying in. The distribution zone begins around $0.0065 , with selling pressure intensifying near $0.0070 due to whale outflows.
Key technical indicators, such as the MVRV Ratio (signaling undervaluation) and the NVT Ratio (reflecting network growth), support a bullish outlook in the short term. However, risk management is essential, with stop losses recommended at $0.0047 for conservative traders.
Actions Explained: :
- 📉 Accumulation (Buying) : This is when you want to enter at lower prices, like the $0.0045 to $0.0055 range, because the market sees value here. The price is supported, and there's more buying pressure.
- 📈 Distribution (Selling) : Here’s where you take profits as the price hits $0.0065 - $0.0070 because whales are selling, creating resistance.
- 🐋 Whale Activity : Whales are big players who can move markets. When they accumulate, it’s a bullish signal, but when they sell at $0.0070 , it creates resistance .
- 💰 Take Profits and 🛑 Stop Losses : Set take profits at key resistance points to lock in gains and use stop losses to protect yourself from market drops.
---
This detailed plan, backed by on-chain data and whale activity, offers a roadmap for navigating the HMSTR market. 📊 Follow the price zones and manage your risk , and you'll be set up for a successful trade... TradeGod_1111...

XRP/USDT: A SLEEPING GIANT! 5-6X PROFIT POTENTIAL!!Hey everyone!
If you're enjoying this analysis, a thumbs up and follow would be greatly appreciated!
XRP looks very promising right now, breaking out from a weekly symmetrical triangle. Historically, similar breakouts have yielded returns of 6-7x, and I’m anticipating a similar outcome this time.
After being contained within this triangle for the last four years, this breakout could signal a significant upward movement. I recommend accumulating during dips.
Entry Range: $0.56 - $0.66
Short Term Target: $1.50 / $2.80
Mid Term Target: 4x - 5x
Long Term Target: 8x - 10x
Stop Loss: Weekly close below $0.50
What are your thoughts on XRP's current price action? Do you see a bullish pattern? Share your analysis in the comments below!

SHIB/USDT Secondary trend. Channel. 14 months accumulation.Logarithm. Time frame 1 week for clarity of the channel range. 3 weeks ago, there was an exit of the price under the support of the accumulation channel by a large percentage. Many long positions were liquidated.
The chart shows the percentages from this reversal zone to the channel resistance, as well as the average profit percentage when exiting this accumulation channel from the average set price to the significant first resistance.
This is what the chart of this cryptocurrency looks like on a line chart without the “market noise” volatility.
Accumulation Zone. Pump/Dump and compliance with risk and money management.
Remember, this is a pamp/dump meme cryptocurrency, which even at -93% down from peak pumping and with a set zone of about 14 months (!) is at an inadequate profit. That's why follow risk management in your work.
It is more rational to work on such cryptocurrencies, not with stops (high volatility, slippage at high %, high probability of beaten out before price increase, the large value of stop is meaningless, they can beat out at -2% and -40%), and work from average buy/sell price (only spot!) with reasonable observance of money management.
