Hidden Accumulation At 60kHi all,
Bitcoin rejected from 67k, 1k shy from my previous target. TOTT kicked me out at 63152.65 as i tweeted in real time. Nice catch so far, but i should have taken profits earlier before TOTT, next time i'll do that.
As per technicals, 8 hours in to the weekly close, Bitcoin is trading right below the weekly open at 61532.17 forming a doji candle. This looks bearish and suggests more downside, however we have an accumulation type structure above 60k that suggests the opposite!
If we break above 61.530, our next target will be 69-70k and we may get another reaction there where i'll be looking to take profits!
To the downside, 60k is holding as an important level where the point of control is. If it breaks below 60k, our next target will be 56.550 per the weekly 0.382 fib levels.
I'm back in 30% at 60k based on this accumulation type structure. The rest will be TOTT's call.
As always, trade safe!
Accumulation

lina btc pair analysisLIna is in accumulation phase for long time
It can show huge pump any time so its better to put some money into it .
Else its your choice.👨🏻💻

fuel for 64k? and 66k if
A break upside 63k would be a good sign that we are moving toward the zone, but it might retrace before. Since it is still into a cycle getting formed, and I am still waiting for a LPS to happen, for making this cycle even more legit. As I would expect this LPS to form around 61k, and a light supply a the touch of the area would be a good beginning place to add buying positions, beside having it leaving the actual range being a even better opportunity.
4hours
Daily
will be updated as price moves.

Gold Possible Wyckoff Re-DistributionHi Traders,
Above I have done a video showing my thoughts around gold and a possible opportunity that lies within.
Please let me know your thoughts in the comment section below as well as check out further below for more details.
Have a great weekend.
TH from RT-Trading.

DASH/USDT looking fine as aged wine!Dash has been consolidation for over 3 years. Clear accumulation happening. I grabbed some before the rocket takes off.

USDCAD Long trade TP smashed This is a trade I took today with usdcad i decided to re mark the charts showing my thought process and analysis i used to take the trade

Tesla broke resistance and printing Sign of StrengthConfirming my long position here and waiting for a backup before I add more to my Tesla positions.
As expected price broke out of the resistance channel defined by the AR and the HH points printing SOS and LPS /BU in Phase D before the final markup in Phase E. Low volume and climbing price show that the institutions have taken hold of the price and are not selling until a much bigger markup. Good times ahead of Tesla stocks.
No financial advice, just my reading on the chart through the Wyckoff (re-)accumulation lens.


TOMOUSDTTOMO USDT in bullish in 4 hour time frame we can see the golden cross over.tomo will break the supply zone.the accumulation period is over i think.(educational purposes only)

End of correction nearing for REC silicon? Support approaching for REC silicon. Identified support area around 10 NOK could see rec going for primary wave 3 to potential targets of possibly 70 NOK in this coming bullrun, if not higher.

short term shake out A break upside 63k, the lower part of range cycle, has still to happen to consider we are in fact moving upward leaving our TR.
A couple of LPS did happen, at our awaited zone of 61k and some more at 61.8k, followed by a shakeout to the downside testing the 61.5k area again, that was short lived, and totally normal, and telling us that price and ready to leave the trading range quite yet. The supply from this shakeout got all absorbed at our 61.5k area, pushing the price backup telling us that buyers are still present and serious, just a bit more slow.
Unless we going back under 57k-58k on heavy supply. I will keep having a buying bias and that we are going at least back o 64k-66k
Beautiful accumulation characteristic on the 1 hour overall
Idea of the 17th
''A break upside 63k would be a good sign that we are moving toward the zone, but it might retrace before. Since it is still into a cycle getting formed, and I am still waiting for a LPS to happen, for making this cycle even more legit. As I would expect this LPS to form around 61k.'' =

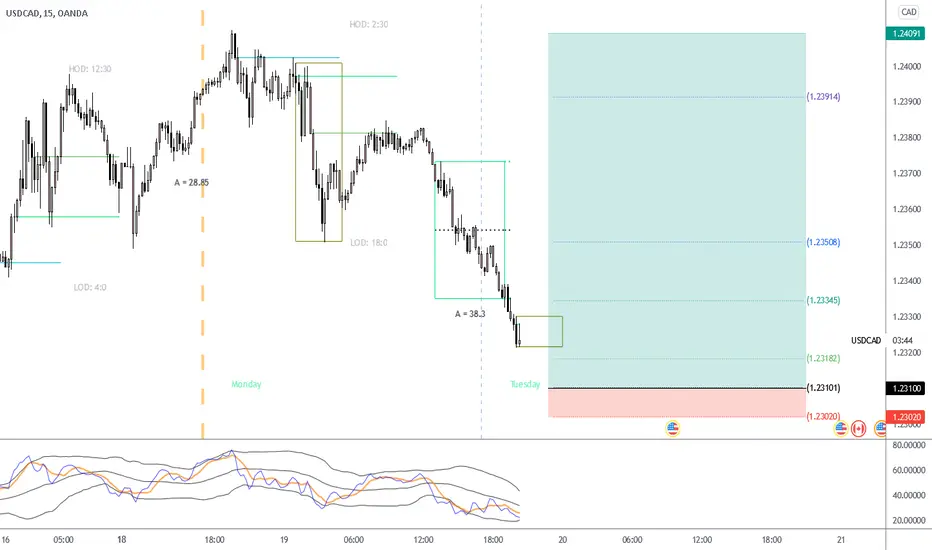
USDCAD - Looking for support at the .23100 LevelUSDCAD
BUY LIMIT @ 1.23100
Stop Loss: 1.23020 (Add Spread)
TP 1 (1R): 1.23186 (Scalp TP / SL→BE)
TP 2 (3R): 1.23356
TP 3 (5R): 1.23526
TP 4 (10R): 1.23950
Reason: Price showed strong resistance in this area in its last testing action to the left. I would like to see price react, and I will be waiting for a Break of Structure or a Wyckoff Accumulation Schematic for my entry. Alternatively, set the limit and cross your fingers 😅😅 Are you guys looking at the same thing??
BCDUSD - UPDATE BCD was one of our previous spot holdings which we took profits at 850% !
Now is time for a update as things are starting to look interesting again. the market since making a large correction has found support at the 0.786 fib and once again started to make a new sideways re accumulation, inside the sideways channel we can see the market is possibly forming this double bottom formation, waiting for a confirmed higher high above the sideways movement for a possible entry to long

GBP/CHF Accumulation Schematics!Hello my beauties.
I think GBP/CHF is on its way to complete an accumulation, which will lead the prices up strongly. I would buy on a successful retest of the trading range in red, after it has been breached.
If you find this idea to be helpful like, follow, and drop a comment below if you'd want me to analyse a different pair.
Consider supporting me if you think I am providing you with value.
Peace.
Luca, TrickleDownFX

CORN ACCUMULATION AFTER DISTRIBUTION!Hello my beauties.
I think the price of Corn is on its way to complete an accumulation phase. If the price breaches above the red trading range and successfully retests, I will enter a long position before the markup.
If you find this idea to be helpful like, follow, and drop a comment below if you'd want me to analyse a different pair.
Consider supporting me if you think I am providing you with value.
Peace.
Luca, TrickleDownFX

BTC DISTRIBUTION ACCUMULATION! Previous analysis was right.Hello my beauties.
I'm going to put my previous analysis in description, where I suggested a buy signal around 40k. What I would like to say is that it really isn't a good idea to go short on BTC at the moment, and that given the momentum it will most probably create a new ATH (all time high). I want to add that the price seems to be stopping around the previously defined trading ranges (red horizontal lines) and getting reactions from them, like stop hunting or sudden inversions to create liquidity.
If you find this idea to be helpful like, follow, and drop a comment below if you'd want me to analyse a different pair.
Consider supporting me if you think I am providing you with value.
Peace.
Luca, TrickleDownFX

BTC Wyckoff Accumulation Schematic #1 study 27/7/21A study of Wyckoff Accumulation Schematic #1 and comparison to previous distribution.
It is possible that we have entered Phase D of a Wyckoff accumulation - an upthrust following a successful test of the spring from 28.7k (confirmed higher low on lower volume). We may now look for signs of an LPS/BU.
The current move from the test somewhat mirrors 14th - 18th April from the ATH. There have been 3 tests of the RSI extremes on both the accumulation, and looking at the RSI, this is the first time we've managed to reach overbought levels since hanging to the lows. There has been a high level of liquidations during this move upwards, similar to the move down from ATH - this is a sign of strength.
Time duration from PSY to mark down has been overlaid onto the current accumulation for comparison, and as a general target for what would be healthy following an ATH. Not to say that an immediate break up wouldn't be great, however the longer we stay in accumulation, the higher the probability of a larger move to follow.
What we would like to see (and/or):
DXY to breakdown from current local top, or two stay sideways without printing a higher high.
A break up of 40k to test the AR and potentially work on an SOS.
A range between 37.5 - 40k, with the lower bound holding as support and gaining strength for a push to the AR (likely good for alts).
A bounce from 35 - 35.5k to confirm an LPS.
RSI to hold and trend above 50.
Volume to keep increasing.
What we don't want to see:
DXY to break up and make a higher high (from the current area, it would represent a structural change to direction and continuation of it's run).
A breakdown from the 35 - 35.5k area. This would be a sign of weakness and builds towards invalidation of the schematic - caution should be used.
RSI lower than 50 or reaching back to oversold would not be ideal.
On-chain metrics still relatively bullish, with ongoing negative funding rates and BTC currently leaving exchanges. Fear/greed index also seems to be bouncing of it's lows.

GBPUSD BULLISH CONTINUATION 15/10/2021Get ready for the long term bullish GBPUSD using Wickoff methodology accumulation phase analysis, GBPUSD in the middle of phase D accumulation..

My JB MA CHANNEL INDICATORWe all know that moving averages, in particular, moving averages of closing prices tend to be highly inaccurate indicators and frequently miss major tops and bottoms. In backtesting, they tend to be accurate some 30 to 40% of the time which is to my way of thinking unacceptable. On the contrary moving averages of opens versus closes for highs versus lows, when used properly avoid the drawbacks of closing moving averages, particularly when combined with a trigger. Shown above is my moving average channel method which uses the 57 SMA of Williams accumulation distribution as a setup or trigger. As shown by the arrows two consecutive price bars completely below the MA channel low and triggered by Williams below SMA constitutes a sell signal. Conversely, two consecutive price bars or more above the moving average channel high accompanied by Williams above its moving average constitutes a sell trigger. The moving average channel high, the red line is a 10 period Moving average of highs. The Moving average channel low, the green line is an 8 period Moving average of the low. There are at least a dozen applications of this methodology including its ability to spot trend changes, support, resistance, swing trades, market strength, market weakness, and more. I will post some of these additional uses of the moving average channel as they present themselves. Do note that in this chart there were two instances above the moving average channel high but these were not triggered by Williams AD and therefore the trend remains down for the duration of this chart. The methodology associated with my MAC is completely rules-based and works in any timeframe. Thank you my friend Larry Williams for developing your excellent version of accumulation distribution. Thank you Dan Wall here on TV for your brilliant coding of my work.
Jake Bernstein (RBT rules-based trader)
www.jakebernstein.com
PS to see the MAC in a bull market take a look at a daily chart of Netflix (NFLX)

Attempting a accumulation wyckoff schematicFirst of many to come, i have attempted to analyse a chart using a wyckoff strategy. Any feedback appreciated.


H4/BAT Long Accumulation from $0.50H4/BAT Update: Slowly marking lower, 06:00 UTC, 12/10/2021
Still a long way off from $0.50 w/ 3x $0.05 cent price levels from it
Price crossing under the 200 EMA, along a freshly-created DTL
Buy orders hanging at $0.75 & $0.50 for an accumulation

Accumulating, slowlyI do expect it going back to 3., but a break on strong signs of maintained demand upside the 2.40 area would need to happen first.
And considering how selling interest has been showing an importance presence, I expect it to tap it 2.0 more times before it happens having it decreasing further more. Consolidate still to the right more accumulating.
Daily
And if you dissect it as a term of cycle, there's still place for a spring to happen. Which is a move under the TR that give a testing of buying interest at lower zone.
Weekly
Buying interest has been showing presence at the 2.0 area when price did test it on the 6 September & 20 September weekly close. As well as on the 27th and this time with less selling getting absorbed, but not a enough strong buying presence to make it break upside 2.40.
Supply has been decreasing week by week, but again, there's more absorption of it needed, or demand presence needing to manifest.
Going to put it as a sell as signal, because I don't expecting it to go up yet. And I can't have a serious buying bias till it has a change of character and major SOS breaking 2.40 happening. But on the longer term, I am on a buy bias. What I see it that we are into a accumulation cycle, that is still unfolding.
And it will all be updated as price move furthermore.
