IOTA - Two Year Accumulation; SOS and LPSAssuming the massive support BINANCE:IOTABTC 2200-2400 sat holds
Accumulation

BITCOIN LONG - ACCUMULATION PATTERNS Serious bearish sentiment in the air... TIME TO BUY!!! lol. (No joke) and this may be welcomed news - (this is not an echo chamber)
This to me looks very close to Wyckoff Accumulation... NOT a Bear market lol.
History:
Richard Demille Wyckoff (1873–1934) was an early 20th-century pioneer in the technical approach to studying the stock market. He is considered one of the five “titans” of technical analysis, along with Dow, Gann, Elliott and Merrill. At age 15, he took a job as a stock runner for a New York brokerage. Afterwards, while still in his 20s, he became the head of his own firm. He also founded and, for nearly two decades wrote, and edited The Magazine of Wall Street, which, at one point, had more than 200,000 subscribers. Wyckoff was an avid student of the markets, as well as an active tape reader and trader. He observed the market activities and campaigns of the legendary stock operators of his time, including JP Morgan and Jesse Livermore. From his observations and interviews with those big-time traders, Wyckoff codified the best practices of Livermore and others into laws, principles and techniques of trading methodology, money management and mental discipline.
From his position, Mr. Wyckoff observed numerous retail investors being repeatedly fleeced. Consequently, he dedicated himself to instructing the public about “the real rules of the game” as played by the large interests, or “smart money.” In the 1930s, he founded a school that would later become the Stock Market Institute. The school's central offering was a course that integrated the concepts that Wyckoff had learned about how to identify large operators' accumulation and distribution of stock with how to take positions in harmony with these big players. His time-tested insights are as valid today as they were when first articulated.
Method:
One objective of the Wyckoff method is to improve market timing when establishing a position in anticipation of a coming move where a favourable reward/risk ratio exists. Trading ranges (TRs) are places where the previous trend (up or down) has been halted and there is relative equilibrium between supply and demand. Institutions and other large professional interests prepare for their next bull (or bear) campaign as they accumulate (or distribute) shares within the TR. In both accumulation and distribution TRs, the Composite Man is actively buying and selling - the difference being that, in accumulation, the shares purchased outnumber those sold while, in distribution, the opposite is true. The extent of accumulation or distribution determines the cause that unfolds in the subsequent move out of the TR.

Are We Actually in Redistribution Down to $5k?We have successfully tested the upper resistance of our trading range with a tiny upthrust and turned down towards the $35k support, following $32k and $30k.
Regarding p&f chart, i've explained in my previous analysis that we have 13 columns so far in the accumulation structure. This counts to a $39k potential, but we need at least $26k more to reach our beloved $100k, so We need at least 9 more reversal columns within the trading range for a potential of +66k markup taking us from $35k to over $100k.
But...
If we fail to break above trading range, we might see further downside and we souldn't rule this possibility out. That would mean the structure we are looking at right now is not accumulation but a redistribution, meaning continuation of the down trend. Remember in my last update, Bruce Frase analysis showed we could end up at 4-5k!
So how do we tell if we are in accumulation or re-destribution?
Let's watch another great workshop from Bruce Fraser on re-distribution structures. You will see it's not uncommon or impossible to find ourselves in this situation and it is my biggest concern right now.
www.youtube.com
I have drawn a red downtrend line on my imaginary accumulation structure starting on phase B all the way to phase D. This is a bearish descending triangle. If this plays out we can confirm the accumulation by observing this bearish triangle (which does not exist yet) and price should break this triangle in order to confirm and start new uptrend. If it fails to do so, we may find ourselves at $4-$5k lows! This is the difference between accumulation and re-distribution.
Therefore, since we cannot confirm the bullish acccumulation case just yet, we should be patient and wait until such a confirmation happens.
The rest will be history.
Trade safe!

Bitcoin Death Cross With P&F ChartsHi,
Tradingview removed my analysis update so i'm posting the revised version with LOVELY Tradingview charts!
In this update i want to explain wyckoff method using poit and figure charts. Wyckoff uses them for identifying the events without the noise. These charts are created using x and o's, hence the topic tic-tac-toe . Google it and you can play the game right on top of search results, cool.
Ok, before going deeper, let's remember the death cross is only one day ahead of us. I want to talk about this briefly because the death cross can create false signals sometimes. In order to confirm this pattern we should look at the context. As a rule of thumb, if the price did not drop more than 20% of it's highs and already recovering, this can be a false signal, but if the price has dropped more than 20%, then the death cross might be hitting hard - which is our case! That said, i do believe we will see a big crash within few days given the vulnarable position of Bitcoin .
Let's also not pass the upthrust event. Yes, it was a tiny one :) I expected a more violent upthrust, but it's a good time to note Wyckoff is not a chart pattern, it's a system that can come in many forms and shapes, so take the drawings as a guideline. You should be studying p&f charts, which is the subject of this post.
Back to proint & figure charts, these charts do not use a timeline like candlestick charts. You only get a new column if there's a price reversal. That means p&f charts articulate volatiliy. This makes it the perfect tool for our crazy volatile Bitcoin . P&F charts remove the noise and makes support and resistance levels crystal clear.
For example, the red support at $35k is clearly the first immediate support of the prior swing low. If it breaks, that will be a Double Bottom Breakdown pattern on the p&f chart. These charts are squeezed version of bar charts where you can only add a new column after a reversal.
The curent structure is currently holding an almost $40k potential fuel and it's not done yet until the last point of support LPS event. Given the price is already at $35k, it can't go below zero, so this $40k (and counting) will be added to the current price, (not substracted) Which takes us to $75k ALREADY!
Fuel calculation is:
Number of coulmns x reversal x box size
13 x 3 x 1000 = 39.000
I'm using 3 box reversal with a box size of 1000
Now, since we want to break $100k, we still need at least 25k worth of accumulation. So, 60% is already accumulated and 40% still remains.
It's not easy to understand and explain these charts, but in order to understand how powerful they are, i urge you to watch this* excellent Bitcoin analysis from Bruce Fraser (i'm not advertising here) right before the crash back in May 14th. It's a timeless piece that will make you want to learn p&f charts:
www.youtube.com
If you noticed, he's pointing even lows at 4-5k's in his analysis, if all the distribution counts were dumped. His conservative target was $40k first which was broken and then $31-$26k range, but the scary thing is that the composite operator has enough fuel to take the price of bitcoin down to 4-5k if he wanted to! This is why we have to be extremeley cautious before we go all in.
Here's a wyckoff p&f chart tutorial from Bruce Fraser (He's a wyckoff p&f chart guru)
Part 1*
www.youtube.com
Part 2*
www.youtube.com
Trade safe!
(*) These videos are not from my own channel and i don't get paid to advertise anything here.

US30 is mega bullishThis is my setup for US30. Looking to enter at 34550 and set 34880 as a primary target before we go to 35000. Zero indicators. Just raw price action as price is in an accumulation phase. 300 pip target. Expecting volume in the New York session. Let's go!

BTC - WYCKOFF ACCUMULATIONAt first, we have to understand that Bitfinex doesn't concentrate most of the market however nowadays arbitrage bots reflect orders almost instantaneously, causing the market to converge on data information.
On the 4-hour chart we can observe a distribution starting around 1:00 on the 26th of April and extending to the 11th of May.
The famous "Sell In May an Go Away" took the market with a removal of capital which can be seen by the decrease of the Long position at 9600 BTC and also the short position at approximately 2900 btc, as the market lateralizes.
In short, the market lost interest and with it a net reduction of 6700 BTC of position.
Every market when distributed weakens, becomes fragile !!!
Saturated, the market gave way.
DOWNTREND:
The players then decided to take advantage and open short position, which had a big rise between May 16th and 17th. The price in this period was between 49500 and 42200.
So, without buyers and with shorters, the market collapses. So the Shorters take the opportunity to close their short positions.
ACCUMULATION - PHASE A:
Short positions closed We have the Selling Climax created, with the automatic Rally right after it, it would be the beginning of a Wyckoff accumulation.
ACCUMULATION - PHASE B:
As you can see, the accumulation phase at B is driven by an increase in Long positions as the market lateralizes, absorbing more and more BTC in Dips.
ACCUMULATION - PHASE C:
After successive absorptions in the dips with some realizations in tops that guarantee an improvement in the average positioned price, the market applies a FUD.
The intention of the FUD is always to buy cheaper, that is, to attract bears to help push the price and turn the hand on the bottom, absorbing as it was absorbing before in phase B. Except now the player finds a market with greater scarcity.
Typically this FUD is applied to complete Passive Accumulation and begin an aggressive accumulation that will form phase D.
ACCUMULATION - PHASE D:
It can be seen by the shorters that some Bears were trapped, this happens frequently at the end of accumulations and it is these losing players that are responsible for the classic movement of breaking Resistance called JUMP AT THE CLIFF.
Confirming the JUMP AT THE CLIFF the market enters phase E, firing up and then returning to a Pullback to then resume a bullish direction.
Maybe that's the long-awaited destination for the 100k in December.
You can see that the market goes through the stages of accumulation perfectly, for those who know the stages of accumulation of wyckoff this may look like a painting, I might be thinking of creating an NFT of this, it's beautiful!

Bitcoin Wyckoff Update: Upthrust Event In The MakingHi all,
Wyckoff accumulation schematics are playing out well until now. Price reached at the upper resistance level of the trading range at $40.841. I'm exiting all my positions now as we are entering an upthrust event, because this will not be a sustained breakout and will flip anytime down fast according to wyckoff accumulation schematics.
Red circles on the chart indicates huge absorbtion by the composite operator, but he is just getting started. That's why he will dump hard around $45k with a handsome 40% profit and buy back at the highs of $20k and then 5x to $100K.
Now it's time for me to step back and wait for a week or two, until price drops below 30k, because i'm a low risk type and prefer piece of mind over greed. I will be going all in after the spring type action occurs. Note that spring type action may not happen at all, but i think it will happen, because the Bitcoin composite operator loves freaking out fellow bitcoiners.
Remember, we cannot know if we are in accumulation or re-distribution until a sustained up or down trend starts. I'm betting for the uptrend, but a downtrend is also possible.
The longer we continue accumulation, the higher the destionation will be.
Stay tuned & safe.

UK Low Float Long IdeaVery low float...many technical gaps left...
I am accumulating carefully with alerts set. Ideally want to see major support get put in anywhere around 4.10s-4.20s (spot is 2.24 right now)
Could see some major moves in the near future. OBV don't lie.

Update: Secondary Test Is Now HappenningHi all,
In my previous analysis, secondary test occurred way above selling climax which was bugging me, now with the 15 months long term uptrend has broken and price is leaning towards $30k, i believe secondary test will actually happen now.
So i've moved the secondary test event by 5 days. Note that this is the break of 15 months long uptrend, hence the secondary test took more than i expected.
Next, I expect a bounce, following a rally towards $40-$45k next as per wyckoff events and step in to phase b of building a cause. There will be a secondary test in this phase, but it will be lower than the upcoming one in phase A according to wyckoff schematics.
I believe $30k will hold, but i can be wrong. Therefore, don't rush for a long trade now, or be very cautious as we are in a bearish trend now.
There's also a bearish flag formation here which suggests longer down trend towards $20k.
So, never fire all your bullets on one trade.
As always, stay safe.

BTC Wyckoff Accumulation Phase D BeginsBTC has been consolidating for several weeks now after a very impulsive sell off caused by over-leveraged positions being liquidated.
The consolidation was really just an accumulation period for the larger players wanting to get back into the market without pushing price up on themselves.
Wyckoff Accumulation pattern 1 is playing out very, very well so far.
Once price breaks out of Phase D into Phase E, what will cause price to continue higher is the once again over-leveraged short positions of all the people believing we're in a bear market.
Someones gotta supply that liquidity. Glad its not me
school.stockcharts.com

Bitcoin - still redistribution scenario - after mSOWBitcoin - still redistribution scenario - after mSOW


Short-Term Bearish/Long-Term Bullish. GNRC Flashing Entry's GNRC isn't one to give great indication on when to enter, the good long term runners rarely do.
Looking a little bit forward, GNRC flashing a potential accumulation set-up for another mark-up.
My trade idea here is a break down into lower checks of support labeled on the chart between $308-$314 and $325-$330.
-Accumulating an average of around $318-$320 would manage risk well based off of the potential moves into support.


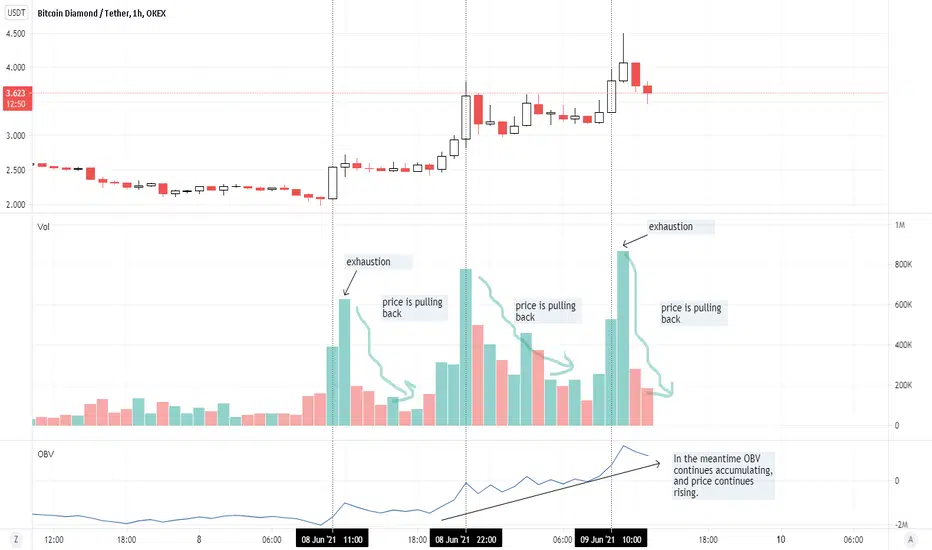
BCD. Using volume to notice ideal market behavior.Volume is in the foreground once again. One predictor of if a trend will continue, versus if price movement is a momentary aberration, is to see what volume is doing during rises and pullbacks.
For us to say that the up-trending market action will continue it is ideal to see above average buyer volume on the leg candles (the large green/white candles) followed by decreasing relative volume at the same time that price is pulling back.
What is the thing we are trying to avoid? If price makes a big green leg out candle then is immediately followed by equal or larger red selling volume, we might not have as much confidence that the rise in price will continue. We might even think that any proceeding pullback may actually be the start of a more coordinated downward push.
In the example I have charted here you can see large buyer volume on the legging out, then dwindling volume on the the pullback. That's pretty much the gist of it.
For bonus: You may or may not have the idea to check OBV (on balance volume) to determine if accumulation is occurring. The OBV here clearly shows that it is steadily rising in tandem with price. This tells us, at the very least, that this cryptocurrency is no longer in a period of distribution. At least for the present moment.
----
The same thing just flipped upside down is true for selling. You want to see large red volume bars followed by diminishing volume bars during the relief rally period.
The best part about this is you don't have to take my word for it. I have searched through my libraries investment section, and read a portion of it. In my opinion (now you might have to take my word), the most useful book is "a beginners guide to day trading" second edition. by Toni Turner. It's just so frickin' simple and good in all the right ways. I had a strong foundation before I started reading it, but it's packed full of timeless trading material, and it reinforced and added on non-destructively to everything I already had acquired. Toni Turner clearly knows how to trade, and also how to make information highly absorbable. I'm grateful the result is a book.
Gold Analysis - WyckoffHi Traders/Gamblers,
This is by far my most intricate and detailed analysis of Gold following a distribution that took place a few months ago, as shown.
We have hit our target area for gold as shown and stipulated.
Following the DXY's downward it has since settled and seems to be consolidating giving signals of a reversal with a H&S as well as distribution taking place.
This then means that gold is currently experiencing the opposite as it heavily relies on the USD to determine price action - DXY effects gold at around 2 - 6 times the movement (1% movement on DXY makes 2% - 6% on Gold, depending on sentiments and trend).
Gold could be potentially distributing here as it has reached accumulation cause and effect, or Stage 1.
We now wait for the other stages to be completed to fully confirm a downtrend which would see significant downward movement - possible into the 17xx or 16xx.
This however could also be a re-accumulation into a further upward trend, giving us 2xxx, it is important to note that we could still see 1960 as a point of UT or UTAD before going down.
RSI has broken upward trend and is currently bottomed out on Daily chart showing that we could range for a little more, however MACD is topped out and has crossed over signalling a reversing trend in the near future.
Volume is decreasing, creating a base, showing an exhaustion of demand and buyers and the possibility for sellers and supply to take over.
With CPI being released tomorrow at 1:30pm (UCT) this will be a good indication of where the market will stray, we are hoping for a lower low giving us SOW and then retracing back up to give us a last point of supply before heading down.
Once we have received the SOW and the LPS we will then be able to use the point and figure chart to determine a target objective based off of cause and effect.
It has been said that Russia are wanting to dump the dollar and invest in euro and gold which could possibly mean that Russia will sell off their gold positions and look to add more at a cheaper rate of gold - emphasising again the significant downtrend we could see along with a big spike back up once target is reached.
To read up on the Wyckoff method and the phases, stages as well as buying or selling signals read here: school.stockcharts.com
Good luck.
**This is not financial advice**
Chart is made shareable by clicking this link: uk.tradingview.com

VINO low float longI am still long vino from 3.40s. Holding for 2-3x
VINO
40 for 1 split on nasdaq uplist 7.5M float
Insane levels of accumulation.
Tumin Stone Capital is the offering buyer (owned by 3i)
Offering due to close anyday now...been seeing huge institutional block buys coming in over the last few weeks. You looking for the next low float banger that is severely undervalued? This is probably you're best bet.
Be careful of your risk sizing especially if you can't catch a dip. The spread is very wide most of the time....20c or more at times. Use precaution as obviously low floats can be very volatile.
I have a sell order at $6, then $8, then the rest at $10.
Goodluck.

ETH Wyckoff Accumulation. Currently at Phase CAfter a large sell off, ETH has been consolidating (accumulation) at a previous Demand area between $1800-2500 USD, with strong Daily rejection candles off the low.
Now we are seeing the big picture play out with Wyckoff Phase A and B ending and Phase C starting to take place.
Compare this with the Accumulation Schematic #2 of Wyckoff Events and Phases. school.stockcharts.com
Long ETH

Wyckoff daily accumulation on $FUBO PT: $64.14Wyckoff accumulation breakout to phase E. Likely to come back to test e breakout support level. Current price is 28.00.

Bitcoin How Low Can We Go? Heading To Heavy Accumulation Zone.First it was Elon Musk, then the China mining crackdown, then the Colonial Pipeline ransom, and now Donald Trump thinks Bitcoin is a scam oh no!!!! What's next on the Bitcoin punching bag? Overly optimistic when prices are high and overly pessimistic when prices are low is how our emotional psychology works plays against us.
The lowest point I see Bitcoin potentially trading at is $27,500 at worse. Can we get below $30,000? Absolutely. But as I said previously I believe Bitcoin at these prices is going to get purchased up very fast especially if we drop below $30,000. Are we heading towards $20,000? I still don't believe so when a company like MicroStrategy goes $400 million into debt just to buy more Bitcoin at around $30,000. That's just my opinion though I could definitely be wrong. We're at the bottom of this channel and Bitcoin between $28,000 - $30,000 is a very hot buy zone.
Don't let the media trick you into thinking that your Bitcoin is worthless or it's a scam. Bitcoin is here to stay and bring mathematical integrity to our current economic system. El Salvador just became the worlds first country to adopt Bitcoin as legal tender. Meaning that Bitcoin will be widely adopted by El Salvador to pay all forms of public and private debt within the country. My question is which countries will be next?
We're probably going to have a choppy summer of sideways movement between $30k - $40k but don't worry. These prices will be another time we reflect and say "I wish would've purchased more."
Much peace, love, health, and wealth! Always hodl and never sodl at a loss. We will get through this period.

Your daily horoscopeThe stars allign and the halfmoon is comming up..
Which is always the best time to buy!
100x long from here could very wel be a smart move.
D.Y.O.R.
Never forget your stoploss

BTC long idea (risky)This is a 2 parts entry idea, based on 4hr. HTF is still bearish, so please manage your risk.
I know this is a risky one, but RR seems worth. stop is 4hr close below 31630.
++ Price is ranging for a while, and this seems like a wyckoff accumulation. potential target is 47-50k.
-- HTF is still bearish, and we're visiting the green box support once again, but its getting weaker with each visit.

$WISH LongLooks to be heavily accumulated and intraday putting in another retest of support. Unfilled upside gap at $11+ but this could turn into a very long term hold or swing.
OBV showing somewhat of a floor being put in, intraday ranges are still wide but starting to creep back up slowly. After the gap fill at $11 anything could happen. Good luck.
