BTC HTF internal re-AccumulationBTC producing internal HTF re-Accumulation from last leg up.
Targets gonna be: ATH
In case of Model Fails = 48k. and waiting for future possible Accumulation
Accumulation

Island Gap Potential, Dark Pool Buy Zone, HFTsThis stock has the potential to form an island gap, which are caused by High Frequency Trading activity that triggers on news. The gap down was too huge, so fundamentals are above the current price. This would be a gap UP potential at this point, to create the island gap.
The lows have been established clearly, so selling short this stock is not wise. But smaller funds and retail may try, as they tend to sell short stocks within a Dark Pool buy zone. Chaikin Osc and Money Flow Index are moving upward but the angle of ascent on price is steeper. The faster price ascent could be rapid accumulation from derivative developers.
UIPath creates software for Robotic Process Automation. It was one of the stocks discussed in the Case Study I did with my students in the summer of 2022 on the disruptive new technologies to watch over the next decade.

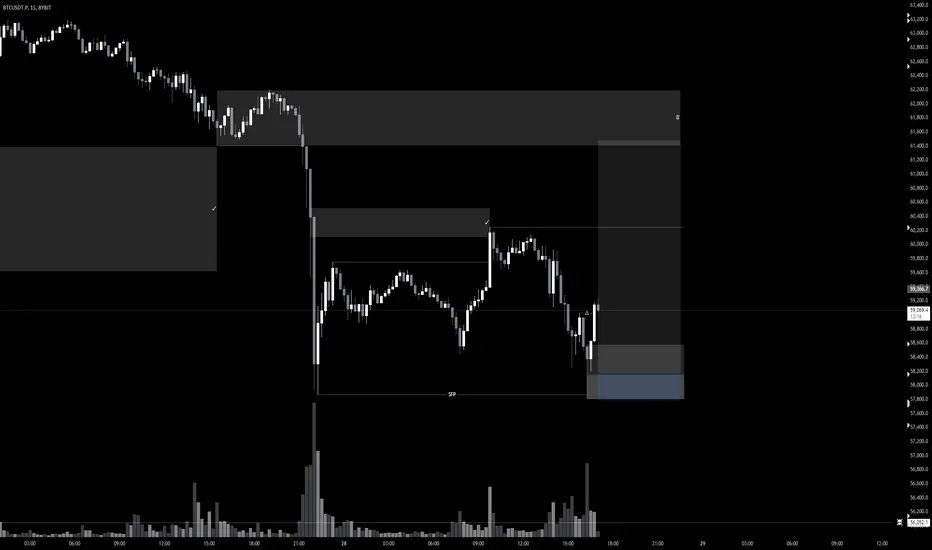
BTC Local internal AccumulationBTW Bybit fronrunned low.
Could be internal Accumulation. but PA in nowhere actually
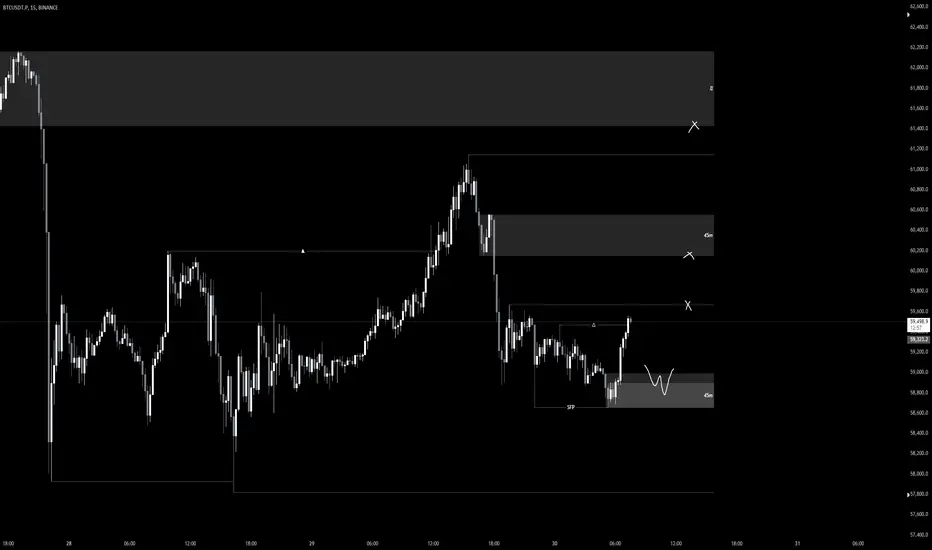

BTC Local Accumulation1D demand OB failed, producing range Supply aka flip
Accumulation signs. make sense to at least take range high / mitigate flip zone.
Why I won't be 'shaken' out of my Silver-accumulation longs
Please, check out my charts. The 4HR, Daily and Weekly.
How bullish is looking for Silver. Today's price-action has already taken out last weeks high.
I recommended to many of the traders following me here on TV, to get into a Long position(s) in Silver today. Why? Well without even speculating on the FED making it's move on interest rate reductions & where my personal view is the obvious one that the Gold price is going to skyrocket, notwithstanding this the Silver chart on the high T/F's is so bullish at the moment.
If one of the Gurus tells you to sell Gold or Silver at the moment and take TP, you are losing the compounding effect of accumulation IMHO. Just chuck on a loose trailing stop. But make it loose because the market-maker 'coats' will drive price down to your stop & take you out. I see it time and time again, which is why I generally only use 'soft-mental-stops'. I'd rather lose the lot myself than have a coat take me out.

BTC Ideasintresting PA.
PA Struggling to break Supply.
Range forming. Some ex still didn't took 1st tap - could indicate as re-accumulate neither distribution. But decent break of range Low (63.500) - would confirm distribution and possible po3 play. Targeting 48k
In case of re-Accumulation and Supply fail - ATH

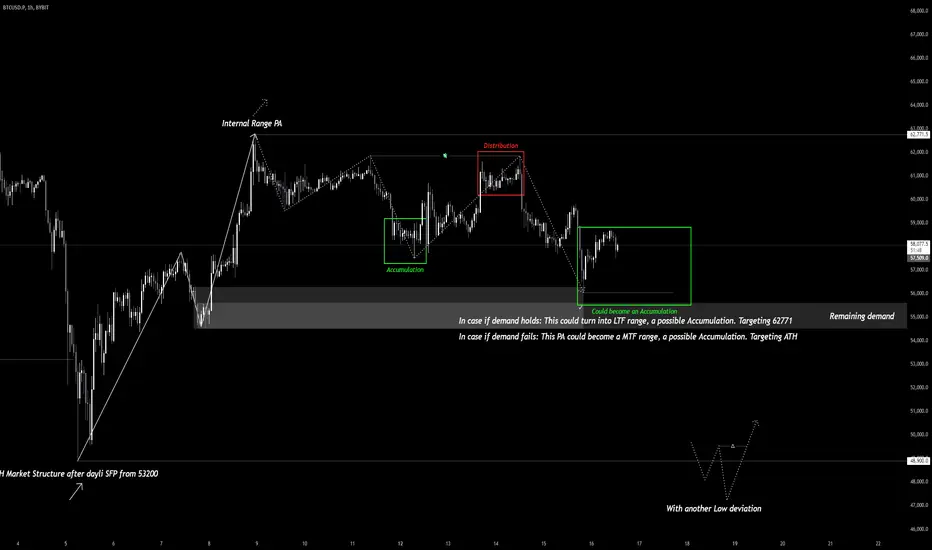
BTC PA IdeasPrice tapped into crucial demand IMO.
If we hold it, a 4h MS remains bullish, after a dayli SFP.
Possible LTF Accumulation could happen here. Targeting 62700
If demand fails. High chanches to take HTF range Low one more time.
Possible MTF Accumulation cound happen. If price SFP and break some MS. Targeting ATH
Bitcoin (BTC) in Critical Consolidation PhaseMarket Observations:
Despite good news and rising equities, CRYPTOCAP:BTC is consolidating and moving sideways, which isn't a strong sign for bulls.
Key Levels to Watch:
Support Level: $60,000 – This level must hold, or BTC could move towards the downside.
Breakout Level: $62,500 – A clean break above this level would demolish the bear thesis and likely trigger long FOMO in the markets.
Current Market Range:
BTC is still in a massive range, similar to summer 2023. If the fractal pattern follows, this accumulation phase could continue for another 35 days.
Market Outlook:
Stay cautious as BTC consolidates, and keep an eye on the key levels that could determine the next major move.
#Bitcoin #BTC #Crypto #MarketAnalysis #TechnicalAnalysis #Cryptocurrency #SupportAndResistance #Consolidation #FOMO #Fractal #Accumulation

Smart ADA Accumulation: Prepare for the Best Opportunity Until 2Starting from the next few months, accumulate as much ADA Cardano as possible and stake it. We are entering the best accumulation phase, which should extend until May 2025. There is still plenty of time to accumulate! In the end, you will have an average price between 0.15 and 0.3 and keep some extra funds for the downturn.
BINANCE:ADAUSDT
CRYPTOCAP:ADA.D

Yay or Nay?It's decision time. Critical point here. BONK failed to break and close above the upper resistance from the last ATH to pump to fresh new highs.
Do we gonna go straight up, sideways to create a strong base or down to major support?


Where were you?Inverse HS in the monthly timeframe. Earning on August 6th. I'm holding through earnings. SL if a weekly candle closes below 10.

BTC Possible AccumulationVolume decrasing. PA trying to accumulate
Seems reasonable to take curling liquidity and mitigate frontrunned 2h Demand as 2nd Tap.
Ordrerflow to atleast take local highs, Possible reverse up to ATH

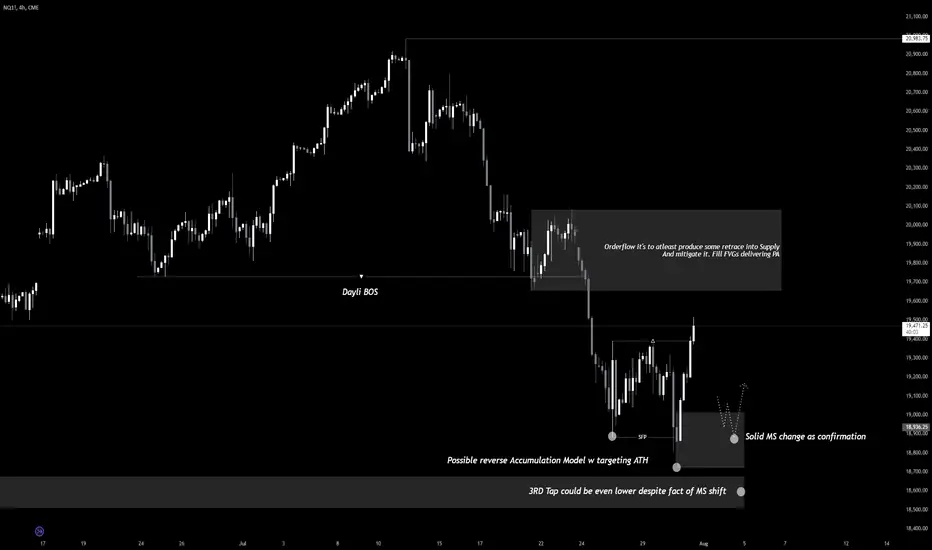
NASDAQ AccumulationOrderflow of this accumulation it is to at least produce retrace after Dayli BOS.
Could turn into reverse Model. aiming highs. Making Dayli break - false
MARKSANSWeekly Breakout Done.
Accumulation Done.
Huge Volumes.
Good for Short Term.
Do Like ,Comment , Follow for regular Updates...
Keep Learning ,Keep Earning...
Disclaimer : This is not a Buy or Sell recommendation. I am not SEBI Registered. Please consult your financial advisor before making any investments . This is for Educational purpose only.

RPGLIFERounding Bottom Breakout.
Huge Accumulation done.
Volume Buildup seen.
Above all EMA.
Good for Short Term.
Do Like ,Comment , Follow for regular Updates...
Keep Learning ,Keep Earning...
Disclaimer : This is not a Buy or Sell recommendation. I am not SEBI Registered. Please consult your financial advisor before making any investments . This is for Educational purpose only.

Accumulation - 8hrDespite what price action represents, ADA has been accumulated over the last 10 months.
Trust where the money goes, regardless of what they say to bring price down

MATIC: GENRATIONAL BOTTOM IS IN!!Hey everyone!
If you're enjoying this analysis, a thumbs up and follow would be greatly appreciated!
Welcome to this MATIC/USDT UPDATE MATIC looks amazing in the weekly time frame.
Last time when MATIC accumulated in a 610-day channel it led to 20,000 Returns.
Now, it is forming a symmetrical triangle kind of structure and accumulated in the triangle for more than 1200 days. Right now, it is sitting at the lower trendline of the triangle and also holding good support here. Buy some now and add more in the dip.
Must Hit Targets:- $2.84/$4.72/$7.16/$9.88
Overall it's a double-digit potential, so leave some % for a moon bag🚀
What are your thoughts on MATIC's current price action? Do you see a bullish pattern? Share your analysis in the comments below!

Accumalation On MARA WeeklyWe have our stop loss set at the local low at 14.10$ giving us 4.5 to 1 on our trade , targeting an old 2016 top at 49.67$. This is probably too messy to be called 3 rising valleys since the 2 first valleys arent too symmetrical but still looks like a promising trade if monitored correctly.

Accumulation and High UncertaintySummary
The analysis of the current exchange rate reveals a period of indecisiveness, as indicated by the symmetrical sideways triangle and low trading volume. The application of the Fibonacci Retracement confirms the price accumulation between the 38.2 and 61.8 levels, highlighting uncertainty and high risk in positioning. Additionally, the technical analysis with moving averages and MACD does not provide a clear direction, with MACD suggesting a potential new trend due to divergences. A comprehensive approach requires confirmation of scenarios from additional technical indicators. The analysis suggests a wait-and-see strategy, warning of the risk associated with significant price accumulation.
Trend Determination
The direction of the exchange rate is not clearly defined. It is bounded by a symmetrical sideways triangle and moves within the entire range of the formation. This formation suggests indecisiveness and is characterized by very low trading volume. To investigate the current formation, the analysis will expand by reviewing the movement of the past two years. Using Fibonacci Retracement on the range of the downward movement, the current movement is confined within the 38.2 and 61.8 levels, indicating significant accumulation and indecisiveness. Positioning trades when the price moves within these levels entails very high risk. It is also important that the upward corrective trend was halted at the 61.8 level.
Based on data from the chart and literature on the symmetrical triangle, there are no clear indications for future price movements. A wait-and-see approach for a bullish or bearish price breakout is a moderate strategy but reduces considerable risk for the portfolio.
Fibonacci Support and Resistance Levels
Fibonacci Retracement
Given the significant price accumulation observed recently in the exchange rate, the Fibonacci Retracement tool will be applied over a longer-term horizon. Specifically, it will be applied to the previous significant upward movement to delineate the price levels indicating the beginning of a new upward or downward movement.
The first scenario involves an upward movement of the exchange rate, with 1.06916 being a significant resistance level. Its breakout increases the likelihood of rising prices.
The second scenario involves a downward movement of the exchange rate, with 1.02163 as the first price level. Subsequently, breaking 0.97410 further supports this scenario.
These scenarios require confirmation from other technical indicators and studies; they cannot stand alone for decision-making and trade positioning. There are significant risks and peculiarities in the case of intense price accumulation due to substantial market participant pressure.
Fibonacci Expansion
Similarly to the previous case, the Fibonacci Expansion will be studied in the previous significant upward movement. The peculiarity in this case is that an estimation of levels can be made if the exchange rate moves upward. Attempting to identify levels in the opposite direction has a high probability of incorrect estimations.
The resistance levels that appear to exist, and their distance from the current price, are as follows:
A) 1.13062 – 400 pips
B) 1.17815 – 876 pips
C) 1.25504 – 1645 pips
Technical Indicator Analysis
Moving Averages
The current exchange rate prices are between the moving averages. The distance of the current price from the moving averages is statistically insignificant and cannot be utilized for further analysis. Thus, visualizing the moving average results does not provide reliable conclusions about the exchange rate trend.
MACD
The MACD is positive and on an upward trajectory, but its momentum is not satisfactory. Visualizing the MACD results shows divergences between the MACD trajectory and price trajectory. The existence of divergences at this time could mean that the exchange rate might establish a new trend. The MACD results are unclear and do not provide actionable data.
Stance: Neutral | Outlook: Neutral | Risk for placing orders: Extreme

ONDO (ONDOUSD): Spot Trading Opportunity Amid Bitcoin BottomWe are screening through some altcoins for potential wick trades on a possible bottom on Bitcoin and found interesting levels on ONDO.
Current Analysis:
We are looking at the spot chart here as we would plan on entering spot rather than perpetual, but technically, you could do it. We got multiple levels here that support one idea, getting support from the 3D demand zone and the HVN POC (point of control). We got both the 3D and the D FVG above/on the demand zone. In an ideal scenario, we would look at a wick into this demand and nothing more.
If this doesn't hold, we would target the second 3D demand and the 3D BPR down below. Everything in between seems irrelevant for a spot trade.
Strategy:
Our target would be above the current high. If we place a target, we will cover it in a market report as usual.

Reliance Industries: Could be great momentum trade!!Reliance recently raised its mobile tariff. So the stock is in news.
Stock was trading in a range (rectangle pattern, darvas box, accumulation stage.
After the announcement of the tariff hike by the company, its stock price broke out from the range.
This breakout could be the continuation of the uptrend of the stock, and in coming days we have see further rise in the stock price of reliance.
Pattern gets invalidated if it breaks down from the range.
