Pump Up the JamMonthly Chart of CBLS. Bullish! Little Island Reversal w./ a double bottom. Expecting to C higher monthly Close(s). Higher lows on each month.
Accumulation

BTC Short term correctionI think we touch 55-58K range before starting the 2nd leg of the Bullrun. This fractal is from 2019

MPC - Shift In Momentum In Action 📉📈Hello TradingView Family / Fellow Traders. This is Richard, also known as theSignalyst.
📉 MPC has been overall bearish trading within the falling channel in red.
📦 Currently, MPC is hovering within an Accumulation Phase between $0.3 round number and $0.36 major high.
📈 For the MarkUp phase to start, shifting the momentum from bearish to bullish, a break above the last major high in red at $0.36 is needed.
🎯 In such a scenario, a movement towards the $0.525 resistance would be expected.
📚 Always follow your trading plan regarding entry, risk management, and trade management.
Good luck!
All Strategies Are Good; If Managed Properly!
~Rich

HOW-TO: Accumulation Strategy 2024What if instead of buying a stock, crypto, currency only once and holding until we are in profit, we split our strategy capital and buy several times, until the total is in profit ? Yes, that is DCA you’d say. Ok, but what if instead of buying at predetermined intervals, we bought at oversold RSI, or on a double bottom, for example ? That’s the idea behind the Accumulation Strategy, which I’m going to explain in detail in this article.
█ Simple Example
The strategy comes with several features, and the easiest way to explain them is through examples.
The Max Active Deals input allows to limit how many times the strategy can trigger a buy in a trade, just like the pyramiding setting. It can go up to 100.
In this example, the strategy has 10 max active deals. and is using the RSI feature to buy when RSI crosses below a configurable threshold, here 25.
Note: to get stronger signals, the RSI time frame has been set to 1 hour, since the chart is in a 30 min time frame.
In this trade, the strategy bought 8 times (yellow arrows) before selling at take profit, but it could have bought twice more.
█ Take Profit Feature
Customisable in the input tab, this feature allows you to set one or multiple take profit(s). You can set the value in either %, pips, or Auto mode.
To create multiple targets, increase the Number of take profit and set the Step between each TP.
In our previous example, instead of just one, I set 3 TPs with 1% value and a step of 1. The strategy will sell progressively at a quantity split even at each take profit, until the last TP is hit.
Note: Using multiple take profit is often used to improve risk management in trading.
█ Built-in Entry Options
The strategy comes with several built-in indicators, such as the RSI that we’ve seen, but here’s the list:
MTF RSI cross, RSI divergences
MTF Stochastic cross
MTF Bollinger Bands cross
Top & Bottoms
Double Top & bottoms
Higher/Lower Lows/Highs
Custom External Entries
If you want to use ANY external indicator from the TradingView library and use it as an entry signal, you can!
For example, let’s use the Squeeze Momentum Indicator by Lazybear. After adding it to the chart, we select the first plot which is the histogram. Then we select the condition “crossover” and “0”. It will create a buy when the histogram turns green.
█ Trend Filters
In trading, we try to avoid going against the global trend.
The strategy comes with several built-in trendlines, MTF, or you can use ANY external trendline from the TV library.
The strategy offers other built-in filters such as volume, overbought in range/trending market, or flat market entry filters.
█ Stop Loss
The stop loss can be turned on/off. You can set the value in either %, pips, ATR or Auto mode.
Note: When to use a Stop Loss? Using a stop kind of defeats the purpose of the strategy, but it can be useful if you plan to trade highly volatile and risky coins (remember LUNA ?) That is why the option is there.
█ How to use the strategy
The indicator access is unlocked by subscribing on my website. See the links below this article.
█ Setting up a strategy
You can set up a strategy on your own chart in just one click using the preconfigured charts I will share below, or you can simply add the indicator yourself and play with the settings.
Backtesting
Backtesting is automatically done in the Strategy Tester Tab.
Creating Alerts
Once you have your strategy setup on the chart:
1 - Set the alert message in the indicator inputs (scroll to the bottom, you will find an “alert’ section)
2 - Save your chart and do not touch it anymore unless you want to update your alert (optional but recommended)
3 - Create an alert on Cyatophilum Accumulation Strategy, using the option “alert() function calls only” (this is really important!)
Only one alert is needed to handle all the strategy events! (entry, take profit, stop loss, etc.) Even a free TradingView user can create a strategy!
Automation
The subscription that I offer also comes with Automation bots using the Binance spot trading API .
Important: if you wish to automate your strategies, make sure your TradingView account has access to alert webhook notifications .
That’s it for this tutorial!
Pretty easy right? No, I know it can get complicated at first. 😣
That is why I make preconfigured charts. Once you have access, click on the chart link, then click “copy”, then “save” your “layout” to get your own chart that you can use and edit. Enjoy!
█ Preconfigured charts
BTC/USDT
Chart: www.tradingview.com
ETH/USDT
Chart: www.tradingview.com
BNB/USDT
Chart: www.tradingview.com
MATIC/USDT
Chart: www.tradingview.com
EGLD/USDT
Chart: www.tradingview.com

VINC continuation play LONGHere on the 30-minute chart is my idea for the continuation of my VINC idea posted here before
the current breakout. Price is presently in a consolidation ascending regression channel .
The choices for a play are to wait for a break above or below the channel or alternatively
play the price action inside the channel. Since price is currently at the bottom of the channel
I will go long with a stop loss under the channel. Upon reaching the top of the channel I will
close half the position and then watch for a break of resistance or a rejection down and then
trade accordingly. Overall, I believe that this is a high-tight flap pattern and VINC is
accumulating gradually and will move higher when the accumulation saturates as per
Wychoff's theory.

[AUDIOUSDT] - it's matter of time for bullish rally🔥🔸AUDIO looks promising for weekly chart
🔸Long time of accumulation (581 D)
🔸Under testing of neckline of Adam and eve pattern.
🔸Still Valid for entry now.
Don't forget to support us with your like, comment and follow for more updates 🎯

I could pop at any timeDouble bottom apparently forming. Price is testing the 150 resistance but it doesn't want to go down, it keeps pushing it up. I think is going to try to break up the triangle again. Not sure if it's going to make it through at the second try but eventually it will.

Decred: Bullish Breakout Imminent?Considering the prevailing bullish sentiment in the market and the pattern observed on other cryptocurrencies throughout the crypto sphere that have broken out of a prolonged accumulation phase, it can be expected that DCR will eventually follow the general trend and repeat the pattern that we have already seen on many other coins.
Decred has been facing resistance at the $18.3 level since May 2023, but recent price action on the 1-hour and 4-hour timeframes indicates a breakout and retest above this level.
The next significant level to watch is $21.4, which has historically been a key support/resistance level for Decred. While there are signs of weakness on the 1-hour timeframe, such as candles with long shadows that could provoke short positions, there is still no confirmation of a breakdown in the upward structure. The 1-week candle seems strong, and the overall asset shows significant buying volume. This indicates that Decred may be able to consolidate above $21.4 and keep moving upwards successfully.
A breakout and consolidation above $21.4 could lead to increased volatility and larger price swings on higher timeframes, with potential profit-taking zones and resistance levels at $50, $67, and $85. Additionally, the February 2023 high of $28.52 may also present a next strong resistance level in the short-term future.

FTNT: Dark Pool Buy Zone SupportNASDAQ:FTNT is a good example of a stock that had a big gap down that immediately filled due to falling below its fundamental level and a Dark Pool Buy Zone.
This and the sideways trading range developing on the long-term trend creates strong support for weathering any sympathy moves from other cybersecurity stocks that have been over-speculated.
Sideways action is likely to continue for a time, but AI-driven cybersecurity will only become more important in the years ahead and this stock is still at a decent price.

Is BA Boening ready ?On the daily chart BA had big trend up for November and December but then fell with news
of issues the the Max model which further developed into an FAA inquiry. In the meanwhile
Thailand and India based airlines contracted for more jets and an earnings report beat both
lines especially earnings. It would seem forward earnings are fortified by those new contracts.
The chart shows price currently sitting at the support of the bottom of the high-volume
area of the volume profile and just under the nearby POC line. In confluence, it has been in
consolidation at a Fibonacci level. I consider that BA has been accumulating within a narrow
range and is now well situated for another leg up. The last trend up was about 50% over 2
months. I will take a long trade here anticipating a similar move sometime soon. Targets
are 230 and 250 with call options for August or September also under consideration.

APE Swing TradeRSI is at oversold making falling wedge also in manipulation level
do buy this gems coin recommended you spot buying
Stay Bless
Follow me and get latest updates
thankyou

[CELRUSDT] - breakout after long accumulation phase🔥CELR Cheerful in weekly chart.
Breakout 0.382 Fibonacci level...after many attempt for the breakout and Long time accumulation
(665days)
Catch it before bullishing so hard
Don't forget to support us with your like, comment and follow for more updates 🎯

Solana - Wyckoff Mark Up ExampleSolana vs. Wyckoff Logic
SOLUSD example of mark up in the Wyckoff logic schematic. If unfamilar, there are market phases according to Wyckoff Logic:
Accumulation: The phase where the market stops falling and begins to form a base, suggesting that demand is starting to overcome supply. It is characterized by a selling climax, where the price falls sharply, and the volume is high, indicating panic selling. After the climax, there is typically a phase of sideways movement, with occasional tests of the lows. This phase is labeled as the cause, setting up for a new upward trend (effect).
Markup: After accumulation, the price starts to rise, signifying that the market is entering the markup phase. This phase is indicated by a rise in price away from the accumulation zone, often with increasing volume, which is interpreted as the start of a new uptrend.
Distribution: This is the phase where the market tops out and is characterized by a buying climax. Supply begins to overcome demand as the "smart money" starts to distribute their holdings to the market. The distribution phase is also labeled as the cause for the subsequent downtrend.
Markdown: Following distribution, the market enters the markdown phase where prices start to fall consistently. This phase is shown by a break of support levels with increasing volume, indicating a strong presence of selling pressure.
The image also depicts the concept of "Volume" with a histogram at the bottom. The volume bars are colored in red and blue, generally indicating selling and buying volume, respectively. The histogram helps traders identify moments of high or low volume, which can be a sign of the strength or weakness of a particular price movement.
Wyckoff's analysis technique is grounded in the study of price action, volume, and time, as they relate to supply and demand. It is a tool for understanding the market's structure and potentially predicting future price movements by identifying the actions of large institutional traders and investors.

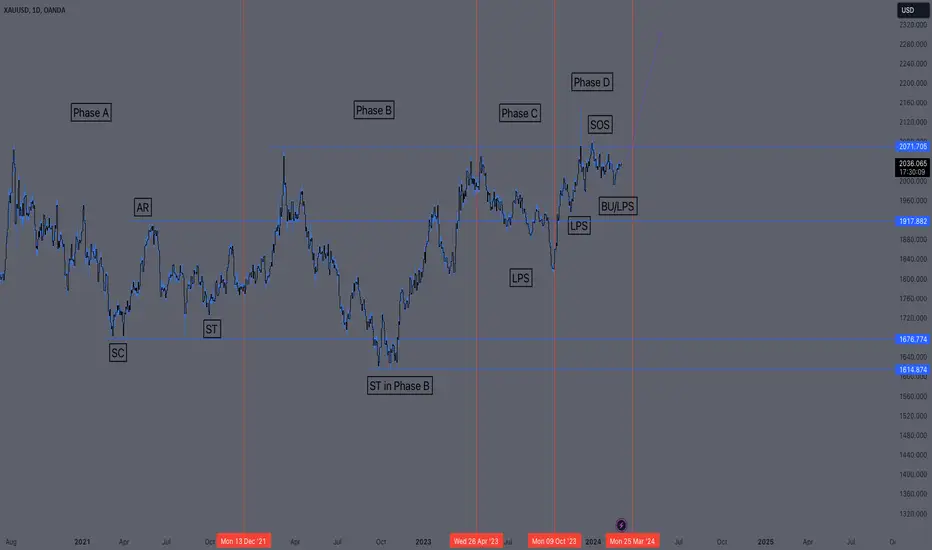
Accumulation Phase Over on Gold5 years of accumulation... Phase D almost done... PCE might send it up... full margin
SUNDIAL- Could Run HereFundamentals are kinda crap with a large surplus of weed on the Canadian market, I do wonder if the technicals could play out as accumulation. We shall see, I took a tiny position, not financial advice, DYOR ;0

The AI Crypto Boom: Is This the Beginning of a New Era?2023 has witnessed a significant surge in AI-related cryptocurrencies . This boom can be partly attributed to the explosive growth of NVIDIA (NVDA) stock, a leader in the graphics processing unit (GPU) industry, which are used to train AI models.
Factors Driving the Growth
NVDA's Rise: NVDA's price has been on a tear, forming a bullish manipulative pattern. This bullish trend has inspired investors to have similar expectations for AI-related coins.
AMD's Accumulation-Manipulation-Distribution Pattern: AMD is not a competitor of NVDA in this context, but rather an example of a successful "accumulation - manipulation - breakout" pattern.
This pattern is characterized by a period of accumulation, where investors slowly buy up a coin, followed by a period of manipulation, where the price is artificially inflated, and finally a breakout, where the price rises sharply due to increased demand.
Effect on Other Coins:
The bullish trend in NVDA and the successful breakout of AMD's accumulation-manipulation-breakout pattern have led to a surge in AI-related coins such as RNDR, THETA, NEAR, and FET.
A Look at Promising Coins:
RNDR: Render Network utilizes a decentralized network for 3D graphics and video rendering. The rise of the metaverse could potentially drive demand for RNDR's services.
THETA: Theta Labs aims to revolutionize video streaming by providing a decentralized content delivery network. The growth of streaming content could make THETA an attractive investment.
NEAR: NEAR Protocol is a smart contract platform focused on scalability and speed. The growth of decentralized applications (dApps) could make NEAR a valuable choice.
FET: Fetch.ai is developing a decentralized network for exchanging data and machine learning models. The growth of AI could increase demand for FET's services.
Important Considerations:
The cryptocurrency market is volatile and unpredictable. It is crucial to conduct your own research before investing in any coin.
This article is not financial advice. Only invest what you can afford to lose.
Conclusion
AI-related cryptocurrencies are experiencing impressive growth. While it is impossible to say for certain whether this is the beginning of a new era, the possibilities of AI in the crypto space are worth considering. However, it is important to conduct thorough research and understand the associated risks before investing.

VANRYUSD completion of a two-year accumulationThe VANRY/USD pair is currently in play.
We are observing an exit from a two-year accumulation zone. In the medium term perspective, growth up to 0.5 and higher can be expected.
Levels 0.15-0.16 and 0.3 can act as resistance zones and/or intermediate targets.

PCG caught my attention to continue bullishI want to Buy this Stock base on 2 main approach.
1.Technical Analysis: base on technical, using the ICT I trade with, The market sweeps liquidity and create a valid order blocks and expanded with Fair value gaps, target equal highs, this is good sing of strength to go bullish.
2. FOUNDAMENTAL REPORT: in this case, PCG stocks is own by 93% institutions , and the institutions has the highest number of transaction with 13%. on my on view, they accumulated BUYs to target the price of $18.50 or above

Verasity Macro Wedge About to BreakVRA has been consolidating over a substantial amount of time during its accumulation phase.
I think we may see a little more lower time-frame consolidation before a breakout.
VRA has reclaimed green (demand macro S/R) and should hold above this level for a breakout.
In my opinion, gone are the days of trading inside yellow (accumulation).
However, considering we see have yet to make a macro higher high, I consider this entire range within the wedge a large accumulation area.
Targets above marked T1, T2, T3 once this takes off.
Cheers,
Vatsik

XRPUSD - SMART-MONEY BUYS AND HOLDS - HERE IS WHY! ____________________________________________________________________________________________________________________________________________
Hello. Today i want to share with you an important and interesting observation which i made with XRPUSD. We are looking on the weekly-time frime. As the
cryptocurrency market consolidates and BTCUSD provides some possible bullish break-out signals, Ripple is an important coin to look at.
____________________________________________________________________________________________________________________________________________
As you can see on my chart, there is an pattern which exactly repeats.There is a reason why XRP is the third biggest cryptocurrency after bitcoin and ether-
eum. It has an longer history in the cryptocurrency market backing from a time where the mass of crpytocurrencys existing today wasnt there. As XRPUSD
provided two growth phases in which it gained 5544 % in the first and astonishing 94870 % in the second, the same pattern is repeating right now.
____________________________________________________________________________________________________________________________________________
After the first growth phase XRPUSD had an corrective phase where smart investors took profit and XRP dropped down, you can see the take-profit phase
marked with the red box in my chart. Then it took a long accumulation phase where smart money accumulated before public money to launch the
rocket to moon. This provided the second growth phase which you can see in my chart. The pattern provided the last months is nearly the same,
the take-profit phase with an ABC-correction an the accumulation.
____________________________________________________________________________________________________________________________________________
XRPUSD is an good coin with lots of support from banks and goverments which implementing and integrating the coin, also it held the market-cap and price
stady above the 0.24 support, it bounced several times in this price level as smart-money is accumulating, exactly the same pattern repeating seen before.
____________________________________________________________________________________________________________________________________________
Thanks for watching! May all luck and happiness come to you! For more market insight feel free to support!
The information provided is for educational purposes only and should not be used to take action in markets.
____________________________________________________________________________________________________________________________________________

How Smart, Retail and Dumb Money accumulates in the Market._______________________________________________________________________________________________________________________________________
Hello traders, investors and community. Today I want discuss with you how Smart-Money, Retail-Money and Dumb-Money (News trader) accumulates in
the cryptocurrency space.
In my chart, you can see the specific phases in which these three types of buyers accumulating BTCUSD for long-term purposes.
With two accumulation processes already finished and the third developing now.
______________________________________________________________________________________________________________________________________
1. Smart-Money: Given in a downtrend a new lower low is established, Smart-Money, also known as "whales", "institutional investors" or "Big Players" placing
high Limit-Orders (Often Over-The-Counter) at likely prices and pushing the price higher. A new short term-trend is developed.
2. Retail-Money: Also known as "private trader", "individual money" or "not-institutional" accumulating shares at given prices after smart-money already
pushed prices higher. There is still plenty of space for price to develop in this phase.
3. Dumb-Money: This type hears the news and rushes in to buy bitcoin shares. He does not follow technical analysis and is normally emotionally driven.
______________________________________________________________________________________________________________________________________
There is no way of accumulating right or wrong for long-term purposes but the best option would be to accumulate at best prices as smart money does.
In my analysis, I consider buy and hold for long-term purposes with these specific types, not traders.
As a trader, you can take advantage of it and places your trades for maximum profit.
______________________________________________________________________________________________________________________________________
Thank you everybody for watching, feel free to support. May all your trades going well but more important happiness and a good life! ;)
Information given is only for educational purposes and should not be used to take action in markets.
______________________________________________________________________________________________________________________________________

MOTHERSON LONG9 year consolidation need confirmation of break and close above 126 for continuation towards TP1 and beyond.
Auto sector has been doing very well and i expect it to continue for a while. lets see where this takes us.

medico intercontinental ltdstock is being accumulated between 114-6 one can consider it for long with there own stop loss and target it can give spike move probably. its is for education purpose only.
