ZB - Bonds on the waySo Forkers - here's your Bond Trade I've mentioned in the free ForkTrading Group Weekly Outlook.
Next Station, WL4.
P!
Actionreaction

FB - FaceBook at the low?According to the A/R set, FB will rise. A good target could be the GAP-Fill at the Center.

GOOG - Google To The SouthPrice bumped it's head at horizontal center.
From here we will see price heading towards the L-MLH...
It's a far ride down.
P!

How Action/Reaction worksMany weeks ago, I freshly published this chart. I wanted to make a longterm project out of it.
The idea behind this chart is, to show you LIVE how pure Action/Reaction works - and that it's not a mystery, fake or something "balloonie".
Here you have 5! reactions in a relative short period of time. Let's go through them right now:
1 Overshoot and fall back to...
2 ...last magenta A/R line, which provided support.
3 Price drops from prior support down to the next line, but creating, what we at ForkTrading call a confirmed "Hagopian" (you learn about this in my free ForkTrading BLUEPRINT).
4 From 3 price moves up and reacts even three times at the magenta A/R line, bouncing it's head on it, before moving up to the magenta A/R line, just to find resistance and...
5. drops back to the magenta A/R line again where it finds support.
What do you say now?
On my website you find a free subscription to start learning the Basics of ForkTrading, which stems directly from Action/Reaction, but offers much more room for trading then just plain Action/Reaction.
I appreciate you thumb up and would love to have you on board in our ForkTrading Group soon.
P!

NQ - Nasdaq On Action/ReactionYes, I currently have positions on in this market and yes, they perform very well.
If you are interested in learning how to analyze markets instead of predicting markets (...which is NOT possible), then you are welcome to get my free ForkTrading BLUEPRINT Video Course.
Read the footer of this post!
P!

SHORT OPPORTUNITYUJ just brek the support at 105.443, and it has tested the new resistance, now you have to look for selling opportunity, next stop is at 100.250

ES - S&P500 E-Mini With Target Down To The 60'sHere are a lot of lines cooking.
According to the A/R Set (dashed blue), the time seems ripe for a turn to the south, indicated by the yellow down sloping Fork.
In it's way to the yellow Centerline are a couple of natural support lines, like the orange A/R-Centerline, creating a confluence with the pink Trendline.
A break of this dashed orange CL' would indicate a further drop to the L-MLH (orangen). Then from there again one floor deeper, to the white dashed CL'. And if this support is also not holding, then the Rule Nr. 1 applies to the yellow Centerline.
I guess we a nice observation path...
P!

Don't be too hopeful for anything! Hey guys, this is my drawing for Bitcoin. Since I am not really an expert in crypto, my analysis is purely based on using technical without really reading or analyzing fundamental about BTCUSD.
I think this area is kind of 50-50 for trading, so if you already bought BTCUSD at 6k, take 70 - 80% of your profit out of the trade. Just leave 15-20% with stoploss at 7800 to protect your equity.
Bitcoin may go up to 13k-14k to give traders hope, then drops to 5k area. (or 6k is lowest low for the next few months)
Again, as always, trust your analysis and protect your investment. Don't listen to others too much!
Note: Please be advised that this is only my idea, so you are responsible for any losses yourself.

S&P 500 E-Mini - Ouch, that's it...If you followed my blog, then you know this chart. It's about Action/Reaction.
What does it tell us now?
Well, it's telling us, that price missed to crawl above the pink one, instead cracking the magenta reaction once more.
This is a weekly chart. So the week is not over yet, but guess where price is likely to go?
...expect the white R-Line!
P!

SandP 500 E-Mini Futures D CME Updated 2/28/2018Price has com up to hit the back of a sliding parallel, and is showing a bit of weakness. I think that we will see more overall consolidation here at the 2791 area as price is losing momentum.

SandP 500 E-Mini Futures D CME Updated 2/21/2018Price has dropped down as predicted, and now we are at a possible resitance point to the downside. Look to see if price will break down from here. We could see a possible ABCD correction to the downside here with an eventual target near 2425. Look to see what develops in the next few days.

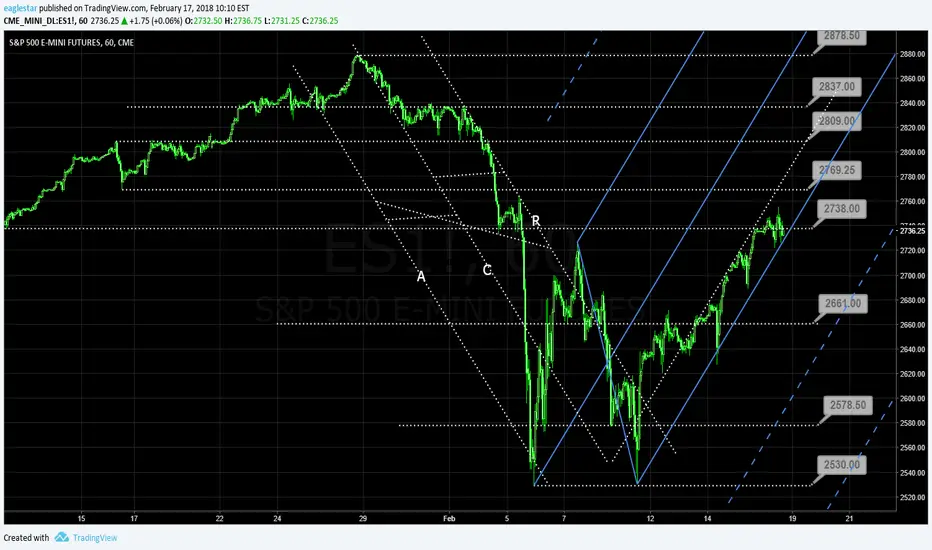
SandP 500 E-Mini Futures 60 CME Updated 2/17/2018Price had formed an action reaction set to the downside as marked, and now we are following the pitchfork to the upside. If price breaks out of this fork to the downside, look for continued downside pressure afterwards.
SandP 500 E-Mini Futures 240 CME Updated 2/17/2018Because of the quick move between A-B, I have created the modified schiff fork to the downside, which is showing good frequency as marked with the arrows to the downside. This could very well be the controlling fork to the downside.

SandP 500 E-Mini Futures D CME Updated 2/17/2018Price has dropped as predicted after hitting the median line. We have bounced off support at 2542 that was marked as a possible support area before. Look for price to hit resistance again shortly at the upper yellow line action reaction going to the downside.

BTCUSD - Above the L-MLH againHere it comes, the rise...
As I said in the weekly outlook on my FTG-Members BLOG (register for free...), you see now price above the L-MLH trying to crawl up.
The brach of the L-MLH last week is a great indication for BTC to rise, since it found support again on a test/retest.
Me ---> Bullish
P!

GOLD - GC With a nice tellAs you can see, there's a huge bar screaming at us.
It broke out of a pressure resistance.
I expect it to pull back, just to scare everyone out of this long opportunity.
My ForkTrading Members got a video today, how I would approach it to stalk a trade.
Subscribe and get the videos I do for my FTG tribe (see footer here on TradingView).
P!

ES E-Mini "Forked" In ContextIn earlier centuries, the crowd would had thrown me on a stake if I where to out myself as a "Fork" Evangelist §8-)
The Chart:
You can see clearly, that price respects the lines of the Fork.
For those of you who already attended my free ForkTrading BLUEPRINT, you guys & gals know what I'm talking about.
I expect a retest of the L-MLH, if not a crack.
The red line, is where I sold Put Options many days ago. I sold them there for a huge credit, because I knew where to expect a pause of price (at the WL1), if a sharp down move steer in my face, which it did.
However, this is exactly the reason why I am able to trade with 100% confidence and why I am able to put these high probability trades on, even it looks scary.
The Andrews Pitchfork, the Model of Action/Reaction and solid risk management give me the freedom in Trading that I always needed many years ago.
We will find out how the story will go on...
P!

RUT - Superb Example With Pitchforks & RusselHagopian = Price missed to reach the "next line". We can expect a pullback farther then from where price came. (check!)
Pirce is at the upper WL1 (Warning-Line 1), the upper Extreme = Price is extended, stretched. We can expect at least a pullback, or even a move to another extreme, the Lower-Medianline-Parallel (L-MLH). (check!)
In over 80% back to CL (Centerline): Price moves back to balance, to the Centerline in over 80% of all occurrences. (check!)
If price breaks the CL (Centerline), or any other Line of the Pitchfork, then we can expect a Test/Retest. ( check!)
What's next?
We have the first Test of the Centerline.
As far as I see, there is no major Swing broken, just pierced! (...remember my Swing/Pivot rules? Watch the stair stepping blue lines below the pivots).
This means, that there ist no confirmation of a turn in trend, even if it seems that the markets are extremely extended up in these price levels here.
Because we can't predict the future, but act on facts, this is what I do:
1. don't let me fool to believe that the trend has turned to the south already. There is no confirmation so fahr, period! (It doesn't mean that it could be the case in the coming days and weeks either, but not now.)
2. If the market lose steam and pulls back a little, I expect a Re-Test of the Centerline.
3. If price moves above the Centerline, then this could be a tell that the Bulls are in control. I would expect another Test of the U-MLH!
So, I sit on my hands and wait until the market is telling me more information.
This is a sneak-peak into the rules and the world of the Pitchforks, and how great they work in step with the ruleset.
If you like to trade with hard written real working rules, then you should check out my ForkTrading BLUEPRINT Mini Crash Course which is free for everybody who wants to learn more in trading and chart analysis.
Check the footer of this post here on TradingView.com
P!

SNAP using Forks the wrong wayIn this chart you see a Fork that seems to work great.
The touches at the lower medianline parallel are perfect...but it's a self-deception if you use the Forks this way!
Don't try to fit the market into your tools, never never!
And why?...because you get faked information, leading to wrong decisions, leading to bad trades and to bad losses.
What you need are the REAL facts.
The real information that your tool is meant to provide you.
Let me show you a real way how to approach this chart with the philosophy of Action/Reraction, the method behind the Forks in my latest TradingView Blog (see link below this post).
Happy new week and as always...learn to earn §8-)
P!

USD - Confulence point reached soonSoon we will see USD at the lower extreme.
Observing how buying in will proceed.
P!

CL - Crude reached it's balance - what now?As we see, price reached the Centerline, which is Rule Nr. 1 on ForkTrading: "Price reach the Centerline over 80% of time".
OK, but what now?
Energies move from balance to extremes.
This means, that price will either drop to the L-MLH, or trade through the Centerline and towards the U-MLH.
Since we don't know what will go on from here, how about to take both sides?
Wait...trading Long AND Short?
Jep!
Follow me on my trading blog (see footer) and see how I'l will plan this.
P!

BTCUSD - Down to the 8s or 7sSo the prior idea did not work and now we probably see why.
With this A/R set we see price frequency at the Centerline.
This looks somehow probable to me.
Because there's no entry here, I just sit on the hands.
I never ever would sell BTC, just because it's going down here. I rather buy more at certain levels.
PP

