ADAUSDT Technical Analysis⏳ Spot
💎 ADAUSDT has formed a symmetrical triangle, The price has got rejected from the bottom of the triangle and the large green candle shows there is a potential that the market can move higher .
🌐 Tradingview
🏁 Short & Medium Term
💵 Invest Only 5% of your Portfolio
🎳 Entry at Market or at 2.000
☕️ TP1 2.444
🍺 TP2 2.900
🍻 TP3 3.500
🍾 TP4 _____
🍷 TP5 _____
🍸 TP6 _____
🍹 TP7 _____
🎁 TP8 _____
🚫 SL 1.900
Good Luck 🎲
Check the Links in Description and If you LIKE this analysis, Please support our page and Ideas by hitting the LIKE 👍 button. ❤️ Your Support is really appreciated! ❤️
Traders, if you have your own opinion about it, please write your own in the comment box. We will be glad for this.
Feel free to request any pair/instrument analysis or ask any questions in the comment section below.
We will have more FREE forecasts in TradingView soon
Have a Profitable Day
ADABTC

ADA CARDANO - Updated Small ChartOur updated Small Chart for ADA CARDANO.
By 'Small Chart' we mean our small time frame charts (15m to 1h candlesticks).
As expected from yesterday , the price appears to be trying to wake up from lethargy (hibernation) and rise again:
Check our analysis today on ADA vs BNB for third place:
ADA already is rising today despite BTC and most cryptos having losses.
Let's Go ADA.
Let us know your thoughts.
One Love,
the FXPROFESSOR

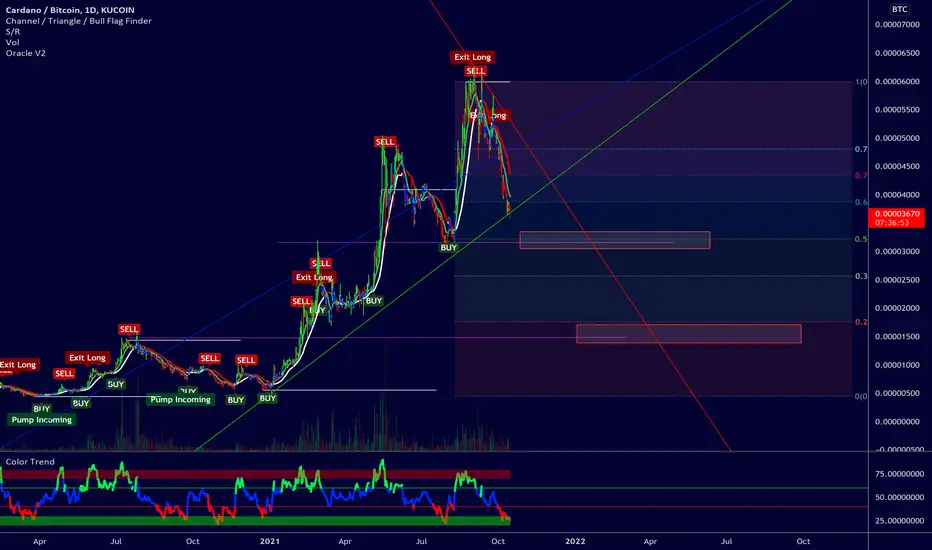
ADA/BTC DailyThis is Cardano's chart to BTC.
- Great macro support line about to be hit which has served as support /resistance on multiple occasions.
- RSI is majorly oversold leading me to believe this is incredibly bullish
- Ties into the ADA/ETH chart where we are about to hit support which makes me more bullish on ADA

ADA will move soon! Keep an eye on thisHere's a quick Look at ADA 6 hr chart. As we can see, the price has been forming a bigger symmetrical triangle and we could see a bigger break to the upside soon - BTC just need to get stable! Definitely one to keep an eye on.
The best entry would be, when the price breaks above the symmetrical triangle with good amount of volume .
-------------------------------------------
The idea is: Buy the breakout from the symmetrical triangle and take profits at the levels shown in the chart.
Targets:
1. 2.3$
2. 2.37$
3. 2.44$
4. 2.57$
-------------------------------------------
What are triangles when it comes to trading?
Key points:
"1. In technical analysis , a triangle is a continuation pattern on a chart that forms a triangle-like shape.
2. Triangles are similar to wedges and pennants and can be either a continuation pattern, if validated, or a powerful reversal pattern, in the event of failure.
3. There are three potential triangle variations that can develop as price action carves out a holding pattern, namely ascending, descending, and symmetrical triangles."
-------------------------------------------
If you like the content, then make sure to comment and like the post :D
Follow me for daily profitable trading setups
BTC dictates the market. If BTC falls, then Alts will fall as well. Trade safe!

ADA broke down the support#ADABTC
#ADA broke down from ascending support line in BTC pair chart. now price face a strong support zone between 0.5 and 0.618 fib of last swing high. also there is divergence between lows of price and RSI. and we can see a long term support in RSI that is near to touch. these reasons may cause a rejection from fib support zone, but it can be just a pull back to broken support around resistance zone or 5000 sats.

ADA/USD - Massive bearish divergence! Be careful!😱ADA has painted a massive bearish divergence on RSI (see yellow arrows). This is bearish, particularly when it happens on weekly timeframe, BTC had the same and it crashed 50% this year...
Moreover, the MACD moving averages just did a bearish cross on weekly as well... last time this happened, it took ADA two months to return on the up-trend...
This is not the time to buy ADA hoping for MOON... this is when you wait. We need clear signals to return and buy ADA. What can those signals be?
First price is in a range between $2 and $2.4... we need to BREAK OUT of this range, above $2.4 to get confidence on any future pump. Secondly, the support at $2 also has to hold, if that falls, then there will be very little hopium left for bulls... as ADA will likely explore lower levels... Right now we seem to exit our descending channel and go sideways, this is good for bulls.
The overall market is bullish, and this can help ADA from a deep correction. Time will tell, but the indicators are clear to me. Bias remains bearish so long we are under $2.4.
Like and follow if you liked this idea!

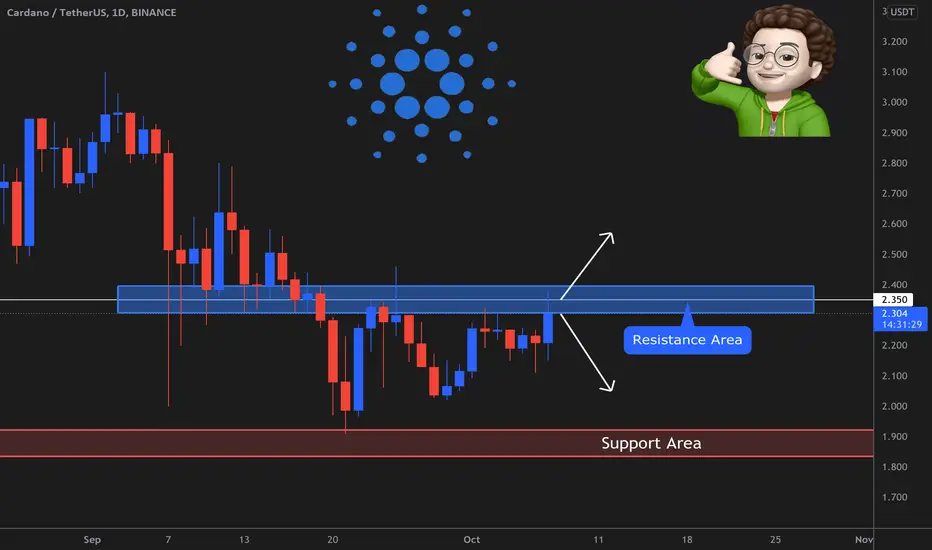
ADA (Update)ADA is forming an ascending triangle on a daily time frame and also trading between the major support and resistance. We will see a breakout in the coming days. Cardano will give a good rally after it breaks the $2.35 resistance. We will see a good rally once Bitcoin stables in a range. What do you think? let's see what happens.

ADA: Fueling Up for Massive Pump ADA is in accumulation frm long time finally its giving triangle breakout on daily timeframe, soon its going to pump hard and achieve all our targets.
dont miss this rally

Cardano (ADA) - October 16Hello?
Welcome, traders.
By "following", you can always get new information quickly.
Please also click "Like".
Have a nice day.
-------------------------------------
(ADAUSD 1W Chart) - Mid-Long-Term Perspective
Above 0.918 point: expected to continue uptrend
Above 1.398 point: Expected to create a new wave.
(1D chart)
Resistance range: 2.486-2.647
First support section: near point 2.005
Second support section: 1.363-1.524
If the price holds above the first support level, it is expected to move upwards along the uptrend line.
A decline from the 1.891 point may touch the second support area, requiring a short-term Stop Loss.
However, it can touch the uptrend line and move up, so you need to think about how to react.
I think the resistance section is an important section that determines the trend.
So, if it rises to the resistance section, you need to check the flow.
------------------------------------------
(ADABTC 1W Chart) - Mid- to long-term perspective
1593 Satoshi - 1944 Satoshi or more: Expected to continue upward trend
2982 Satoshi point and above: Expected to create a new wave.
(1D chart)
Resistance section: 4675 near Satoshi point
Support section: 3251 Satoshi-3607 Satoshi section
I think the most important section is the 2147 Satoshi-2982 Satoshi section.
However, if it falls from the support zone, there is a possibility that it may break out of the uptrend, so a short-term Stop Loss is necessary.
However, if support is confirmed in the 2147 Satoshi-2982 Satoshi section, which I mentioned as the most important section, it is necessary to consider whether it is possible to buy.
------------------------------------------
We recommend that you trade with your average unit price.
This is because, if the price is below your average unit price, whether it is in an uptrend or in a downtrend, there is a high possibility that you will not be able to get a big profit due to the psychological burden.
The center of all trading starts with the average unit price at which you start trading.
If you ignore this, you may be trading in the wrong direction.
Therefore, it is important to find a way to lower the average unit price and adjust the proportion of the investment, ultimately allowing the funds corresponding to the profits to regenerate themselves.
------------------------------------------------------------ -----------------------------------------------------
** All indicators are lagging indicators.
Therefore, it is important to be aware that the indicator moves accordingly as price and volume move.
However, for the sake of convenience, we are talking in reverse for the interpretation of the indicator.
** The MRHAB-O and MRHAB-B indicators used in the chart are indicators of our channel that have not yet been released.
(Because it is not public, you can use this chart without any restrictions by sharing this chart and copying and pasting the indicators.)
** The wRSI_SR indicator is an indicator created by adding settings and options to the existing Stochastic RSI indicator.
Therefore, the interpretation is the same as the traditional Stochastic RSI indicator. (K, D line -> R, S line)
** The OBV indicator was re-created by applying a formula to the DepthHouse Trading indicator, an indicator disclosed by oh92. (Thanks for this.)
** Support or resistance is based on the closing price of the 1D chart.
** All descriptions are for reference only and do not guarantee a profit or loss in investment.
(Short-term Stop Loss can be said to be a point where profit and loss can be preserved or additional entry can be made through split trading. It is a short-term investment perspective.)

ADAUSDT CardanoADAUSDT is making new higher highs which indicates that its continuing its uptrend until a higher low is browken and and alower low is formed according to the DOW theory.

ADA to BTC Longing ideasI am oh so very tempted to take a long on adabtc... however because we are at the start of a potential strong run against BTC then maybe that would not be wise.
I could see a nice bounce off the higher box, but upward growth could be short lived if BTC continues its rally.
Also if BTC 2x in price like many think it will over the next 30-60 days then we could see these rations totally bleed and maybe hit the second lower boxs..which is about a 50% drop from current rates.
Its always hard to tell. I wont place a long till I see a buy signal print and a clear reversal and will make a stop loss so tight you wouldn't believe.
ADA usdt Tecnical AnalysisI stated the target as 1-2-3, but it will not reach these targets. Target 1 might be the entry point.
It's not a coin I like, but it hasn't been in action for a long time.
Assuming it moves within a channel, it also coincides with the Fibonacci levels we predicted.
In this case, the region we specified as Target 1 in the previous chart will work as support. I'm waiting for the price to return from here.
If there is no decline that will invalidate all these assumptions, a bat pattern will emerge. So our selling target will be around 2,400, which is in line with the average 2.618 fibonacci levels.
Considering that it has not been able to start a trend for a long time, I think this target level will be just a start of ignition.
It would be right to make a re-evaluation when we see the main target of 2,400 prices.
Of course, it is inevitable that there will be a pullback at the price of 2,400.
I would like to point out that I have also observed that there are large amounts of money flows to matic and the ada on Money Flow.
Note: This is not investment advice.

ADA is top heavy against bitcoinADA-BTC big picture charts actually allows for up to 90% correction from these levels.
In the short to mid term up to 40% correction is expected. If crypto bear market starts this could be one of the best shorts on the market, it reminds me so heavily of xpr-btc in 2017.
Cardano pumpers are looking to make themselves a fun September, as this month there are some news about platform developments:
finance.yahoo.com
It could turn out to be a sell on news events, watching this with interest.

ADA/USD - Correcting towards support at $1.9, will it hold?Support level: $1.9
Resistance level: $2.4
ADA is in a corrective pattern within a large downtrend channel. Price will likely re-test support at $1.9 before any uptrend will resume. This channel can also be interpreted as a bullish flag, but for that to confirm, we need to break above it and make it support. If that happens our next key resistance is at $2.4.
Indicators:
Volume: Mostly flat and waning. If this continues, the strength of this downtrend will weaken and allow for a reversal once we approach support.
RSI: Falling on daily timeframe, therefore, the short term view is bearish. Wait for a reversal before considering an entry, particularly once we approach support.
MACD: Losing strength on daily timeframe and likely to cross on the negative side in the next day or two. Do not enter a long here so long we’re in the channel.
Bias:
Bearish so long we remain in the channel and we fail to break out of it. On weekly timeframe, ADA just did a bearish cross on MACD. This may indicate we will have a bearish trend for some time, particularly if we break under our $1.9 support. Be cautious on taking any longs for that reason and use tight stop losses. Don’t exclude a bounce towards $2.4 if price breaks above this channel, however once there price can be pushed lower again in line with the weekly MACD which remains bearish.
Price prediction for ADA:
Considering ADA had a massive pump this summer to $3, it now finds itself in a correction. This may last a while, so don’t rush to buy until we have good confirmation of a new up-trend. Breaking above our downtrend channel would be a good start towards that at which point we can set some good targets. Right now $2.4 is your best bet.
Like and follow if you liked this idea!

mADAm Cardano 2Cardano broke up this triangle 📐 and I think there is chance for run to 2.635 and even higher. Setting BUY LIMIT order to catch the pullback. m ADA m, just show us some love!💕
ENTRY : local high @ 2.251
SL : local low @ 2.15
TARGET : height of the triangle projected from midpoint of the local range (BUY STOP-LIMIT - SL) @ 2.635
RRR : 3.8
INVALIDATION : when SL level hit
Please like👍, comment🗣️, follow me✒️, enjoy📺!
Check my other stuff in related ideas.
⚠️Disclaimer: I'm not financial advisor. This is not a financial advice. Do your own due dilingence.

ADA MOVING INSIDE A RISING CHANNELADA on hourly timeframe is moving inside a rising channel with a bullish harmonics.
Targets with resistances levels are marked on the charts, let's see if ADA can break the resistances and move for the top of the rising channel.
The channel is good until broken.
Current ADA Price: $2.249
Thank you and Good Luck.
Make sure to like and follow for more updates :-).

ADA - Daily ChartI guess this is the first time I'm putting a daily chart for short term ADA!
Since you guys asked a lot I'm posting this just to show the key support and resistance zones. And as you know these charts are valid for only 24 hours.
There is only one local support on the way down which is a good one since that support is on top of a famous demand zone:
There is one local resistance which isn't hard to pass, but for having a good pump we need to break the Orange Key Resistance which requires good Buy Volumes and also a healthy market.
In case a sudden breakout happens, that red resistance is where it might stop.
Market is showing Buy Volumes on different platforms so don't open too many short positions.
I'll keep this chart updated.
Use this chart as your trade setup for now.
Current Market Price: $2.274
Good Luck
Tell me your ideas. Like and Share

ada long run to break the all time high ada is good project if you look in its fundamentals . but the project will not always lead the price increase . asa have good future and it will start the run fast . the target and resistance are always marked on chart . any doubt then comment

ADA (Daily Chart Analysis)ADA is again trying to break the resistance. If it breaks and close the daily candle above $2.35 then you can enter in it.
If it rejected again from the resistance then we see downward movement again. Place your buy orders near $2 or wait for a breakout of the resistance.
ADA (Daily Chart Analysis)ADA unable to break the resistance of $2.35 yet and trading below it. If it breaks this resistance and hold above it then we see an upward movement towards $2.7 resistance. The major resistance is $3 area. The support remains the same as of $1.9 - $2 area. Wait for a breakout of resistance or retest of support.

ADA decision time - UP now?Just a quick glance at ADA, looking at some key levels on the USD and the BTC pair, we are in a critical place to pick up momentum and move to the upside in the next few days. On a short term I expect a breakout to the upside in the next hours, if sufficient volume comes.

✅ ADA (Cardano) - What's next? Time to analyze my favorite coin, ADA.
As we said before:
Cardano (ADA) has been going through some corrections as we all expected. right now it's consolidating in the confirmation area, which is the yellow thick line. If it manages to get enough buyers then this confirmation can start a whole new bullish market for this coin.
And I think this might be the time for it because we're in a demand zone and we just need more Buy Volumes in the market.
However, if things don't work out and we see a drop from that point, then our Green Zone, which is our strongest support area can push the price back up in no time.
Update: Watch for Bitcoin, since it looks like it's going to touch ATH or even cross it. After Bitcoin calms down ADA can perform stronger than now and might run for testing the ATH. If possible, it might cross it and touch the red resistance as I've shown on the chart.
if not successful, then it's going back down but I'll update the support when that's about to happen.
Right now I'm seeing strong demand for ADA since it's trying to bounce from this demand zone.
Also, the market is showing Strong Buy volumes for ADA on different platforms.
I'm buying more ADA myself, and if it drops I'll buy even more... I always look at ADA as long time investment and never do future trades on it. If you are trading on it, be careful, because any unadjusted long or short position might cause liquidations since we are not sure if it's going to drop or bounce back up.
I'll keep this chart updated.
Use this chart as your trade setup for now.
Current Market Price: $2.293
Good Luck
Tell me your ideas. Like and Share

ADAUSDT Technical Analysis
⏳ Spot
💎 ADAUSDT has formed a symmetrical triangle. After the breakout it is expected that it goes for a retest and then continues to go higher.
🌐 Tradingview
🏁 Short & Medium Term
💵 Invest Only 5% of your Portfolio
🎳 Entry at 2.250
☕️ TP1 2.450
🍺 TP2 2.570
🍻 TP3 2.700
🍾 TP4 2.950
🍷 TP5 3.300
🍸 TP6 _____
🍹 TP7 _____
🎁 TP8 _____
🚫 SL 2.110
Good Luck 🎲
Check the Links in Description and If you LIKE this analysis, Please support our page and Ideas by hitting the LIKE 👍 button. ❤️ Your Support is really appreciated! ❤️
Traders, if you have your own opinion about it, please write your own in the comment box. We will be glad for this.
Feel free to request any pair/instrument analysis or ask any questions in the comment section below.
We will have more FREE forecasts in TradingView soon
Have a Profitable Day
