-ADA- Looking bullishADA just broke out of a broadening wedge to the upside on the RSI. If it can break through and hold the 200 Ema, expect further upside.
ADABTC

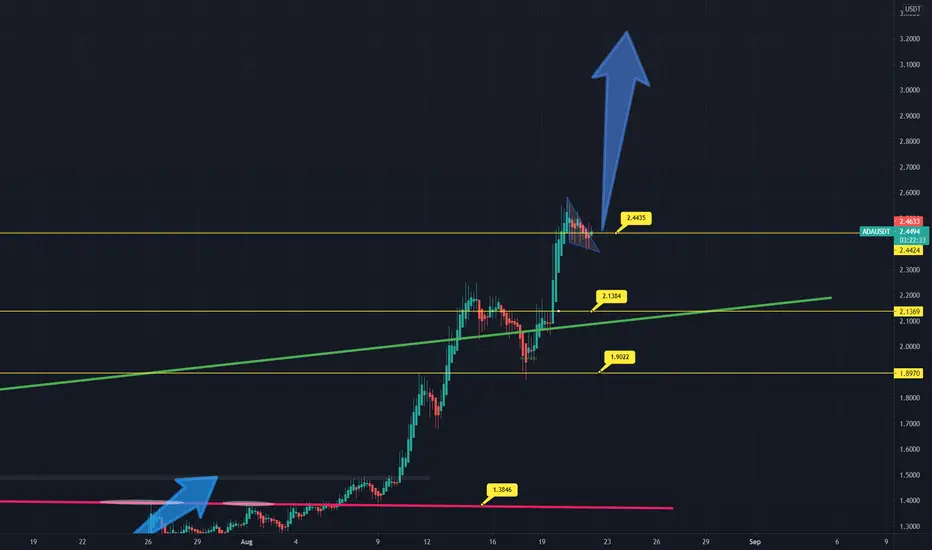
ADAUSDT Technical analysisHello legends and GM,
As you see the chart, #ADA Cardano native token hold the support inside a channel and ascending triangle in multiple times. It's a LONG opportunity for traders and investors before Alonzo hardfork in 12th Sep.
Everything is clear and enjoying with your trading opportunities.

ADA/BTC: OverviewCardano/Bitcoin ratio it's bullish in Daily timeframe. So, in this way Cardano it's continue climbing in front of Bitcoin ratio to reach the 0.00007 BTC or satoshi as you want.
And also, we have in few days to closed up the monthly timeframe. Cardano worth 0.00006 BTC for now!!! But, I believe that in the next month, Cardano will be more higher in this ratio. That it's absolutely so bullish in Cardano
So, if you have 1,000 ADA = 0.06 BTC worth.
If you have 10,000 ADA = 0.60 BTC worth
As I know, I been accumulating Cardano and I hold 13,671 ADA and in my trading account I have 1,982 ADA. I have a sum of 15,663 ADA in hold. Just that I have a some part in my trading app. And my 15,663 ADA i's worth in Bitcoin near of 0.94 BTC. I have in worth 0.94 BTC in my Cardano value. So, it's incredible and I'm so near to get my 1 BTC soon.
So, my goal at the moment it's reach 17,000 ADA step by step. As I have left 1,337 ADA to accumulate in my trading app. I just hold continue holding Cardano.

ADA GO TO MOONADA GO TO MOON
Cardano is a public blockchain platform. It is open-source and decentralized, with consensus achieved using proof of stake. It can facilitate peer-to-peer transactions with its internal cryptocurrency, Ada. Cardano was founded in 2015 by Ethereum co-founder Charles Hoskinson.
TP 1 --- 5 $
TP 2 --- 8 $
TP 3 --- 14 $
MAGIC TARGET --- 23 $


ADA parallel channel or Cup & Handle#ADABTC
ADA is trading inside an ascending parallel channel, also price broke out a long term resistance zone.
In my view price will touch the upper line of parallel channel, then turn back to confirm the resistance zone as support.
after that we will see a great bull run that will increase the price 50% or even 120% .

ADA Buy a break setup.Cardano - Intraday - We look to Buy a break of 2.666 (stop at 2.594)
Pivot resistance is at 2.650.
A break of bespoke resistance at 2.650, and the move higher is already underway.
Daily signals are bullish.
We can see no technical reason for a change of trend.
Our profit targets will be 2.878 and 2.948
Resistance: 2.650 / 2.800 / 2.900
Support: 2.550 / 2.500 / 2.400

🌬️ ADA CARDANO - One Last Push to the 3$ mark🌋Last time we came close (2,95$) but no cigar..
This time we want to see the white smoke coming up from the '3 dollar mountain peak'.
There is mild support to watch out for right now, then off to 3$
Off to 3$ not just to touch but hopefully to break over it!
One Love,
the FXPROFESSOR

Simple technicalA valid channel is formed in a 4-hour time frame. Consistent with the charts of several other coins. What is the logical decision?
Please follow me for support

ADA one more leg up then Crash?Hello IWealth Here, I have been Trading and Teaching for 7 years. and im happy to share my idea that could help you in the crypto space.
------------------------------------------------------------------------------------------------------------------------------------------------------------------------
Ada is currently on support level, There is room I believe for one more upside to around 3.10-3.20$ before breaking down and cooling off for a while. I see strong support around the 1.60-$2.00 range and that I would look to accumulate again. Around 3.10-3.20 I will start de risking and selling some there.

OverextendedAda looks overextended and I have sold. I will look back at it when my alerts go off around the 2 dollar mark or closer to the cloud.
2 weeks until the release gives it time to cool off for a little bit before the dump begins. This may even be the best time to get out before things get too quick.
One thing I've learned over the years is to take my damn profits and to stop being a greedy sob! Ada has made an incredible run if my short fails I've still made great money.
Don't lose by being greedy!

Realistic dubious speculation of 4HR Based on an multi-timeframe analysis of ADAUSD, BTCUSD, ADABTC.
Expecting a pullback to previous support levels in the near future.
If the downside goes to 0.00004859 it might be a good time to bet the family farm tree before the next resitance test. Careful here as the euphoric hype skiiers will prepare for a jump to the upside though looking at the longer timeframes I think this is a false flag and the price will continue downwards. Rest of the chart self-explanatory though it is likely that the road to heaven starts October-November.
I hope I'm wrong and the price trends up always.
Be careful and take care.


Cardano (ADA) - August 24Hello?
Welcome, traders.
By "following", you can always get new information quickly.
Please also click "Like".
Have a nice day.
-------------------------------------
(ADAUSD 1W Chart)
If the price holds above the 0.91799726 point, we expect the uptrend to continue.
If the price is maintained above the 1.31605953-1.39796354 range, it is expected to create a new wave.
(The current price is above the point or zone described above.
Therefore, the point or section described above becomes a Stop Loss point or section from a mid- to long-term investment perspective.
Also, if the price falls and the point described above is supported near the zone, it is a point or zone where you can buy.
I can't keep posting detailed explanations like this, so if you can make an analogy by looking at the posts and charts posted by analysts and guessing backwards, you're a very wealthy trader.)
(1D chart)
We need to see if we can get support by rising above the 2.96779392 point.
If it goes down, we should watch to see if it consolidates on the 2.64691820-2.96779392 section.
If it falls in the 2.48648034-2.64691820 section, there is a possibility that it will fall below the 2.00516676 point, so you should think about how to respond.
If it rises above the 2.96779392 point, it is expected that the direction will be determined again in the section 3.28866965-3.44910751.
-------------------------------------
(ADABTC 1W chart)
If the price is maintained above the 1593 satoshi-1944 satoshi range, it is expected that the upward trend will continue.
If the price is maintained above the 2982 Satoshi point, it is expected to create a new wave.
(1D chart)
It is necessary to check whether support can be obtained in the 5743 Satoshi-6099 Satoshi section.
The 5743 Satoshi-6099 Satoshi section is the section that determines the direction.
If it goes down from the 5743 satoshi point, you should see support in the 4412 satoshi-5049 satoshi range.
If it falls from the previous high section, 4412 Satoshi-5049 Satoshi section, I think it is highly likely to touch the 3251 Satoshi-3607 Satoshi section.
Accordingly, you should think about how to respond.
The 2147 Satoshi-2982 Satoshi section is an important volume profile section.
A decline in this section is expected to turn into a downtrend.
------------------------------------------
We recommend that you trade with your average unit price.
This is because, if the price is below your average unit price, whether it is in an uptrend or in a downtrend, there is a high possibility that you will not be able to get a big profit due to the psychological burden.
The center of all trading starts with the average unit price at which you start trading.
If you ignore this, you may be trading in the wrong direction.
Therefore, it is important to find a way to lower the average unit price and adjust the proportion of the investment, ultimately allowing the funds corresponding to the profits to regenerate themselves.
------------------------------------------------------------ -----------------------------------------------------
** All indicators are lagging indicators.
Therefore, it is important to be aware that the indicator moves accordingly with the movement of price and volume.
However, for the sake of convenience, we are talking in reverse for the interpretation of the indicator.
** The wRSI_SR indicator is an indicator created by adding settings and options to the existing Stochastic RSI indicator.
Therefore, the interpretation is the same as the traditional Stochastic RSI indicator. (K, D line -> R, S line)
** The OBV indicator was re-created by applying a formula to the DepthHouse Trading indicator, an indicator disclosed by oh92. (Thanks for this.)
** See support, resistance, and abbreviation points.
** Support or resistance is based on the closing price of the 1D chart.
** All descriptions are for reference only and do not guarantee a profit or loss in investment.
Explanation of abbreviations displayed in the chart
R: A point or section of resistance that requires a response to preserve profits.
S-L: Stop Loss point or section
S: A point or section where you can buy to make a profit as a support point or section.
(Short-term Stop Loss can be said to be a point where profit and loss can be preserved or additional entry can be made through split trading. It is a short-term investment perspective.)
GAP refers to the difference in prices that occurred when the stock market, CME, and BAKKT exchanges were closed because they are not traded 24 hours a day.
G1 : Closing price when closed
G2: Opening price
(Example) Gap (G1-G2)

ADA - Amazing BreakoutADA has finally started the bullish run we've been waiting for.
Breakout is confirmed and made the ATH area a good local support.
There's strong resistance around $3.5
I don't day trade ADA and I don't think right now is a good idea for opening long or short positions. But if you're holding, keep holding.
Right now all platforms are showing strong buy volumes and high demands.
I'll keep this chart updated.
Use this chart as your trade setup for now.
Current Market Price: $2.95
Good Luck
Tell me your ideas. Like and Share

BTC/USD | ADA/BTC | All-time-high's; Fundamental Analysis As the increase continues, the price of bitcoin (BTC) has climbed to above $50,000. Cardano (ADA) has maintained its record-breaking performance. The $3,500 level is a target for Ethereum (ETH). The cryptocurrency sector has continued to experience increases in recent weeks after adding another $100 billion to its market value over the weekend. In the rise, Bitcoin outperformed Ethereum, while a plethora of alt-coins experienced substantial single-digit gains, extending their recovery from multi-week lows. In the climb, Bitcoin was the only cryptocurrency that outperformed Ethereum. The news that PayPal will introduce a cryptocurrency component to its app, allowing users to trade a few cryptocurrencies, has added to the market's upbeat attitude.
The alt-coin surge has returned, and Bitcoin and Ethereum are on the brink of hitting new multi-week highs. Bitcoin broke over recently tested barrier over the weekend, and the cryptocurrency is now on what seems to be an orderly rise, which is rarely associated with the volatile cryptocurrency industry. The 61.8 percent Fibonacci Retracement is just over $51,100 after that, and the mid-May double-top at about $59,500 is in sight. The 20-day simple moving average is about to cross above the 200-day simple moving average, showing that the market is bullish.
Cardano has kept its position as the third-largest cryptocurrency by market capitalization ($91 billion) and has established a series of new milestones. The absence of technical resistance levels on the charts may make investors to think that the big numbers at $3 and $4 are early resistance levels, but with the current interest in the currency, these levels may become meaningless. Buyers continue to have sway over the market for the time being. Although Ethereum is now testing recent resistance around $3,340, price movement remains positive, with a confirmed breach opening the door to multi-month highs. The ascending channel's barrier is currently around $3,470/$3,480, and if Ethereum can re-enter and respect this channel, it is likely that it will see more gains. The CCI indicator indicates ETH is on the brink of hitting overbought levels, with all three simple moving averages remaining in positive territory.

💥ADABTC💥+38%💥ADABTC💥+38%
Check TP on the top of green area and SL on the bottom of red area.
If you want to use my indicator please contact me.

💥ADABTC💥+38%Check TP on the top of green area and SL on the bottom of red area.
If you want to use my indicator please contact me.

Simplifying ADA | Cardano Analyses This is a long term ta for ADA,
although i dont like ADA as much, also i considered this as a shitcoin but now it has chance to prove me wrong.
ADA has built up extreme bullish momentum and this is because of their news of releasing smart contracts in early september. As of how effective will be their smart contracts, for that we will have to wait but Till the September, I expect it to continue bullish price action, regardless of bitcoin movement.
Cheers 🥂
If you have any doubt or feedback please comment below

When to buy back into Cardano?Cardano has show great strengh in price since 20/21 july. Almost a gain of 148%! I didn't expect such a rise in price tough. Totally missed it cause i was more focused on other crypto's. It seems obvious that Cardano is working hard to strenthen there fundaments of their blockchain platform by making it more future proof.
I understand that a lot of people want to buy in Cardano right now. However i woudn't recommed it for the short term. After every rapid rise of price, their comes a downside. Also Bitcoin has gained these days and is reaching important support levels. I people want to buy Cardano wait for the price to go down and try to enter at a lower price.
In the chart i've highlighted three buy zones. The lower the buy-zone how bigger the chances of a big bounce to the upside will be. The first buy-zone is around $ 1.88. The second buy-zone is arond $1.6 because thats the support of the a previouw tradingrange which lasted almost 6 months... The third buy-zone is arond $ 1 - $ 1.12 which i think should be a no brainer for an entry.
So ... I expect soms downside momentum of Cardano as the price has gained so much already. So a short position would be smarter in my opinion. Also Bitcoin is leaning towards important resistence which could lead to downside momentum for altcoin also. The buyzones indicated in the chart could help by finding a new entry after a retrancement in price of Cardano.

ADA Cardano Price Prediction 2021, Road to $3Using Fib levels & Elliot waves to mark the cluster of price target which is very likely to be achievable by ADA

CARDANO - Ready for another Flight? Our chart indicated that the market remains bullish and it has momentum to go higher even now that Bitcoin has been rejected before the 50k.
As you can see on our chart, the price has exited the descending wedge from North, has now checked the wedge as support and according to FXPROFESSOR's book this is now a signal to Buy again and to Buy more.