ADAUSDTCardano, with the coin symbol $ADA with the present market capitalization is currently the 4th coin on the coinmarketcap. Follow up the thread below for the analysis.
ADABTC

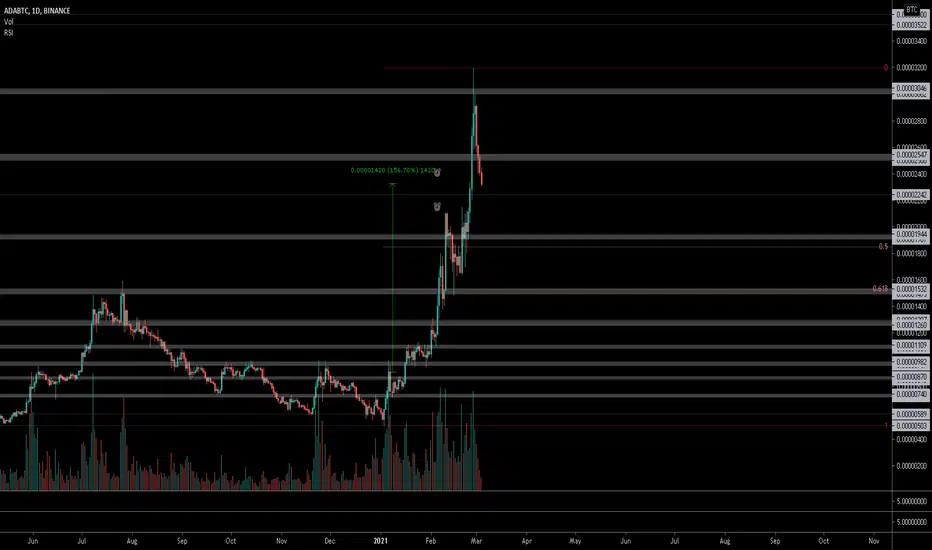
ADA BTC BREAKOUT!!A double bottom has formed for the ADA and BTC trading pair AND it is breaking out of the descending triangle!! Be prepared for a major RALLY!!

ADA still in strong uptrendADA / USDT
price show :
strong uptrend since beginning of february ..
Potenial ascending broadning wedge pattern
Previous resistance turned now support
Bulls should hold daily candles above trendline support or above 21MA and dont close below to keep continue up

$ADA reducing volatility. Time to top up?
Need to break 0.2 and make higher highs
Cardano has over 7X'd this year so be careful with this one with people taking profits.
(+)
MACD oversold
Bollinger bands
Falling volatility
Wedge reversal
(-)
Too much media hype. ADA doesn't need it=Attracts too many people who don't see the long term vision of cardano
Follow on twitter for more setups.

ADA and BTC Pair Very Bullish happeningsAs stated previously, The ADA BTC Pair is in a very bullish pattern. (eg the bull flag) but I found it interesting that both times it dipped to the low side out of the formation it dropped significantly and then was bought back up within a 5 minute time frame both times! This is a very good sign and I'm eager to see this develope further! Good Luck out there everyone!

This ADA run up is SUSS as hell.Don't get me wrong.
My biggest bag is ADA. and I'm very happy its popped off hard. HARD
Very ugly chart. but who cares it makes sense.
So ADA is finishing off a wave 3 out of the 5 wave impulse that is the current bull run.
we are literllay in the final stages for the current run up.
1 more wave up/if that from here and that sohuld be the end for this particular run then we should see a period of pullbacks and corrections.
Suss the Daily RSI. Triple top. that's basically a pullback asking to happen. Triple top RSI jesus christ. don't be hitting the big green.
declining volume on increaseing price? yep thats bearish.
basically don't be buying ADA now. i mean you can. but better off getting it on discount over the next few days/weeks.
Most likely area of support is the place where theres about a million lines there. (basically more lines in an area with different kinds of strategies means stronger support)
previous ATH Monthly open/close around 0.95 to 1.09. This entire region is where the 3D OB (not really an OB coz it doesn't break market structure), 1D OB (again for same reason), Previous monthyl ATH open/close, 0.236 fib retracement. that entire region is support, lots of confluence. I don't like it, but it's what the charts say. If you want us to narrow the levels down it'll fall to either:
- 12h OB - $1.01-$1.08
- 4H OB - $0.88 - $0.98
If that falls (doubt it will) theres no support till 0.30-0.42 region, weekly OB. unlikely it goes there.
Anyways. it should pull back for 1 last time and then begin its final run up. im getting the f out on the next run up xd.
but then again wth do i know?

ADA BTC PAIR THE FUTURE AHEADThis is a concept of what I believe to be ADA/Cardano's trajectory for this bull run! Keep in mind that on the way to these price points there WILL BE MAJOR CORRECTIONS of up to 40-60%!!!!! DONT FORGET IT! BE MENTALLY PREPARED!

ADA and BTC pair WATCH CLOSELYWe have broken out of the descending wedge and have entered a very bullish flag! Watch for continued trading in the support and be prepared for a breakout! Potential for breaks to the lower side are possible but less likely!

POSSIBLE CORRECTION FOR CARDANO THIS MONTH, SHORT TO $1-0.9cCARDANO VERY POSSIBLE $2-3$ THIS YEAR BUT... SHORT TERM, THIS MONTH 0.90 cents !!!

#ADA/USDT breaking out! 45% Potential Profit.#ADA can easily pump from here, all we need is a perfect retest to enter the breakout.
ENTRY: $1.13 to $1.18
Targets:
$1.34
$1.42
$1.52
$1.63
SL : $1.02
DYOR before taking this trade.
I will be posting more setups here.
The response on my last BTC update was decent.
If I get some good response on this one too, I'll post consistent setups here.
Do hit the like button if you like these setups and my other charts.
Stay tuned

ADAUSD breaks downwards trendADA looks to have finally broken the crypto downwards trend. Hopefully, it continues its recovery journey upwards.
--------------
This content is just my personal opinion, does not constitute financial or investment advice, and you should not execute any trade based on it. Please do your own research.

ADA and BTC Pair! BREAKOUT FROM WEDGEAs Predicted in my earlier chart, The descending wedge has been broken to the upside and ADA is highly likely to be at the start of it's next big run! GOOD LUCK AND HAPPY HODLING!

CARDANO (ADAUSDT/ADABTC) Potential Short 2021/03/05Both ADAUSDT and ADABTC are testing the 200MAs, which is currently serving as resistance. Should ADA continue to fall, namely a close below 1.067 for ADAUSDT and a close below 0.00002263 for ADABTC, we could get a short entry.

Cardano set to outperform bitcoin by over 2500%Ada is set to outperform bitcoin by a great margin, bouncing off the 61.8 golden ratio

ADA-BTC. My first sucky chart was right soo... ADA falling wedgeAll my notes are on the chart.
ADA should hit about $0.90-$1 before shooting up faster than a junky with a welfare check.

ADA May Breakout From TrendlineThere is a possible breakout waiting to happen for ADA as it is holding up on this support pretty well and if it breaks the trendline, it could possible go up.
This is just an idea and not financial advice.

$ADA, Looking for a level to show bounce signals $ADA
Unable to hodl/flip ~2500 sats & moving into lower levels (still bullish on the HTFs -- HH-HL sequence intact)
Looking for a level to show bounce signals into a potential reversal (looks great for an entry once that happens)
UCTS 1D Buy still there (~150% up since)
#ADA
ADA: Breaks Descending Triangle on 4HCardano breaks a Descending Triangle -which perfectly touched the bottom 3 times on the 4H- to the downside.
In the case for a short you should already be in a trade since the break of the higher lows at 1.18. If the bulls don't bounce from the 1.10 support, we can go towards 1 psychological and even 90 cents again, which would yield 10% and 20% on the short side unleveraged.
Correlation to Bitcoin is crucial: If Bitcoin keeps falling, Cardano could fall up to 8% more and has the room to do so on the Daily & still bounce from previous support. On the other hand, if Bitcoin bounces from here, Cardano will likely follow.

ADA and BTC LONG GET READYTHE WEDGE IS TIGHTENING!!! STAY ALERT!! SET ALARMS FOR BREAKOUTS! YOU DON'T WANT TO MISS THIS RALLY!

ADA ready for another goAfter a 25% drop, in line with the current market, we could see a further continuation to the upside. I'm expecting a touch of the first support zone. If we then put a stop loss below the second support zone a rally towards the most recent high will give us a nice 3.5 R:R
A strong move could take us to the next resistance at 3840 sats (dating from 04/2018)
Are you bullish or bearish on Cardano?

ADAUSDT (CARDANO) - POTENTIAL BUY ENTRY ANALYSIS 🔎
- ADAUSDT was bounded in the descending triangle pattern.
- Price brokeout above the descending triangle's inclined resistance and retested.
- Price action is printing the inverse head and shoulders pattern.
- This is a bullish reversal pattern.
- There's an uptrend potential.
BUY ENTRY ⬆️
- Breakout above the inverse head and shoulders neckline resistance (R1).
TARGETS 🎯
- Horizontal resistance level (R2).
- Horizontal resistance level (R3).
SETUP INVALIDATION ❌
- Breakdown below the right shoulder support horizontal support level (S1).

Buy ADA. Lose deposit. Greed won't let you close your position.How much more can ADA grow?
If you look at all the previous movements of this asset you may notice, it won't grow 1000 times. Perhaps it will grow by another 60-70%. This idea can't be confirmed by anything, it's just likely.
But the bulk of people are buying this asset now. (if you can call it like that). There is a high probability that these traders may not have a chance to sell theirs ADA coins before the fall.
The nearest support area is $0.37-0.38
Risk/Reward less than 1. (Such a Risk/Reward is called gambling.)

ADA looking to break out of triangle.Looks like ADA could push past 1.50 soon. Once it breaks that previous ATH resistance, we are in new territory.
