ADABTCHello Crypto Lovers,
Mars Signals team wishes you high profits.
This is a 4-hour-time frame analysis for ADABTC
Here we have R1 as our resistance line which includes the disability of the price to rise. S3 used to be a long-term resistance line and S1 and S2 are the support areas. Presently, we have the price fluctuating over S1 and we predict a fall for it down to S2. There we must wait for some rising signs and then another rise is waiting for the price to reach S1 or even higher amounts. In case the price fluctuates over S1, more rise is possible for it. Even we may have more fall for the price when it reaches S2 and its support is lost.
Warning: This is just a suggestion and we do not guarantee profits. We advise you to analyze the chart before opening any positions.
Wish you luck
ADABTC

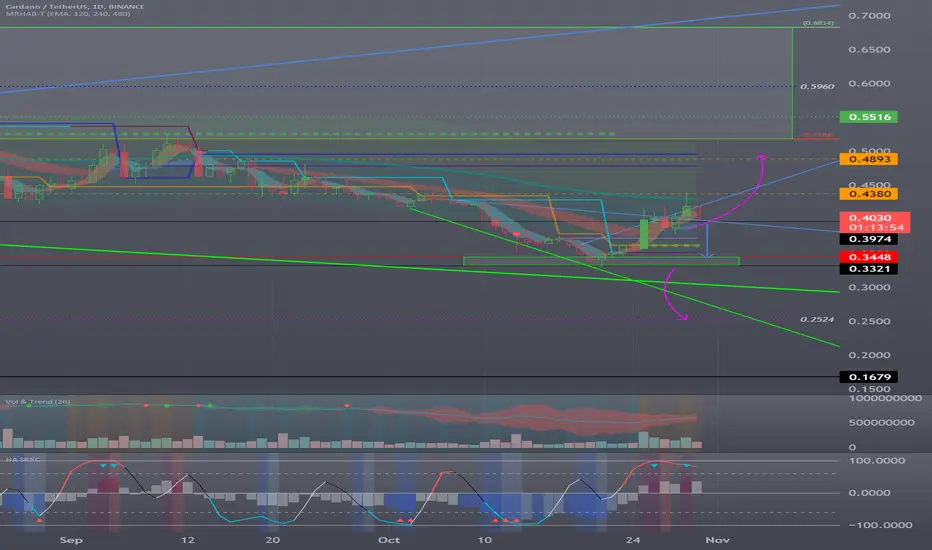
Cardano (ADA) - October 31Hello?
Welcome, traders.
By "following", you can always get new information quickly.
Please also click "Boost".
Have a good day.
-------------------------------------
(ADAUSDT 1W chart)
The key is whether it can rise above the 0.5184-0.6834 section and be supported.
(1D chart)
We need to see support near 0.3974 and see if we can move higher than 0.4380.
This is because the 0.4380 and 0.4893 points are the points where the HA-Low indicator of the 1W chart passes, so if the price is maintained above these points, the uptrend is expected to continue.
However, since the 0.5184-0.6834 section is the section that determines the trend, in fact, it is expected to show a full-fledged upward trend when it rises above this section.
------------------------------------------------------------ -------------------------------------------
** All descriptions are for reference only and do not guarantee a profit or loss in investment.
** If you share this chart, you can use the indicators normally.
** The MRHAB-T indicator contains indicators that indicate support and resistance points.
** SR_R_C indicators are displayed as StochRSI(line), RSI(columns), CCI(bgcolor).
** CCI indicator is expressed as overbought range (CCI > +100) and oversold range (CCI < -100).
(Short-term Stop Loss can be said to be a point where profit and loss can be preserved or additional entry can be made through split trading. It is a short-term investment perspective.)
---------------------------------
ADAusdt 1D Break Important SupportDue to the chart, an important support range is broken down and if it fails to maintain it above the range we will be more likely to fall. The analysis will be updated if the trend line is broken up.
Its not Buy or Sell SIGNAL
DYOR
BY : M.TeriZ - @AtonicShark

Trading opportunity for ADAUSDT CardanoBased on technical factors there is a Long position in :
📊 ADAUSDT Cardano
🔵 Long Now 0.4250
🧯 Stop loss 0.3737
🏹 Target 1 0.4900
🏹 Target 2 0.5400
🏹 Target 3 0.5900
💸RISK : 1%
We hope it is profitable for you ❤️
Please support our activity with your likes👍 and comments📝

The next target of buyers!ADA recorded good price growth during the last week. Cardano's price reacted positively with high trading volume as it hit a good support area at the bottom of the short-term descending channel. I expected a positive reaction from this area. The price has grown up to the midline range of the channel, i.e., the resistance of $0.415-0.430, and after the collision, a negative reaction has been observed due to the bearishness of the overall trend. With the good growth recorded, Cardano's trend in the 4-hour time frame is bullish due to the formation of higher ceilings and floors. Also, the support of the previous ceiling range at the price of $0.38 has prevented the price from falling further.
The point is that due to the strong reaction seen in the first encounter with the $0.415 resistance, there is a possibility that the price will enter a range trend for Cardano. This trend can continue between the specified levels, and in general, as long as the support is held, the resistance is more likely to be broken. If the resistance is broken, the next target for buyers will be in the range of $0.46 to $0.47. This target is near the ceiling of the descending channel, and a stronger reaction can be expected from it.

ADA /USDT#ADA UPDATE.
#ADA is currently trading in ascending triangle with blue box area as the resistance .For upside move ADA needs to close above the blue box however chances of pullback are higher as ADA is trading with bearish divergence.

Cardano's falling triangleI see a neo-wave triangle for Cardano that we are in its last wave. After completing the E wave, it can move down. The characteristics of this triangle are correct from time to time and price.
Comment any question you want
Thank You

ADA : Aiming a 100% profits opportunity in the Mid term.Cardano (ADA) has been on the decline for more than a year now, ever since it reached its all-time high back in September of last year at $3.10. Throughout 2022, the price of ADA has declined by around 80%. More recently, the price of ADA reached as low as $0.33, which was the lowest in 20 months. Nonetheless, despite ADA being bearish and on the decline, ADA has been trending and trading volume has been relatively high, despite the current state of the market.
Following the recent trending nature of ADA, there has been a slight increase in the price in the last few days. ADA increased by 10%, but it is still not enough to suggest a potential reversal in the price of ADA.
Nonetheless, this study goes through the technical and fundamental factors of ADA that could have an impact on the price of ADA for the coming days/weeks.
Technical Analysis
As seen in the ADA/USDT 1-day chart, Cardano is trying to be in favor of bulls but not confirmed yet. Recent price movement suggests that ADA recently found resistance at the lower trendline, meaning that the recent correction was kind of expected. Nonetheless, the price remains bearish from the long term trading perspective and we could expect the price to keep declining in the coming days if the indications fail to fulfill the requirements for a bullish reverse move confirmation.
Indicators
The fear and greed index suggests that there is neutral in the current market, especially for ADA, whose price has been on the decline for more than a year now but showing a good move by the last 48 hours. Though extreme fear in overall crypto market often leads to reversals, that might not be the case in the short run for ADA.
The MACD line of a 1-day chart is currently above the signal line but quite below the baseline. Hence, even though the shorter run momentum is slightly on the bullish end, that could easily change by which our trade needs some strict risk management measures.
The RSI of a 1-day chart was recently below 30 and in the oversold region. This then saw ADA have a slight increase in price in the last few days. Though we could assume that since the RSI is now above 30, the price could keep declining.
The 20-day MA line is currently below the price of ADA, meaning that the trend at least becomes bullish for short term holding for Cardano. This MA line could act as resistance to the price of ADA if the latter attempts an increase. At the same time the scenario is forming on the 9-day MA too.
Fundamental Analysis
Perhaps one reason why Cardano (ADA) has been trending recently is that it was announced that Algorand is now in the Cardano ecosystem. Given the magnitude that Algorand has, it could have a huge impact on the development of Cardano as well. Though it’s essential to point out that as much as Algorand is in Cardano, Cardano is in Algorand, given that the two are interoperable. This comes as a result of the deployment of Milkomeda L2.
Charles Hoskinson, the founder of Cardano, was quick enough to make the announcement on Twitter.
Though Sebastian Guillemot, who is a contributor to both Cardano and Algorand, was also quick enough to correct Hoskinson on the correct way to phrase the announcement.
Community engagement has slightly increased for Cardano as well due to the yearly Cardano Summit that will be held in November. Additionally, Hoskinson recently stated on his Twitter account that something of major significance will be announced in November. No matter what that is, ADA bulls are eagerly waiting for this announcement that could potentially be a pretext for a reversal in the long-term trend. In other news, Cardano is also rumored to soon be listed on FTX. If that happens in the coming months, then it could do wonders to the price of ADA.
ADA Price Prediction
Based on this analysis of Cardano, it is unlikely for ADA to have a sudden surge in price unless we have some huge and powerful community based news prior to the technical analysis study. Currently, ADA may initially face resistance at $0.4148. Assuming the bullish momentum increases soon, then ADA could break this resistance and aim higher. However, as it stands, ADA is likely to keep testing the current resistance depicted by the falling wedge upper side trend line. In such a price surge, to be a healthy move the coin needs some correction and I am expecting a pullback after the current candlestick of the 1D chart closes and if there is going to be any impacting news coming towards the coin including the US stock indices and Bitcoin’s movement we might see a further pullback which is very unlikely at the time of writing this analysis. Though there is strong support at around $0.30, bears may likely continue to have control of ADA.
Takeaways
In the daily timeframe, the price of ADA continues to hold strong and trade above the key Support formed at $0.35 after the price rallied from its daily low, with the current market looking favorable for most crypto assets.
The price of ADA needs to break and hold above 50 EMA, acting as a strong resistance to the price of ADA. The price of $0.4 corresponds to the value of 50 EMA, acting as resistance for the price to break higher to a region of $0.5.
Daily resistance for the ADA price – $0.42.
Daily Support for the ADA price – $0.35.
• Cardano has been trending recently, despite being quite bearish. Now looking bullish for the short term entry but needs some more development to give a confirmation of a long term bullish trend.
• Technical indicators suggest that ADA is unlikely to be bullish any time soon.
• Recent teases by Charles Hoskinson have increased Cardano’s community engagement.
• If support at $0.31 fails, ADA could be heading further down.

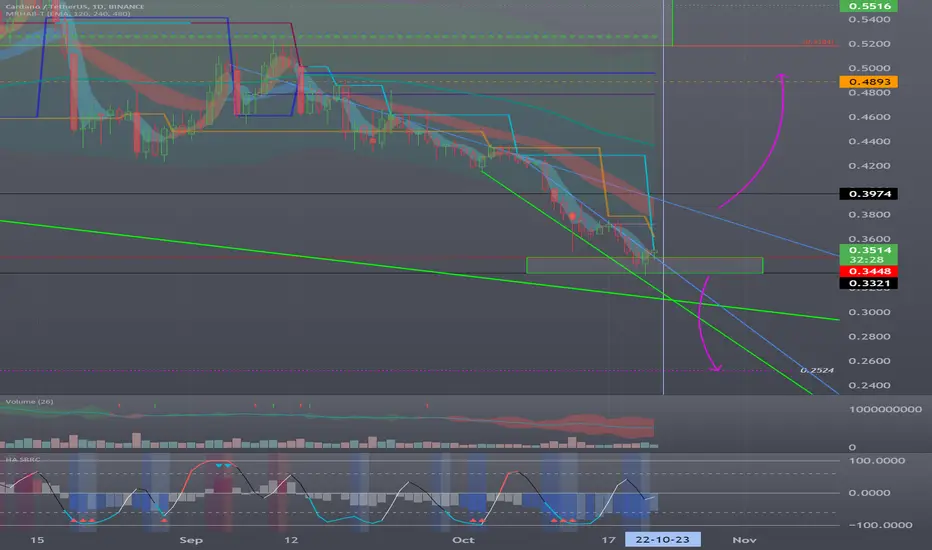
Cardano (ADA) - October 23Hello?
Welcome, traders.
By "following", you can always get new information quickly.
Please also click "Boost".
Have a good day.
-------------------------------------
(ADAUSDT 1W chart)
The key is whether you can climb to the 0.5184-0.6834 section.
(1D chart)
1st resistance: 0.3974
2nd resistance: 0.4893
Support: 0.3321-0.3448
------------------------------------------------------------ -------------------------------------------
** All descriptions are for reference only and do not guarantee a profit or loss in investment.
** If you share this chart, you can use the indicators normally.
** The MRHAB-T indicator contains indicators that indicate support and resistance points.
** SR_R_C indicators are displayed as StochRSI(line), RSI(columns), CCI(bgcolor).
** CCI indicator is expressed as overbought range (CCI > +100) and oversold range (CCI < -100).
(Short-term Stop Loss can be said to be a point where profit and loss can be preserved or additional entry can be made through split trading. It is a short-term investment perspective.)
---------------------------------
ADA - 47% CRASH | Buy here!
I am very bearish on specific altcoins such as ADA, XRP, SOL, LUNC, SHIB and much more. Why? Because the charts are terrible and I don't even know why you should buy these overpriced altcoins that will never make you rich. Some gains are possible, but you have to focus on altcoins with low market caps, not these Giants.
It's too late for the party. I am not saying these altcoins are bad. These coins are great, but the market cap is too high and whales want to buy them at a cheaper price.
Cardano is in a massive downtrend, basically in a free fall mode, and another 47% drop is likely in my opinion. There is pretty much nothing bullish on this chart; the bulls completely disappeared.
You can buy ADA at 0.1841, at least for a short-term bounce (150% - 300% profit). I will inform you about possible targets next year, so do not miss it and follow me!
The price is printing a falling wedge pattern and a descending triangle. As you can see, the bears destroyed the triangle without any problem!
From the Elliott Wave perspective, the market structure is insanely bearish and I expect 2 huge impulse waves downward to complete a major ABC correction.
The bears are in power and I would not play with them at all cost. We need much more time to recover from this abyss.
Look at my ideas about XRP and LUNC in the related section down below.
For more analysis, hit "Like" and "Follow"!

ADA CAN KEEP FALLINGWe have many diameters from large to small. Soon it moved down from the red box.

Trading opportunity for ADAUSDT - CardanoBased on technical factors there is a Long position in :
📊 ADAUSDT Cardano
🔵 Long Now 0.3686
🧯 Stop loss 0.3583
🏹 Target 1 0.3834
🏹 Target 2 0.4010
🏹 Target 3 0.4215
💸RISK : 1%
We hope it is profitable for you ❤️
Please support our activity with your likes👍 and comments📝

ADA/USDT 1 DAY UPDATEHello, welcome to this ADA/USDT 1 DAY chart update by CRYPTOSANDERS.
I have tried my best to bring the best possible outcome to this chart.
Show some support do hit the like button, follow and comment in the comment section. this motivates me to bring this kind of chart analysis on regular basis.
CHART ANALYSIS :
Cardano (ADA)
Cardano suffered a massive breakdown this past week, losing almost 11% of its valuation in the past seven days. On Monday, the key support at $0.43 failed to hold the assault from bears, and ADA quickly tumbled lower. This led to four days of non-stop selling.
Buyers finally managed to stop the downtrend yesterday when ADA found support around $0.35. Considering the latest price action, the cryptocurrency is facing resistance at $0.40 and $0.43, and buyers appear weak. The trend remains firmly in favor of the bears, with the price making lower lows and lower highs.
ADA is the worst performer on our list this week, and the only hope for the bulls is if sellers become exhausted, which could provide this cryptocurrency with an opening to recover some of the losses next week. The indicators on the daily and lower timeframes appear oversold, which could turn out to be bullish.
Sorry for my English it is not my native language.
Hit the like button if you like it and share your charts in the comments section.
Thank you

ADAUSDT 15 % pump (NEW)Recently we have published an idea where we expect ADAUSDT to break the support and drop 40 %.
It looks that the support is still holding and now we expect the price to have a 15 % bounce to get rejected one more time from the downsloping resistance line.
It may be the last bounce before the next leg down as the trend overall remains bearish.
Easy trade to strategize:
Buy at the support,
Sell at the downsloping resistance
Stop loss below the support
Good luck

ADA Head & ShouldersPlease 1st of all click the boost🚀 button if you want me to post more ideas and follow me to support my work! It's absolutely for free.
Cardano broke the yellow uptrendline1, backtested it twice and got hammered🔨. During this plunge it broke the uptrendline2 plus neckline (0.4536) of the Head and Shoulders all in one go. I think there is chance for drop to 0.3835 and even lower, but I expect some pullback up first. Setting SELL LIMIT order to catch the retracement somewhere into the area of uptrendline2 & downtrendline confluence (0.4638).
ENTRY : trendlines confluence @ 0.4638
STOPLOSS (SL) : Right Shoulder @ 0.4905
TARGET (TP) : H&S target projection @ 0.3835
REWARD RISK RATIO (RRR) : 2.9
INVALIDATION : when SL level hit
See Head and Shoulders pattern on BTCUSD:
Check my other stuff in related ideas.
Please boost🚀, comment🗣️, follow me✒️, enjoy📺!
⚠️Disclaimer: I'm not financial advisor. This is not a financial advice. Do your own due dilingence.

ADA/USD - CARDANO IN DANGER. HOLD or DIE 🚨🚨🚨ADA just made a lower low. Moreover, it broke BELOW a key support from May 2018!!!
This spells disaster for the price which could fall all the way to 17 cents!
This would make ADA correct almost 95% which is similar to ETH in 2018...
The chart is extremely bearish and based on this latest price action, ADA seems to have been late to correct by over 90% in this bear market and it's catching up now... FAST.
Plus there is barely any support until 17 cents due to the lack of price action between 39 cents and 17 cents.
Not looking good bro.
I am bearish and best to take cover, it may get ugly.
Like and follow if you liked this idea.

ADAusdt 1D Losing important support?According to the important support that I drew, it is losing this range, if it is unable to return to the trend, the possibility of falling will increase, and if the market returns, I think it will react on the trend line again.
Its not Buy or Sell SIGNAL
DYOR
BY : M.TeriZ - @AtonicShark

Cardano (ADA) - October 11Hello?
Welcome, traders.
By "following", you can always get new information quickly.
Please also click "Boost".
Have a good day.
-------------------------------------
(ADAUSDT 1W chart)
The key is whether you can climb to the 0.5184-0.6834 section.
To do this, we need to see if we can support and rise in the 0.3321-0.3974 zone or higher.
(1D chart)
The key is whether it can find support near 0.3974 and move above 0.4348-0.4482.
Otherwise, it is expected to decline to around 0.3321-0.3448.
------------------------------------------------------------ -------------------------------------------
** All descriptions are for reference only and do not guarantee a profit or loss in investment.
** If you share this chart, you can use the indicators normally.
** The MRHAB-T indicator contains indicators that indicate support and resistance points.
** SR_R_C indicators are displayed as StochRSI(line), RSI(columns), CCI(bgcolor).
** CCI indicator is expressed as overbought range (CCI > +100) and oversold range (CCI < -100).
(Short-term Stop Loss can be said to be a point where profit and loss can be preserved or additional entry can be made through split trading. It is a short-term investment perspective.)
---------------------------------

Has the Cardano ADA bottom already printed?I have been looking at the Cardano chart today and noticed that the longer-term targets would only be met IF Cardano has already bottomed. So, if you're expecting higher prices for ADA, I would consider this a bottom as when you pull the Fibonacci retracement tool from 2017 highs to the lows it gives a 1.618 target which is in a similar realm as to if you pull the Fibonacci retracement from the all-time high to the recent lows. As shown on the chart


ADA/BTC
#ADA/BTC
Exchanges: Binance
Signal Type: Regular (Long)
Amount: 2.0%
💎 Entry Targets:
1) 2138- 2102
Take-Profit Targets:
Target 1: 2231
Target 2: 2291
Target 3: 2340
Target 4: 2389
Target 5: 2430
Target 6: 2472
Target 7: 2546
Target 8: 2587
🚫 Stop loss:
2058

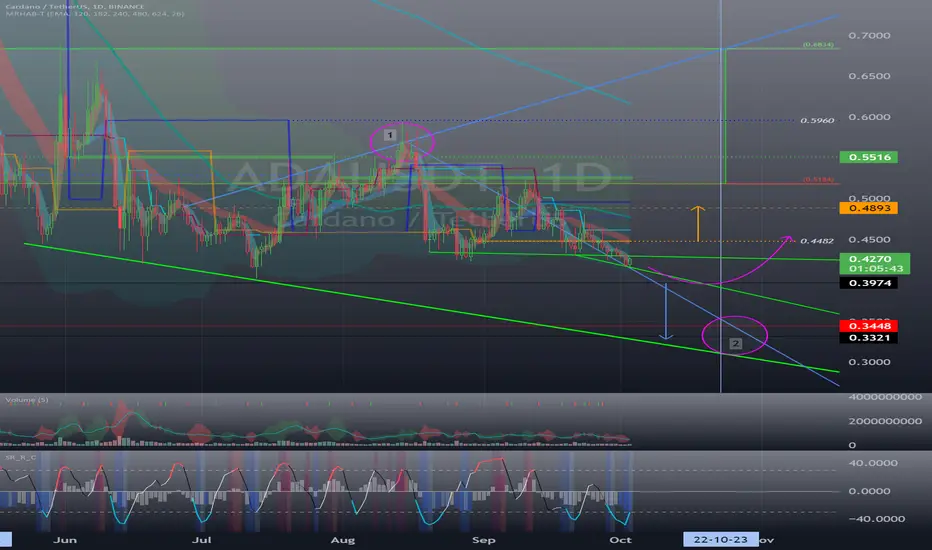
Cardano (ADA) - October 4Hello?
Welcome, traders.
By "following", you can always get new information quickly.
Please also click "Boost".
Have a good day.
-------------------------------------
(ADAUSDT 1W Chart)
The key is whether it can be supported by rising to the 0.5184-0.6834 section.
(1D chart)
It needs to move above 0.4482 to turn into an uptrend.
Otherwise, it is expected to fall below 0.3974.
In the medium-term spread trend, it touched the upper uptrend line and fell.(1)
Therefore, it is likely to touch the lower downtrend line next time (2).
The 0.5184-0.6834 section is a section that determines the trend, so it has a strong role of support and resistance.
Therefore, as you get closer to the 0.5184-0.6834 range, you may feel like you have to buy now.
These thoughts can make you buy at the highs, so be careful.
Therefore, it is recommended to buy after confirming the support in the 0.5184-0.6834 section.
------------------------------------------------------------ -------------------------------------------
** All descriptions are for reference only and do not guarantee a profit or loss in investment.
** If you share this chart, you can use the indicators normally.
** The MRHAB-T indicator contains indicators that indicate support and resistance points.
** SR_R_C indicators are displayed as StochRSI(line), RSI(columns), CCI(bgcolor).
** CCI indicator is expressed as overbought range (CCI > +100) and oversold range (CCI < -100).
(Short-term Stop Loss can be said to be a point where profit and loss can be preserved or additional entry can be made through split trading. It is a short-term investment perspective.)
---------------------------------
ADA/USDT - LONG ----- Welcome, dear followers! -----
- Here is my trading methodology. I trade with a normal system and analysis of resistance and support, as well as price reversal patterns.
- For the record, I do not place a stop loss within my trades. So that I only risk 1.5% of my total capital in order to support the loss due to a price reversal against me.
- If a price reversed against my expectation and touched the drawn line r3, then I transferred targets to the entry point and waited for the price to close at it with a loss equal to almost zero.
- Today's deal is shown in the chart, and here are the entry and exit points below.
-- Support me with numbers and follow up on my account for other deals in the future. Thank you for coming to this part. --
-------------------------------------------------------
⚡️⚡️ ADA/USDT ⚡️⚡️
Exchange: Binance Futures
Trade Type: Breakout (Long)
Leverage: Cross (1.0X)
Entry Orders:
1) 0.4664 - 100.0% (59.6992 USDT) ✅
Take-Profit Orders:
1) 0.4814 - 80.468%
2) 0.4927 - 19.531%
Trailing Configuration:
Stop: Breakeven -
Trigger: Target (1)
