ADAusdt 1H TA; break channel NOWThe upward channel was broken and if it stabilizes above this range, we will see more growth.
Its not Buy or Sell SIGNAL
DYOR
BY : Mohamad Teriz - @AtonicShark
ADABTC

BITCOIN 2H TA; Resistance ZonesAccording to the chart, the triangle pattern has broken upwards and there are important resistance ranges ahead. In case of reaction on these ranges, I have specified the possible scenarios on the chart.
Its not Buy or Sell SIGNAL
DYOR
BY : Mohamad Teriz - @AtonicShark

Trading opportunity for ADAUSDT - CardanoBased on technical factors there is a Long position in :
📊 ADAUSDT Cardano
🔵 Long Now 0.5192
🧯 Stop loss 0.5080
🏹 Target 1 0.5330
🏹 Target 2 0.5555
💸Capital : 1%
We hope it is profitable for you ❤️
Please support our activity with your likes👍 and comments📝

BITCOIN break the Channel NOW In the previous analysis of Bitcoin, we mentioned the downward channel, but now this channel has broken upwards, and if the pullback is completed, we have the possibility of the price increasing to resistance levels, otherwise it will return to the downward channel.
Its not Buy or Sell SIGNAL
DYOR
BY : Mohamad Teriz - @AtonicShark

ADAUSDT 1H TA; Can break trendline?Given the chart on the PRZ range, we are resisting that if it can break the process and resistance up, the uptrend will begin, otherwise we will modify to the specified areas in the chart. I specified the possible scenarios
Its not Buy or Sell SIGNAL
DYOR
BY : Mohamad Teriz - @AtonicShark

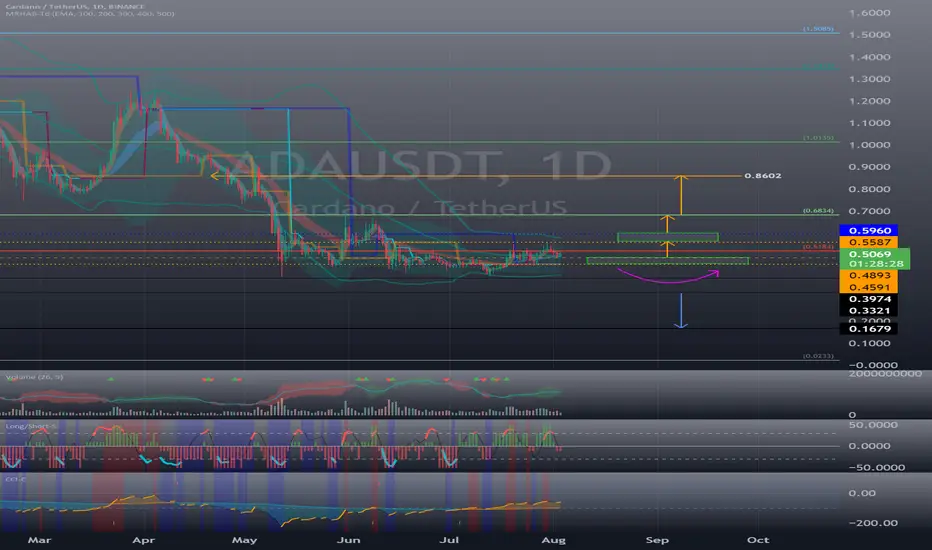
Cardano (ADA) - August 4Hello?
Welcome, traders.
By "following", you can always get new information quickly.
Please also click "Like".
Have a good day.
-------------------------------------
(ADAUSDT 1M Chart)
The key is whether it can be supported by rising to the 0.5184-0.6834 section.
(1W chart)
The key is whether it can find support near 0.4893 and move above 0.5184.
If it falls below the 0.3321-0.3974 range, it is likely to enter the long-term investment zone.
If the price is maintained above 0.6834, it is expected to continue the upward trend from a mid- to long-term perspective.
(1D chart)
Primary resistance: 0.5587-0.5960
Secondary resistance: 0.6834
1st support: 0.4591-0.4893
Second support: 0.3321-0.3974
You should see support above the 0.4591-0.4893 zone and see if it can move above 0.5184.
The 0.5184-0.6834 interval is the interval that determines the trend.
Therefore, if it is not supported in the 0.5184-0.6834 section and falls below 0.4591 and becomes resistance, a Stop Loss is required to secure cash.
However, since you can touch the 0.3321-0.3974 section and climb, you should also think about countermeasures.
------------------------------------------------------------ -------------------------------------------
** All descriptions are for reference only and do not guarantee a profit or loss in investment.
** The MRHAB-T indicator, which is inactive on the chart, contains indicators that indicate support and resistance points.
** Background color of Long/Short-S indicator: RSI oversold and overbought sections
** Background color of CCI-C indicator: When the short-term CCI line is below -100 and above +100, oversold and overbought sections are displayed.
** The OBV indicator was re-created by applying a formula to the DepthHouse Trading indicator, an indicator disclosed by oh92. (Thanks for this.)
(Short-term Stop Loss can be said to be a point where profit and loss can be preserved or additional entry through split trading. It is a short-term investment perspective.)
---------------------------------
BITCOIN break the line NOW
Break the line now and if success pullback can bullish again
Its not Buy or Sell SIGNAL
DYOR
BY : Mohamad Teriz - @AtonicShark

Cardano (ADA) 1DAY UPDATE !!Hello dear traders, we here new so we ask you to support our ideas with your LIKE and COMMENT, also be free to ask any question in the comments, and we will try to answer for all, thank you, guys.
ADA/USDT UPDATE :-
The support at $0.43 has held well and could be the push ADA needed to break the key resistance, which would then allow the price to rally all the way to $0.66, the next target should $0.55 fall. The indicators give a bullish bias, and the current volume favors bulls.
Looking ahead, expect to see ADA attempt a breakout from $0.55, which could embolden bulls to go straight to $0.66 next. Success there would mean Cardano can finally fully exit the flat trend established back in May. This would be extremely bullish if it happens.
Remember:-This is not a piece of financial advice. All investment made by me is at my own risk and I am held responsible for my own profit and losses. So, do your own research before investing in this trade.
Sorry for my English it is not my native language.
Do hit the like button if you like it and share your charts in the comments section.
Thank you.

BITCOIN 1H TA; updateWith the one-hour time frame, Bitcoin has left the upward trend and formed valleys lower than the previous valleys. Now Bitcoin is in the support range of the trend line and static support, which requires the price to reach above $23,000 to change the trend.
Its not Buy or Sell SIGNAL
DYOR
BY : Mohamad Teriz - @AtonicShark

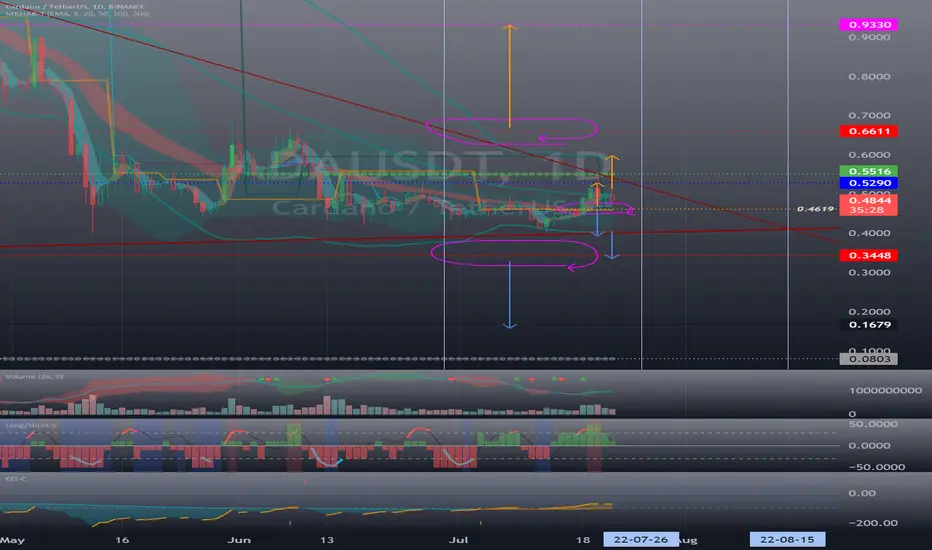
Cardano (ADA) - July 23Hello?
Welcome, traders.
If you "follow", you can always get new information quickly.
Please also click "Like".
Have a good day.
-------------------------------------
(ADAUSDT 1W chart)
Whether or not it can move higher than 0.6611 is key.
(1D chart)
The key is whether it can find support near 0.4619 and move above 0.5290.
A move above 0.5290 is likely to break out of the downtrend line and lead to further upside.
A move below the 0.3448 point or near the uptrend line could lead to further declines, so trade cautiously.
------------------------------------------------------------ -------------------------------------------
** All indicators are lagging indicators.
Therefore, it is important to be aware that the indicator moves accordingly with the movement of price and volume.
However, for the sake of convenience, we are talking in reverse for the interpretation of the indicator.
** The MRHAB-T indicator used in the chart is an indicator of our channel that has not been released yet.
** The OBV indicator was re-created by applying a formula to the DepthHouse Trading indicator, an indicator disclosed by oh92. (Thanks for this.)
** Support or resistance is based on the closing price of the 1D chart.
** All descriptions are for reference only and do not guarantee a profit or loss in investment.
(Short-term Stop Loss can be said to be a point where profit and loss can be preserved or additional entry can be made through split trading. It is a short-term investment perspective.)
---------------------------------
ADAUSDT - Stop Hunt with Wyckoff Method📉📈Hi Traders, Investors and Speculators
Ev here. Been trading crypto since 2017 and later got into stocks. I have 3 board exams on financial markets and studied economics from a top tier university for a year.
A quick look at Cardano / ADAUSD / ADAUSDT . I believe that we are currently in the market cycle of accumulation , according to the Wyckoff Method market phases. The four phases of the market cycle are accumulation, markup, distribution, and markdown.
During the accumulation phase, a new cycle begins that generates a trading range. The pattern often creates a strong resistance zone / failure point / spring . This is the precursor to another bull cycle, but it can last an extended period of time. The final moments of this phase will attract algorithm trading driven stop hunting , often observed near downtrend lows, where price drops just underneath key support and then triggers a sell-off. This is followed by a recovery wave that lifts the price back above support.
So - What Is Stop Hunt ?
Stop hunting is a strategy that attempts to force traders out of their positions by driving the price of an asset to a level where many people have chosen to set stop-loss orders. The triggering of many stop losses at once typically creates high volatility and this is often very obvious during the accumulation phase of the Wyckoff Method.
If we take all of the above into consideration, the price of Cardano can still drop and fall within a range multiple times until a clear bottom is established and the next markup phase / bull cycle starts. In the video above, I take a look at possible bounce zones and a target for the SOS ( sign of strength, a price advance on increasing spread and relatively higher volume ). I have also highlighted the next phase of the accumulation cycle, the BU (back-up). At this point, short-term profit-taking occurs and a test for additional supply around the area of resistance. A back-up is a common structural element preceding a more substantial price mark-up (SOS) .
Here, I did an analysis on Bitcoin / BTCUSD / BTCUSDT using the Wyckoff Method:
Related news Highlights in Crypto :
📢Elon Musk claims crypto is not contributing to an environmentally sustainable future, also says that Tesla has not sold any of its Dogecoin holdings and he will be open to increase Bitcoin holdings again after recently selling 75% of Tesla's btc holdings
📢 Jed Mccaleb closes his infamous “tacostand” XRPUSDT account
📢UK Finance Minister announces that a bill for stablecoins will be introduced this week
📢Crypto exchange Bitstamp will charge inactive users a monthly fee of $10.20
📢XRP flips BUSD and becomes worlds 6th largest crypto by market cap
📢US Senator Cynthia Lummis says crypto regulation bill will only be considered in 2023
_________________
👀Follow us here on TradingView for daily updates and trade ideas on crypto , stocks and commodities 📉
Hit like & Follow 🔔
We thank you for your support !
CryptoCheck


Trading opportunity for ADAUSDT - CardanoBased on technical factors there is a long position in :
📊 ADAUSDT Cardano
🔵 Long Now 0.4387
🧯 Stop loss 0.4130
🏹 Target 1 0.4800
🏹 Target 2 0.5200
💸Capital : 1%
We hope it is profitable for you ❤️
Please support our activity with your likes👍 and comments📝

ADA ( Another drop ? )ADA / USDT
Cardano is one of big cap coins ,and looks like it will break support soon
As you can see there are more and more retests for the support which make it weaker over time
A stability below support mentioned in my chart will confirm the drop and more potential blood in coming days
Invalidation:
A breakout of 50D MA with strong volume will invalidate the bearish scenario
What do you think about ADA ? share with us

BITCOIN & Breaking TrendLine NowBitcoin, as we mentioned earlier, is unable to defeat the resistance of $ 5 and is currently breaking down the uptrend line, and if the money is completed, we will have more falls to the specified support ranges in the chart.
If the analysis process is returned, the analysis process will be updated.
Its not Buy or Sell SIGNAL
DYOR
BY : Mohamad Teriz - @AtonicShark

ADAUSDT Future & Next 2-3 MonthADA
I like it!
It's very interesting one
After the large current correction it will pump to 3$ becouse of hard
fundamental background
Best wishes, guys!

Cardano (ADA) - July 7Hello?
Nice to meet you, traders.
Follow us and you'll always get new information quickly.
Please click "Like".
Have a great day today.
-------------------------------------
(ADAUSDT 1M Chart)
Below 0.6611 is likely to be a mid- to long-term investment area.
Therefore, it is important whether it can rise above 0.6611 or not.
(1W chart)
It is necessary to ensure that it is supported at 0.3448 or above and that it moves along the upward trend line.
If it rises above 0.6611 and is supported, it is expected to continue the upward trend from a mid- to long-term perspective.
(1D Chart)
We need to check if it can be supported by 0.4619 or higher and increase by 0.5187 or higher.
---------------------------------------------------------------------------------------------
** All indicators are retrograde indicators.
So, it's important to know that the indicators move along with the price and volume of the transaction.
However, for convenience, I'm talking upside down for interpretation of the indicators.
** The MRHAB-T indicator used in the chart is an indicator of our channel that has not been released yet.
** The OBV index was re-created by applying the formula to the Depth House Trading index released by Oh92. (Thank you.)
** Support or resistance is the closing price of the 1D chart.
** All explanations are for reference only and do not guarantee gains or losses in the investment.
(Short-term Stop Loss is a point where profit or loss can be preserved or additionally entered as a split transaction. It's a short-term investment perspective.)
---------------------------------

ADAUSDT 6H TA: Important SupportWe are in an important support area where we expect buyers to support us again. If this range is supported and the upward trend line is broken, we expect the price to increase to the specified points, and if the important support range is broken downwards, the analysis will be updated.
Its not Buy or Sell SIGNAL
DYOR
BY : Mohamad Teriz - @AtonicShark


ADALooks pretty bottomed IMO. They have successfully completed the Hard Fork end of June. And the markets have been selling ADA off since Aug 2021. I think i's time to finally rug some bears


CARDANO looking fro a jump!!price has been consolidating between 0.44$ to 0.52$ for a while now. today 0.47 looks like a good spot foa long.
NFA
please like and share this idea.

Cardano's Desending Wedge Setup, will it shrug off macro woes?Will the major Altcoins particularly ADA, LINK and UNI breakout of their descending wedge setups. Is this prominent technical setup, the signal for a breakout to the upside?
Or will continuing macro woes, make the TA analysis null and void. Equity Markets might be seeing a bear market bounce, this could relieve downward pressure on risk assets? Allowing the potential for a significant bounce in the major cryptocurrencies.
A potential bounce could see a 50-100% upside for major Altcoins that are down over >75% from all time highs. With Bitcoin and Equity index spurred by the strong support at the 200 daily moving average.
Time to wait and see.
