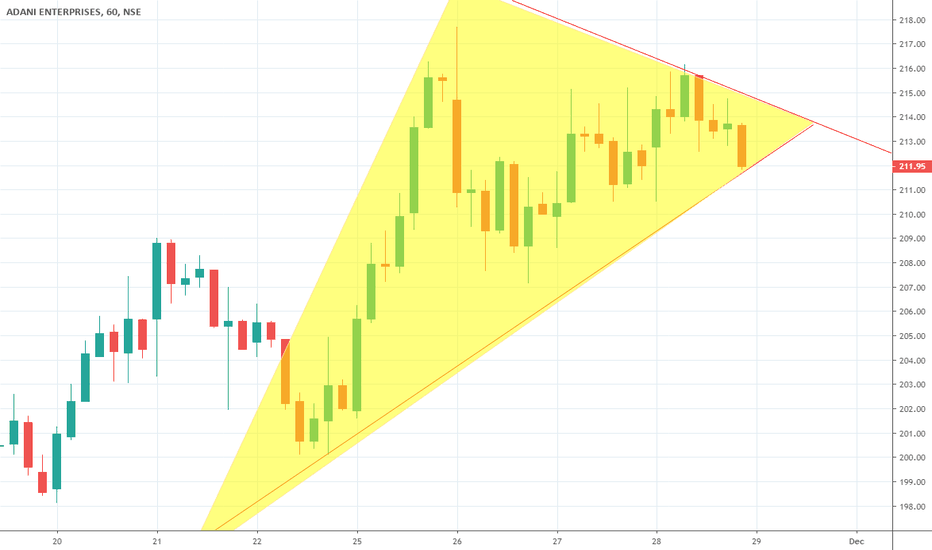
Adani ENT Possible Short AdaniEnt is in strong uptrend. We have seen almost 30% move last week when it broke out from 1350 towards 1700.
At this point, there are no signs of bearishness on any timeframes. However, I see a harmonic pattern and I am explaining it below. Pl note that this is a monthly chart on the log scale.
Harmonic inherently does not support log scale therefore we have to manually project X-A, ABC Leg and B to C leg and look for major FIB Levels. FIB retracement and Trend based FIB extension tool on trading view supports FIB levels based on the log scale. I have mentioned levels in the chart only and therefore I am not repeating it here.
Additionally, I have used pitchfork took. Pitchfork is used to project long term price cycles based on the trendlines drawn from FIB levels and identify swings. There are variations of the tool namely standard pitchfork (aka Andrew Pitchfork), modified pitchfork etc. For this, I have used standard pitchfork tool. Explaining the pitchfork in the idea not recommended but you can find relevant materials on Investopedia and YouTube. Pl see that 0.618 FIB line on the pitchfork acts as a resistance. I am not using it regularly but I do know about its usefulness and limitations.
Again these are all possible zones from where we can see swing high formation and should see a correction but that does not mean we short it immediately. Let Price action show a bearishness with RSI weakness. negative divergence or some sort of bearish candlestick patterns. We will need to carefully wait and see how price structure develops from here and take a call accordingly. But Again, these are just possible zones from where market may reverse but nothing guaranteed.
ADANIENT
#ADANITRANS $ADANITRANS Watch for breakdown SELL Recommended#ADANITRANS
CMP: 1439.80
SHORT
Target 1167
NSE:ADANITRANS
Head and Shoulder Pattern
IMPULSE RETEST
Bearish Move
Break down
Peers: ALL SHORTING
NSE:ADANIENT
NSE:ADANITRANS
NSE:ATGL
If you like my work, KINDLY LIKE, SHARE, & FOLLOW THIS PAGE for the latest stock recommendations for free.
Super bearish on this stock!
From Rachit Sethia with 💚
#ADANIENT $ADANIENT Watch for breakdown SHORT / SELL 1170 target#ADANIENT
CMP: 1325.80
SHORT
Target 1170
NSE:ADANIENT
Head and Shoulder Pattern
Bearish Move
Break down
Peers: ALL SHORTING
NSE:ADANIENT
NSE:ADANITRANS
NSE:ATGL
If you like my work, KINDLY LIKE, SHARE, & FOLLOW THIS PAGE for the latest stock recommendations for free.
Super bearish on this stock!
From Rachit Sethia with 💚
#ATGL $ATGL #Adani watch for breakdown SHORT/SELL#ATGL
CMP: 1354
SHORT
Target 993
NSE:ATGL
Head and Shoulder Pattern
Bearish Move
Break down
Peers: ALL SHORTING
NSE:ADANIENT
NSE:ADANITRANS
NSE:ATGL
If you like my work, KINDLY LIKE, SHARE, & FOLLOW THIS PAGE for the latest stock recommendations for free.
Super bearish on this stock!
From Rachit Sethia with 💚
Demand May Be Exhausted in Adani Enterprises (ADANIENT)NSE:ADANIENT
Adani enterprises on daily chart indicating exhaustion of demand.
As prices moving higher price ranges are getting shorter and volume is increasing. This may be a indication of less demand and supply on the verge of overtaking whatever demand left in this counter.
Swing and short term trader must be cautious now any closing below 1210 may take this counter towards 1050 .
This view will become invalid if we see good strong closing above 1350.
Thank!!!!!
|| Hari Om ||
ADANIENT LONG INTRADAY 27 APR, 2021Dear trader,
If u look at the chart of ADANIENT (analysis based intraday only) the ADANIENT Buy at 1207 and Target at 1230
Best Buy at 1200.
Our Best Buy is based on high quality research and when the instrument reaches this level , it’s a jackpot trade.
Best Buy level might be executed or might not be executed.
The chart clearly indicates Bullish Trend you can also see the candle stick patters for more indepth analysis.
In Intraday most important thing is to enter and exit points.
Our signals are based on analytics, algorithms, mathematical derivatives.
Always be a responsible trader, kindly trade only when you have maximum opportunity in the market with minimum risk and with keynotes like data, analysis and proper strategies.
Kindly message us for strategies and analysis.
ADANIENT LONG INTRADAY 6 APR,2021Dear trader,
If u look at the chart of ADANIENT (analysis based intraday only) the ADANIENT support at 1168 and Target at 1180 and Stop loss at 1150.
The chart clearly indicates Bullish Trend you can also see the candle stick patters for more indepth analysis.
In Intraday most important thing is to enter and exit points.
Our signals are based on analytics, algorithms, mathematical derivatives.
Always be a responsible trader, kindly trade only when you have maximum opportunity in the market with minimum risk and with keynotes like data, analysis and proper strategies.
Kindly message us for strategies and analysis.
Adani Enterprises - Fuelling the Growth of the Indian Economy.Just having a look at what stocks are running well on the global market and Adani has been consistently putting in higher highs over the last 12 months. Up over 700% and just breaking through that $1,000 INR price point after a pull back as a business firmly entrenched in the infrastructure and energy sectors they are well worth keeping an eye on.
ADANIENT LONG INTRADAY 12 MAR, 2021Dear trader,
If u look at the chart of ADANIENT (analysis based intraday only) the ADANIENT support 1 at 923 and resistance at 935.
The chart clearly indicates Bullish Trend you can also see the candle stick patters for more indepth analysis. You can also channel patterns.
In Intraday most important thing is to enter and exit points.
Our signals are based on analytics, algorithms, mathematical derivatives.
Always be a responsible trader, kindly trade only when you have maximum opportunity in the market with minimum risk and with keynotes like data, analysis and proper strategies.
Kindly message us for strategies and analysis.


