ADA Follows the trend. Key resistance $0.43 - 0.45ADA Follows the trend. Key resistance $0.43 - 0.45
At this moment I see no ideas to enter
Adausd

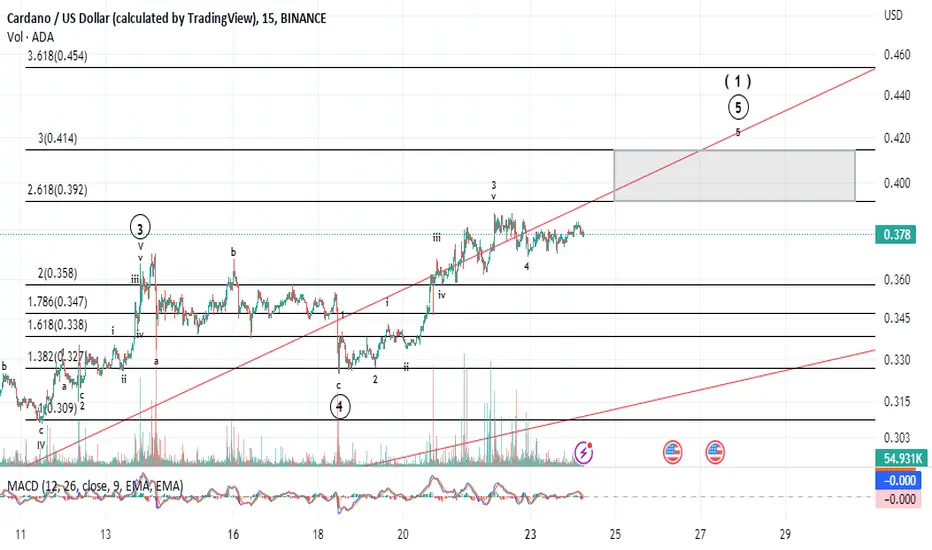
ADAUSDT Weekly View - February 2023Hello Guys, Weekly Analysis is on the ADAUSDT Symbol in 4H Time frame, I Hope it Will be Useful for You, Don't Forget to Like, Follow, Comment

Drawing supply and demand areas and possible scenarioDrawing supply and demand areas and possible scenario

Is it possible to start a move to continue the upward trend...Hello?
Traders, welcome.
If you "Follow", you can always get new information quickly.
Please also click "Boost".
Have a nice day.
-------------------------------------
(ADABTC 1W chart)
The question is whether it can move above the 0.0000 1641 to 0.0000 1786 and break out of the downtrend line.
-------------------------------------
----------------------------------------
(ADAUSDT 1W Chart)
It is necessary to check whether there is a movement of shaking up and down based on the 0.3448 point.
(1D chart)
The question is whether it can sustain the price above 0.3819 and rise above 0.4380.
If not,
1st: 0.3306-0.3448
2nd: 0.2772-0.3032
You need to make sure that it is supported in the 1st and 2nd.
-------------------------------------------------- -------------------------------------------
** All descriptions are for reference only and do not guarantee profit or loss in investment.
** If this chart is shared, you can use the indicators normally.
** The MRHAB-T indicator includes indicators that indicate points of support and resistance.
** Check the formulas for the MS-Signal, HA-Low, and HA-High indicators at ().
(Short-term Stop Loss can be said to be a point where profit or loss can be preserved or additional entry can be made by split trading. This is a short-term investment perspective.)
---------------------------------


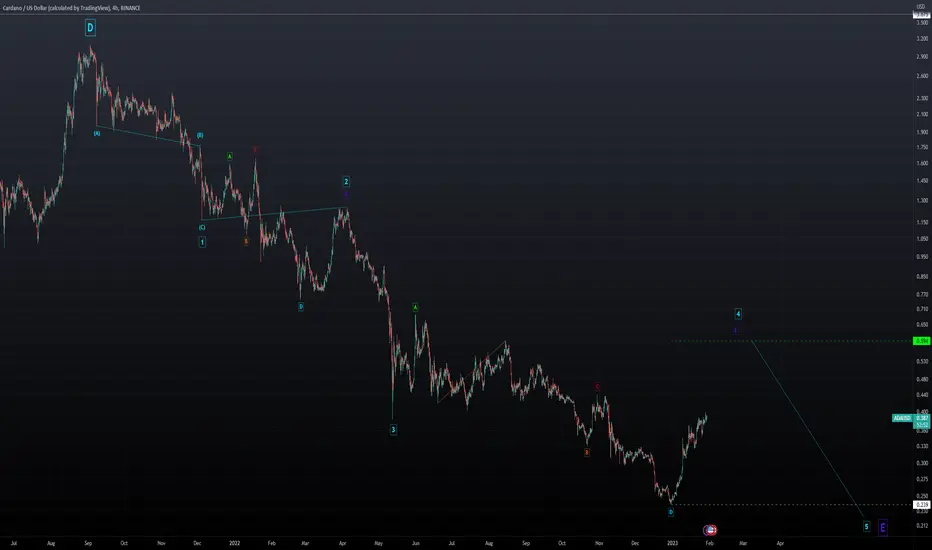
AW Cardano Analysis - Making Sense of This Deep Wave E...It's kind of hard to look at this Wave E as a weak 5-Wave because of its depth however I believe it's the only way to look at this.
Of course, this is based on my recently updated view for the EURUSD, AUDUSD, Dow Jones, and ASX.
We are looking for the last move down in Wave 5 across the board and Cardano is no different.
After this move down, I see a large 5-Wave move to the upside that will extend well beyond all-time-highs.
I expect Wave E of Wave 4 to not exceed the .59 cent level before the move lower.
This does not mean that it will reach that level, it's just a guide to max length potential.
Remember to use Disciplined Money Management Principles to ensure longevity as a trader.
If you don't know the long term pattern shouldn't you be doing your research instead of just following the crowd?
Just remember: I am not a financial adviser; I suggest using this only as a guide. Always do your own research.
***AriasWave is not the same as Elliott Wave so your counts may differ to mine if you happen to use it.***
ADAUSD CARDANOCrypto ADAUSD is trading in the channel from the last 250 days We can see a good movementum when it breaks this channel

Cardano to 2xBreakout of major resistance from before 2022. No major resistance now.
Fib levels match precisely.

Cardano is approaching strong ceilingCardano also had a nice run at the beginning of the year and after breaking above the falling wedge's resistance, the coin gained around 50%.
From my point of view, Ada is one of the weakest major coins and a rise to the strong resistance above 0.4 should be considered a good selling opportunity with and 1:3 R:R (at least)

Cardano Fibonacci target 0.4271Hey trader!
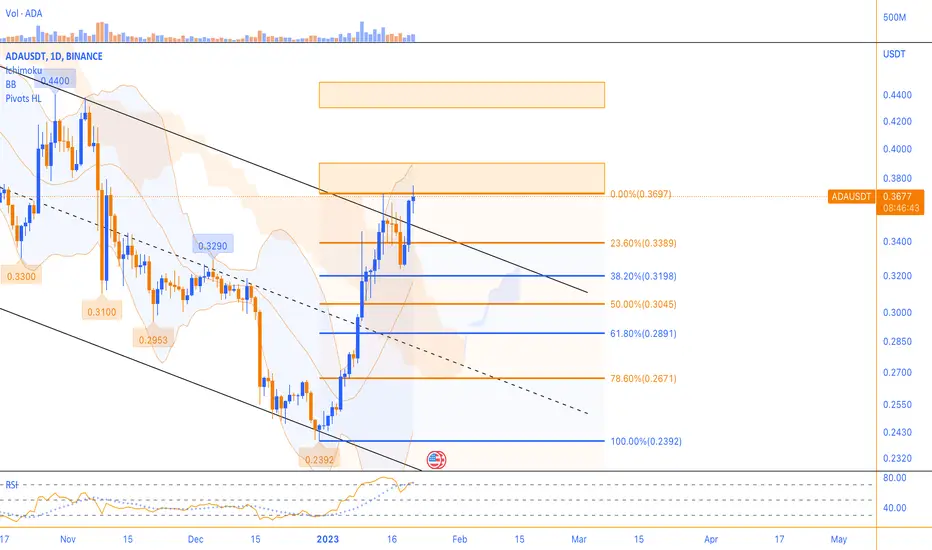
This analysis takes focuses on a bullish trend with some support levels which can influence the price further. As there are some support levels below the price at 0.3400 , 0.3047 , & 0.2438 respectively, there is a stretch trend for a bullish development in the price. However, it should also be mentioned that some strong resistance levels ( 0.5117 , & 0.2417 ) can hold back the price and this is also reflected in the Fibonacci target price at 0.4271 . It can therefore be concluded that Cardano has strong potential to reach the previous resistance level ( 0.4217 ) and create a good return of potentially 22.47% for the speculative investor.
I hope this analysis was instructive and that it can be used in considering whether Cardano will continue its imposed bullish trend.

Cardano double top (bearish breakout)Hey trader!
This analysis is based on a bearish breakout as a result of a double top . As the previous resistance (at 0.5123 , 0.4262 , & 0.3769 respectively) and support levels (at 0.3398 , & 0.2443 respectively) indicate, the current development is taking place in a bear market . Despite the negative development, a bullish double top has formed which, upon breakout, could trigger a bearish trend down to the target at 0.1989 (as assessed by the Fibonacci ).
I hope this analysis was instructive and useful for future consideration of Cardano .

Wyckoff Accumulation for ADA 2023 into 2024I believe this will play out leading up to the 2024 BTC halving on 4/30/24, with the Bull run kicking off after that event.

✅TS ❕ ADAUSD: before a reversal✅✅ ADA bounced down after reaching the resistance area.
The price is before the reversal.
I expect the decline to continue after the price is fixed under resistance. ✅
🚀 SELL scenario: short to 0.3463. 🚀
----------------------------------------------------------------------------
Remember, there is no place for luck in trading - only strategy!
Thanks for the likes and comments

AdaIf the bottom of the channel is broken, the green lines will be available. And if the break is incomplete, the top and midline targets will be available.

ADA IS BREAKING OUT !!!Hello Cardano community,
I have conducted a simple technical analysis of Cardano and have identified a significant development. The cryptocurrency has recently broken a downtrend line that had been in place for an entire year. This suggests that the market sentiment may be shifting from bearish to bullish, potentially signaling upside momentum for the asset.
Is now the perfect time to buy ADA?
I would appreciate any feedback or additional insights on this analysis. Let's discuss and stay updated on Cardano's progress.

Morning Update: OMH for ADA should do itADA has extended nicely off the bottom. However we are coming into the 2.618 and 3.0 Fib Extension areas. Here I would expect a reaction that could start our retracement in wave 2. Again, I'll reiterate...wave 2's can be shallow, so to get cute and try to sell with the intention of buying back lower is risky.
I got a lot of DM's regarding ADA asking will it come back down? I don't answer them. I am not in the trader counseling business. Buying and selling is your decision. If you sell ADA in this area, and we get a long consolidation or a shallow retrace followed by a "rip your face off rally above $.60"...please spare me the DM's. I thank you in advance...lol.
Best to all,
Chris
ADAUSDT : Cardano Aims for Another +60% ⬆Hi Traders, Investors and Speculators of the Chart📈📉
Cardano looks like it's gearing up for another big move; currently consolidating under the resistance zone (which is bullish). Since the last update on ADAUSDT, ADA has increase 62% and from technical indicators RSI and Phoenix Ascending, it looks like it want's to do another 60% ⬆ with TP target just under $0.60.
There are some exiting developments in the crypto space other than the bullish price action on charts. If you've been missing out on some of it, you have to check out these two!
USA Government Federal Debt crisis :
Ethereum and ZK Protocol... in space:
What are your thoughts on this?
_______________________
📢Follow us here on TradingView for daily updates and trade ideas on crypto , stocks and commodities 💎Hit like & Follow 👍
We thank you for your support !
CryptoCheck

ADA USDT BINANCEAiming long for ADA.
A lot of Alts are going to pump imo.
.76 - 1.03 is a strong magnet pull.
Thanks for following.
Comment if you have any other ideas.
Don't get to greedy and make sure your taking profits on the way up when all these Alts start running.
This isn't financial advice, they are just my ideas and opinions.
DYOR

ADAusdt 1D break TrendLine In the chart, we can see the break of the trend line, which has approached the resistance area, and I have specified the continuation of the trend according to this important area in the chart.
Its not Buy or Sell SIGNAL
DYOR
BY : M.TeriZ - @AtonicShark

#ADAUSD- LONG WHAT DO YOU THINK?-Bullish momentum has begun and long term view on ADAUSD is bullish.
-If price bounce from our area it will indicates the long term view.
What you all think?
Will keep you updated!!

Change the trend in the daily timeframe will be providedAfter ADA took the range trend under the ceiling resistance of the main downward channel, this resistance was broken again yesterday with the support of buyers. Cardano's next targets on the chart are the $0.3750-$0.390 resistance range and the $0.43-$0.45 range, which could be short-term buyers' profit-saving areas. We can consider an ascending channel for ADA in the 4-hour time frame. As long as the bottom of the channel is not broken, the price increase can continue up to the specified targets. In case of breaking the first specified target, the potential to change the trend in the daily timeframe will be provided.

Ada Cardano, Time to buy
Cardano’s ADA cryptocurrency is one of the top 10 tokens, according to CoinMarketCap rankings, with a market capitalization of about US$11.7 billion.
