A positive divergence is observed on the RSI indicator!ADA experienced a sharp decline over the past week as selling pressure increased, falling from the $0.41-$0.43 resistance range straight to the bottom of its medium-term descending channel. The support associated with a positive reaction and related to the monthly time frame ranges from $0.30 to $0.35. A strong reversal with a 16% positive candle from this area could be a good sign for Cardano. So if we don't have more price drops, Cardano has good price growth potential from this support area.
Of course, the price is still at the bottom of the channel, and the potential to enter a range trend to reduce selling pressure is high. For this reason, minor support is considered in the range of $0.335-$0.340, and as long as this area is maintained, Cardano price growth is possible. A positive divergence is observed on the RSI indicator. Therefore, the potential for price growth will exist if the market conditions are maintained. With a low probability, if the current support is broken, the decline could continue to $0.22-$0.23.
Adausd

Ada update Will cardano is one of my biggest position in ALTs after ETH
to be honest its clear it can reach .28 $ then .16 $
With that been said ill keep accumulating ada and stake it .
I believe it a good ALT coin .
GOOD LUCK

Cardano may to touch $0.30 cents againIn this short analysis, for who are interesting to invest in Cardano in short term, I see a potential and nice trade in this cryptocurrency to short. Cardano in H1 chart formed a little descending triangle, that it's a bearish pattern in trading rules. But there're an interesting trade to put a sell order zone. In my case, I put a sell order limti in $0.357 cents. Stop Loss to $0.375 cents and my fix target $0.30 cents.
Now, talking about in H4 timeframe, the perspective still bearish in ADA. Also, if I would gotten make analysis before, we can to enter in $0.38 cents and this trade will be spectacular to short.
Another chart it's in Daily timeframe that Cardano it's into this bearish channel since midterm August 2022 from $0.58 cents. What in general rules it's a bearish continuation, and right now, we're in the clearly bearish movement that I told you a long time that Cardano could to make a bottom around $0.22 cents as the minimum price to watch in this bear market.
So guys, I hope that this analysis support you very well and invest good in cryptocurrencies.

✅TS ❕ ADAUSD: whole crypt✅✅ ADA also fell like the whole crypt.
The price makes a correction.
After which a drop is expected, perhaps even below the level.✅
🚀 SELL scenario : short to 0.862.🚀
----------------------------------------------------------------------------
Remember, there is no place for luck in trading - only strategy!
Thanks for the likes and comments.

Cardano (ADA) - November 8Hello?
Welcome, traders.
By "following", you can always get new information quickly.
Please also click "Boost".
Have a good day.
-------------------------------------
(ADAUSDT 1W chart)
The key is whether you can climb to the 0.5184-0.6834 section.
(1D chart)
The HA-High indicator is forming near 0.3974, so we need to see if we can find support and move up around 0.3974.
If not, there is a possibility that it will fall to around 0.3621.
The interval 0.5184-0.6834 is the interval that determines the trend.
Approaching this section can make you feel like you're going to skyrocket and you might end up buying.
Therefore, it is advisable to decide whether to buy or not buy this coin before it rises above 0.4380.
This is because you may end up buying at a high point.
------------------------------------------------------------ -------------------------------------------
** All descriptions are for reference only and do not guarantee a profit or loss in investment.
** If you share this chart, you can use the indicators normally.
** The MRHAB-T indicator contains indicators that indicate support and resistance points.
** SR_R_C indicators are displayed as StochRSI(line), RSI(columns), CCI(bgcolor).
** CCI indicator is expressed as overbought range (CCI > +100) and oversold range (CCI < -100).
(Short-term Stop Loss can be said to be a point where profit and loss can be preserved or additional entry can be made through split trading. It is a short-term investment perspective.)
---------------------------------

Cardano - WATCH OUT❗ Testing Support❗Hi Traders, Investors and Speculators 📈📉
Ev here. Been trading crypto since 2017 and later got into stocks. I have 3 board exams on financial markets and studied economics from a top tier university for a year. Daytime job - Math Teacher. 👩🏫
Cardano is testing a crucial support level - the same that was once the very first resistance zone. This makes it an important level to watch, because if we fall lower, the support zones are few and far apart and this could lead into another multi-month bear market. There is potential for a short setup if the price CLOSES a daily candle underneath this support zone of $39c.
Alternatively, you could continue to accumulate and dollar cost average your way down until your bags are full 💰💰
_______________________
📢Follow us here on TradingView for daily updates and trade ideas on crypto , stocks and commodities 💎Hit like & Follow 👍
We thank you for your support !
CryptoCheck

✅TS ❕ ADAUSD: triple vertex✅✅ ADA has formed a triple vertex.
The price bounced down each time.
I expect a fall.✅
🚀 SELL scenario : short to 0.376.🚀
----------------------------------------------------------------------------
Remember, there is no place for luck in trading - only strategy!
Thanks for the likes and comments.

ADA price action about to break outAccording to the weekly ADA USD chart as well as the weekly RSI, the ADA price action is about to break out the descending support in yellow. As can be seen in the weekly RSI, the descending support has already been broken but still the ADA price action above, needs to follow this existing RSI break out. Looking bullish in the long term as long as Cardano continues with better fundamentals and more dapps to be deployed.

Ada Closing long posotion when reaching 0.618 correction wave for the down trend
Then ill sell spot at 0.48 ish to 0.2 ish or 0.16 ish
GOOD LUCK

Cardano (ADAUSDT): the probability of resuming long-term growth.●● Preferred count
● Cardano / TetherUS (BINANCE) , 🕐TF: 1D
Fig.1
The correction within the framework of the expected wave (2) , the beginning of which was successfully predicted in August last year , could have already been completed at the level of 0.3300 , taking the form of a single zigzag A-B-C .
_______________________________________
● Cardano / TetherUS (BINANCE) , 🕐TF: 6h
Fig.2
The presence of formed waves 1-2 , the first of which will exceed the top of wave B of (2) , will allow you to enter a long position without fear for the probability of continuing the development of the descending wave C of (2) .
_______________________________________
●● Alternative count
● Cardano / TetherUS (BINANCE) , 🕐TF: 1D
Fig.3
As an alternative scenario, we can assume that the entire descending structure is a wave A as part of a zigzag A-B-C . The thing is that the lateral formation, which in this version of the count is assigned the marking ((iv)) , can be identified as a combination with a triangle at the end.
📚 Elliott Wave Guide & Ellott Wave Archive ⬇️⬇️

ADAUSD ❕ upper boundary of channelADA is moving in a downward channel under liquidity.
Trading volumes show the market's interest in falling prices.
RSI is in the bearish zone (4H TF)
TD Sequential has formed a reversal signal downwards (30m TF)
I expect the fall of the asset after fixing in the channel.

Cardano ADA bullish ahead of the FOMC Press ConferenceI am bullish on Cardano ADA ahead of the FOMC Press Conference.
Those are my price targets:
ADA/USDT
Entry Range: $0.39 - 41
Take Profit 1: $0.46
Take Profit 2: $0.51
Take Profit 3: $0.56
Stop Loss: $0.33

ADA to 0.65!ADA is forming bear flag, and it is right below crucial resistance zone (0.42). If ADA breaks 0.42 we might see huge green candles in November.

Trading opportunity for ADAUSDT CardanoBased on technical factors there is a Long position in :
📊 ADAUSDT Cardano
🔵 Long Now 0.4131
🧯 Stop loss 0.3900
🏹 Target 1 0.4570
🏹 Target 2 0.5200
🏹 Target 3 0.5900
💸RISK : 1%
We hope it is profitable for you ❤️
Please support our activity with your likes👍 and comments📝

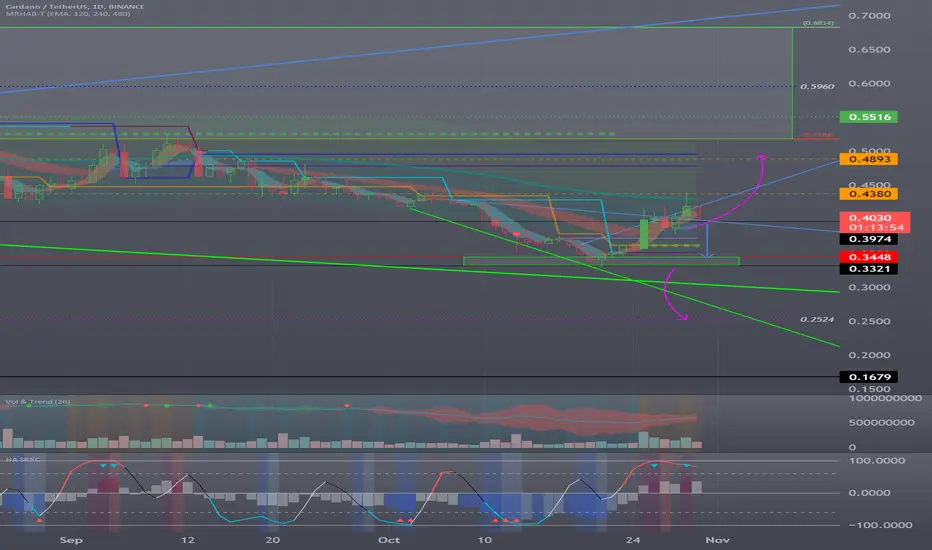
Cardano (ADA) - October 31Hello?
Welcome, traders.
By "following", you can always get new information quickly.
Please also click "Boost".
Have a good day.
-------------------------------------
(ADAUSDT 1W chart)
The key is whether it can rise above the 0.5184-0.6834 section and be supported.
(1D chart)
We need to see support near 0.3974 and see if we can move higher than 0.4380.
This is because the 0.4380 and 0.4893 points are the points where the HA-Low indicator of the 1W chart passes, so if the price is maintained above these points, the uptrend is expected to continue.
However, since the 0.5184-0.6834 section is the section that determines the trend, in fact, it is expected to show a full-fledged upward trend when it rises above this section.
------------------------------------------------------------ -------------------------------------------
** All descriptions are for reference only and do not guarantee a profit or loss in investment.
** If you share this chart, you can use the indicators normally.
** The MRHAB-T indicator contains indicators that indicate support and resistance points.
** SR_R_C indicators are displayed as StochRSI(line), RSI(columns), CCI(bgcolor).
** CCI indicator is expressed as overbought range (CCI > +100) and oversold range (CCI < -100).
(Short-term Stop Loss can be said to be a point where profit and loss can be preserved or additional entry can be made through split trading. It is a short-term investment perspective.)
---------------------------------
Cardano : repeating bear market shape UPDATE Cardano : repeating bear market shape UPDATE
just an update to the last idea (attached), things have become a bit clearer, adjusted the fractal to suit. only thing that is unclear with that idea is whether we get one more fake bounce for a bit or not..
its obviously following the last macro bear moves. question is does it diverge, and when? if it does stop following this i'd expect it to around this price point pivot.
gl

Trading opportunity for ADAUSDT CardanoBased on technical factors there is a Long position in :
📊 ADAUSDT Cardano
🔵 Long Now 0.4250
🧯 Stop loss 0.3737
🏹 Target 1 0.4900
🏹 Target 2 0.5400
🏹 Target 3 0.5900
💸RISK : 1%
We hope it is profitable for you ❤️
Please support our activity with your likes👍 and comments📝

The next target of buyers!ADA recorded good price growth during the last week. Cardano's price reacted positively with high trading volume as it hit a good support area at the bottom of the short-term descending channel. I expected a positive reaction from this area. The price has grown up to the midline range of the channel, i.e., the resistance of $0.415-0.430, and after the collision, a negative reaction has been observed due to the bearishness of the overall trend. With the good growth recorded, Cardano's trend in the 4-hour time frame is bullish due to the formation of higher ceilings and floors. Also, the support of the previous ceiling range at the price of $0.38 has prevented the price from falling further.
The point is that due to the strong reaction seen in the first encounter with the $0.415 resistance, there is a possibility that the price will enter a range trend for Cardano. This trend can continue between the specified levels, and in general, as long as the support is held, the resistance is more likely to be broken. If the resistance is broken, the next target for buyers will be in the range of $0.46 to $0.47. This target is near the ceiling of the descending channel, and a stronger reaction can be expected from it.

ADA /USDT#ADA UPDATE.
#ADA is currently trading in ascending triangle with blue box area as the resistance .For upside move ADA needs to close above the blue box however chances of pullback are higher as ADA is trading with bearish divergence.

ADA DESCENDING TRIANGLE Broke out of the Descending Triangle to the downside after losing major Support.
Wicked the 1.5 Fib level and then bounced with a spring candle, printing a custom oversold label.
Trying to break back into the Descending Triangle with 3 failed attempts at strong S/R level.

ADAUSD ❕ downtrendRSI entered bearish zone (4H TF)
Price has broken down 200EMA and is testing 50EMA as support (4H TF)
ADA and RSI have formed a bullish divergence (30m TF)
I expect a correction of the current move to resistance and a further drop after it has fixed under it.

✅TS ❕ ADAUSD: bounced off✅✅ ADA bounced off the resistance level.
But it is possible to form a second vertex.
After that, you can expect a fall.✅
🚀 SELL scenario: short to 0.346.🚀
----------------------------------------------------------------------------
Remember, there is no place for luck in trading - only strategy!
Thanks for the likes and comments.

Cardano's falling triangleI see a neo-wave triangle for Cardano that we are in its last wave. After completing the E wave, it can move down. The characteristics of this triangle are correct from time to time and price.
Comment any question you want
Thank You
