ADA/USDT 1 DAY CHART PROJECTED FALL AND BULLRUN TOPIn this idea I project the bottom for ADA and where we are likely to see it go to. This is a decent run up for this coin and ADA enthusiasts have a lot to look forward to in 2023. If you agree throw me a like and follow me for more unique ideas and concepts that keep you in the gains. Stay tuned as I will be dropping a lot of projections for the coming bullrun for various Alts. Much love to my supporters - ND
Adausd

ADAUSDT 1D Effect of the Vasil hard fork on the Cardano priceOn Thursday, Sept. 22 , the Cardano blockchain will carry out its much-anticipated Vasil hard fork, a backward-incompatible upgrade taking place on the main network that is intended to enrich smart contract capabilities, increase the chain’s throughput and reduce costs.
The crypto community is very optimistic about the upgrade and expects the price of Cardano to rise. Previously, hard forks have been a catalyst for ADA prices to rise. After two updates, the price of ADA has grown almost 40 times (look at the chart). But after the last Alonzo hard fork in 2021, the price of Cardano fell by -80%. But it will also be true that in the same period, the bear period began in the cryptocurrency market.
Probably, now they want to launch the Vasil hardfork at the "right time" , so that the ADAUSDT price would immediately start to rise, since it was originally postponed from June to July, and now to September.
You can try to take a good medium-term deal:
Entrance - $0.45
Stop below $0.422 (-6.2%)
TP1 - $0.74 (+64%)
TP2 - $1 (+122%)
R/L ratio 20/1
_______________________________
Since 2016 , we have been analyzing and trading the cryptocurrency market.
We transform our knowledge, trading moods and experience into ideas. Each "like under the idea" boosts the level of our happiness by 0.05%. If we help you to be calmer and richer — help us to be happier :)

ADAUSD ❕ rising bottomTrading volumes show no interest in falling prices.
ADA is in the liquidity zone.
TD Sequential has formed a reversal signal upwards (30m TF)
I expect that on fixing the price will continue to move in a range.
Ada- #ada $ada Important Dear Friends
This is an important analysis for ADA. because the price touched an essential zone.
maybe it'll go up until 20-25%.
if it is not consolidated in the upper zone, it can go down to under 1$.

✅TS ❕ ADAUSD: strong downtrend✅✅ADA is still moving in a strong downtrend. The price has almost reached the support level. I expect a fall.✅
🚀 SELL scenario: short to 0.425.🚀
----------------------------------------------------------------------------
Remember, there is no place for luck in trading - only strategy!
Thanks for the likes and comments.

#Cardano Sells Off, will ADA Crash below $0.40?Past Performance of Cardano
ADA prices remain within a bear formation and below September 2022 highs at $0.52. Technically, Cardano sellers are in control, aligned with the bear bars of August 19 and September 13. In the past six trading days, despite optimism among traders, bulls have failed to unwind losses and prices remain trapped below $0.52 but ADA is holding up at around $0.45.
#Cardano Technical Analysis
From the daily chart, ADA bears have confirmed the September 13 and August 19 bear bars, and are trading in a bear formation, breaking out below last week’s lows. Even though there were encouraging attempts by buyers to soak in the wave of selling pressure last week, the accompanying trading volumes were relatively low. Therefore, it wasn’t surprising prices cratered earlier today in a bear formation. Even so, with ADA volatility expected to rise in the next few days, traders can wait for a break above $0.52 or further losses strongly below $0.45 before initiating trades. If buyers take charge, ADA may easily float to $0.58 and later $0.66 in a bull trend continuation formation. Conversely, bears will dominate if there are cracks below $0.45, confirming today’s losses. In that case, ADA may dump below $0.40, printing new 2022 lows in a bear continuation formation.
What to Expect from #ADA?
Cardano's Vasil is on September 22. Ahead of this major upgrade, ADA may likely find support considering the prevailing sentiment. Before then, aggressive traders can short on pullbacks, targeting $0.40. Meanwhile, conservative traders can wait for a clear trend to form either, solidly below $0.45--aligning with September 19 losses, or above $0.52, changing the fortunes for ADA bulls.
Resistance level to watch out for: $0.52
Support level to watch out for: $0.45
Disclaimer: Opinions expressed are not investment advice. Do your research.

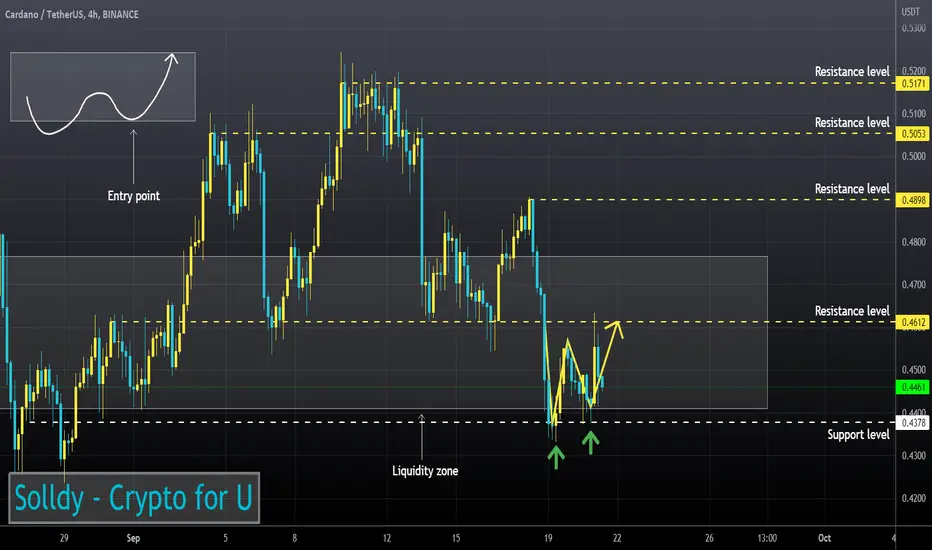
ADA/USDT - BEARSH ENGLUFING PATTREN ----- Welcome, dear followers! -----
- Here is my trading methodology. I trade with a normal system and analysis of resistance and support, as well as price reversal patterns.
- For the record, I do not place a stop loss within my trades. So that I only risk 1.5% of my total capital in order to support the loss due to a price reversal against me.
- If a price reversed against my expectation and touched the drawn line r3, then I transferred targets to the entry point and waited for the price to close at it with a loss equal to almost zero.
- Today's deal is shown in the chart, and here are the entry and exit points below.
-- Support me with numbers and follow up on my account for other deals in the future. Thank you for coming to this part. --
-------------------------------------------------------
⚡️⚡️ ADA/USDT ⚡️⚡️
Exchange: Binance Futures
Trade Type: Breakout (Short)
Leverage: Cross (1.0X)
Entry Orders:
1) 0.4770 - 100.0% (165.9625 USDT)
Take-Profit Orders:
1) 0.4612 - 80.0%
2) 0.4538 - 19.999%
Trailing Configuration:
Stop: Breakeven -
Trigger: Target (1)

Cardano the sleeping giant Cardano been in long down trend
And expected to continue in same trend
Less risk than others
But 95% maybe the bottom
0.2-0.1 accumulation prices for long. Long term

Cardano ADA heavy coin inflow into exchangesNext week we have the FOMC meeting.
Most likely the Federal Reserve will raise rates by 75 basis points. In case of 100 basis points increase, i expect a sell-off in the markets.
Major cryptocurrencies have seen heavy coin inflow into exchanges recently.
I expect a strong sell pressure next week.
ADA/USDT short
Entry Range: $0.45 - 0.49
Take Profit 1: $0.41
Take Profit 2: $0.35
Take Profit 3: $0.30
Stop Loss: $0.52

#ADA is goring to retest the dynamic resistanceHi guys I hope you are powerful and rich as always
In this idea I will chart the #Cardano as your request
#ADA in 4h was corrected from the level of 0.60 and now is trying to reach to dynamic resistance at the area of 0.52 ... If #ADA broke out the resistance it can go to the next area of resistance in 0.70 - 0.75
Thank you so much

💡Don't miss the great buy opportunity in ADAUSD @CardanoTrading suggestion:
". There is a possibility of temporary retracement to the suggested support line (0.469).
. if so, traders can set orders based on Price Action and expect to reach short-term targets."
Technical analysis:
. ADAUSDT is in a range bound, and the beginning of an uptrend is expected.
. The price is above the 21-Day WEMA, which acts as a dynamic support.
. The RSI is at 55.
Take Profits:
TP1= @ 0.487
TP2= @ 0.504
TP3= @ 0.522
TP4= @ 0.545
TP5= @ 0.583
SL= Break below S2
❤️ If you find this helpful and want more FREE forecasts in TradingView
. . . . . Please show your support back,
. . . . . . . . Hit the 👍 LIKE button,
. . . . . . . . . . Drop some feedback below in the comment!
❤️ Your support is very much 🙏 appreciated!❤️
💎 Want us to help you become a better Forex / Crypto trader?
Now, It's your turn!
Be sure to leave a comment; let us know how you see this opportunity and forecast.
Trade well, ❤️
ForecastCity English Support Team ❤️

💡Don't miss the great buy opportunity in ADAUSD @Cardano Trading suggestion:
". There is a possibility of temporary retracement to the suggested support line (0.469).
. if so, traders can set orders based on Price Action and expect to reach short-term targets."
Technical analysis:
. ADAUSDT is in a range bound, and the beginning of an uptrend is expected.
. The price is above the 21-Day WEMA, which acts as a dynamic support.
. The RSI is at 54.
Take Profits:
TP1= @ 0.487
TP2= @ 0.504
TP3= @ 0.522
TP4= @ 0.545
TP5= @ 0.583
SL= Break below S2
❤️ If you find this helpful and want more FREE forecasts in TradingView
. . . . . Please show your support back,
. . . . . . . . Hit the 👍 LIKE button,
. . . . . . . . . . Drop some feedback below in the comment!
❤️ Your support is very much 🙏 appreciated! ❤️
💎 Want us to help you become a better Forex / Crypto trader ?
Now, It's your turn !
Be sure to leave a comment; let us know how you see this opportunity and forecast.
Trade well, ❤️
ForecastCity English Support Team ❤️

My ADA Draftcast V1.1 Using the same fractal from V1.0, movement is in similar wave pattern so far since when I first posted my V0. Hair raising likeness don't you think?

Cardano (ADA) and whole crypto going to retrace 50% from here !Hello traders .
in my opinion 21 September will be important day for whole markets exclusively for crypto !
it sounds logical that FED interest rate hike can push down ADA to fill the gap between ( 0.23 $ - 0.19 $ ) and the day after rising interest rate is CARDANO Vasil upgrade which can reverse price and push it to the upside ( 0.6 $ - 1 $ )
if you agree BOOST the post ,thank you ♥

ADAUSD Doesn't seem to be able to get out of its bearish trend.Cardano (ADAUSD) got rejected 6 days ago exactly at the top (Lower Highs trend-line) of the long-term Channel Down pattern that it has been trading in since the September 02 2021 market High. This is the 4th Lower High rejection of this structure and when that happened in the past, a strong rejection followed.
Cardano has been trading sideways for basically 3 months (since the June 18 low). As you see this has the potential to extend a green Channel if the price breaks above the Lower Highs. Until then, it would be best to sell again only if the 0.400 Support (July 13 Low) breaks and target the 2.0 Fib extension. A break above the Lower Highs though should extend this 3 month neutral trade and test first the 1W MA200 (red trend-line), which has been basically the Resistance during these 3 months, and secondly the 1D MA200 (orange trend-line) for the ultimate long-term trend test.
When ADA breaks and closes above the 1D MA200, then and only then we can consider a long-term shift of fortunes from bearish to bullish. The Bullish Cross on the MACD (on the 1W time-frame) could be an early indication of such a move.
--------------------------------------------------------------------------------------------------------
** Please support this idea with your likes and comments, it is the best way to keep it relevant and support me. **
--------------------------------------------------------------------------------------------------------

ADAUSD breakdown out of wedge confirmed sell of news startedCardano ADA going on 22 September trough Vasile Forke, similar to Ethereum Merge it would be a "sell news" after "buy rumors".
Sell of is already started break down of rising wedge is confirmed.
Next target is $0.40 forty cent and confirmation of break down of descending triangle would crush it to lower region about 10 cent and lower
