ADA.....4h###Update to previous analysis.
### China has dealt a very strong blow to Bitcoin and cryptocurrency, resulting in huge losses for the crypto business. Bitcoin was able to withstand and compensate for some losses.
This led Cardano to achieve the selling objective in the previous analysis.
I expect that China has now exhausted the strength of its attack on Bitcoin and others, and that it is time to compensate for the losses
# Analysis on the 4-hour chart.
# Analysis is based on trends and Wyckoff's strategy.
# It is below a red downtrend.
# At the end of the Wyckoff compilation phase (in blue), to the top.
---------
# strong probability:
*** It crossed the red downtrend to 1.8395.
*** Exceeding 1.8395 goes to 2.3733.
Adausdanalysis

ADAUSD......4h# Analysis on the 4h chart.
# Analysis is based on trends and Wyckoff's strategy.
# It is below a red downtrend.
# At the end of the Wyckoff assembly phase (blue), upwards.
---------
# Very low probability:
**** Breaking 1.26747, a drop to the uptrend (dark blue).
# strong probability:
***Passing the red falling trend goes to 1.8395.
*** Exceeding 1.8395 goes to 2.3733.


Cardano- strongly bearish under 1.5Like a lot of coins, also Cardano is trading at an important juncture.
At this point, AdaUsd is trading just above 1.5 very important support and if bulls can't manage to hold the price above a new wave of selling could bring the price at 1usd.
In my opinion, this will be the case and I'm looking to sell rallies

ADA .... 4h# Four hour chart.
# Inside a main ascending parallel channel.
# Inside an ascending sub-parallel channel.
# Bypassing a downtrend..blue.
# Stochastic oscillates upwards.
---------
= Targets are:
* 2.0666.
*2.2052.
* 2.4519
--------
# It fails if it breaks the level of 1.6588
# It is now in the buying zone.

200% ready for ADA ... $4 ADA straightway after correction 🚀
Till now $1 is seems to be holding well for ADA after testing it many times.
Most likely we gonna see a pullback from a double top resistance.
Look at the channel on the chart, u will get that we r in a bullish uptrend.
An estimated pullback from $2.40 to $1.40 between within June. ( about 45% down)
On short-term n Mid-term we r bullish.
If we moved as expected on the chart, it will good indicator to make lower lows after the pullback
After we gonna break $2.40 resistance we will see $4 straightway.
I think we gonna break the $2.40 resistance after the third trial.
If u r holding now don't sell n wait to add more at $1.40 region.
DONT LEVERAGE N USE A PROPER RISK MANAGEMENT STRATEGY !!
Please click LIKE button and Appreciate my hard work.
Must follow me for latest crypto real time updates.
Thank you.

💡Don't miss the great buy opportunity in ADAUSD @Cardano
Trading suggestion:
". There is a possibility of temporary retracement to the suggested support line (1.6461).
. if so, traders can set orders based on Price Action and expect to reach short-term targets."
Technical analysis:
. ADAUSD is in a range bound, and the beginning of an uptrend is expected.
. The price is above the 21-Day WEMA, which acts as a dynamic support.
. The RSI is at 60
Take Profits:
TP1= @ 1.8731
TP2= @ 2.0190
TP3= @ 2.1452
TP4= @ 2.2635
TP5= @ 2.4377
SL= Break below S2
❤️ If you find this helpful and want more FREE forecasts in TradingView
. . . . . Please show your support back,
. . . . . . . . Hit the 👍 LIKE button,
. . . . . . . . . . Drop some feedback below in the comment!
❤️ Your Support is very much 🙏 appreciated!❤️
💎 Want us to help you become a better Forex / Crypto trader?
Now, It's your turn!
Be sure to leave a comment; let us know how you see this opportunity and forecast.
Trade well, ❤️
ForecastCity English Support Team ❤️

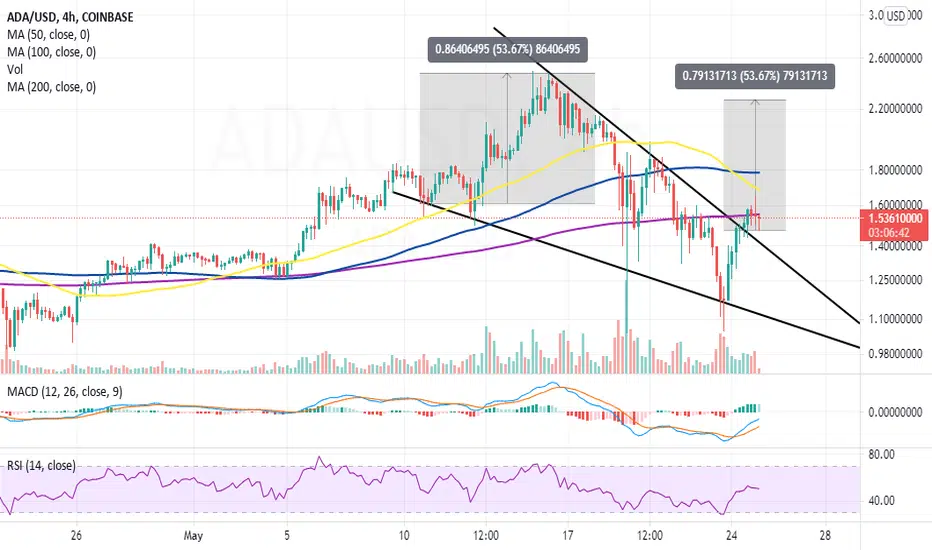
ADA on the brink of explosive move to $2.4Cardano has been nurturing an uptrend since the initial downswing to $1 in May. The first recovery attempt almost brushed shoulders with $2, but another correction ensued almost immediately. The cat and mouse game continued between the bears and the bulls, with the resistance at $1.8 capping movement. On the downside, bulls have kept growing more assertive, explaining the higher low pattern on the four-hour chart.
Cardano draws nigh to an ascending triangle breakout
The upcoming smart contract token has kept investors’ interest on the roof, particularly with all the developments on the network. Note that the horizontal resistance at $1.8 formed the ascending triangle’s x-axis. Similarly, the higher lows formed the hypotenuse, implying that bulls are gaining traction.
An ascending triangle is a highly bullish pattern in technical analysis. Eventually, a breakout occurs before the trend lines converge. Low volumes characterize the period of consolidation within the triangle. However, a surge in trading volume marks the breakout, as bulls take advantage of the expected upswing toward $2.4.
Cardano’s uptrend has been affirmed by short-term bullish signals from the Moving Average Convergence Divergence (MACD) and the Relative Strength Index (RSI). The former recently returned to the positive region while the MACD line maintains the divergence above the signal line.
Subsequently, the RSI almost hits the overbought region, hinting at an intense bullish grip. Therefore, a break above $1.8 (triangle’s x-axis) may catapult Cardano toward the target of $2.4.
Cardano intraday levels
Spot rate: $1.75
Trend: Bullish
Volatility: High
Support: $1.6, $1.3 and $1.3
Resistance: $1.8 and $2.2

ADAUSDT ..... 4h# Analysis of the four-hour chart.
# Crossing the moving average 86
# A price channel has been crossed at 1.6474, the target is 1.9115 - 2.1081.
# A head and shoulders pattern is forming, waiting to cross the neckline to target 2.2409.
-----------
= Analysis fails if 1.6065 is broken.
= The #area 1.7600--1.7923 is a difficult and dangerous area
=#new update

ADARejected from the support at 1.35, ADA has another hop at 1.5, and only after that we can hope for a palpable rebound. The next few hours are important, so for now a moderate to long prediction.

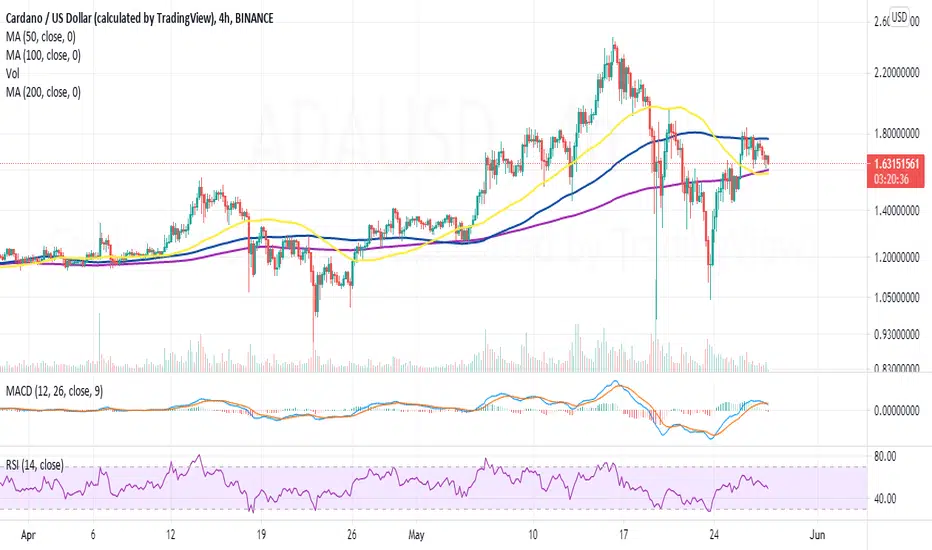
Cardano price holds steady ahead of smart contracts rolloutCardano immediately swung into recovery following the massive dip to $1. The upswing was sharp and consistent but hit a barrier at $1.8, which curtailed the planned strike past $2. ADA had traded all-time high highs around $2.5 in mid-May.
In the meantime, the upcoming smart contract token is trading at $1.66. Marginally beneath the prevailing market value, ADA holds onto crucial confluence support at $1.6 created by the 50 Simple Moving Average (SMA) and the 200 SMA on the four-hour chart.
Keeping this anchor zone protected is critical for sustaining the uptrend; otherwise, if lost, massive declines would come into the picture, forcing Cardano to explore the rabbit hole back to $1.
Cardano's journey to smart contract capability nears the end
Input Output Global (IOG), Cardano's developer, has announced the final steps that would lead to the beginning of smart contract support on the platform. A hard fork combinatory event referred to as "Alonzo" will be used to implement the features starting in June and leading to full deployment in September 2021.
In addition to the typical smart contracts that require technical knowledge, IOG plans to introduce an app that nearly anyone with an interest in blockchain can use.
What next for ADA as the price stabilizes?
Cardano is teetering between two key levels; the confluence support at $1.6 and the resistance at $1.8, as highlighted by the 100 SMA. The technical outlook in the four-hour timeframe hints at the trend flipping bearish in the near term.
For instance, the Moving Average Convergence Divergence (MACD) has hit a snag in the positive region and appears to be retreating toward the mean line. If the MACD line crosses under the signal line, a sell signal will be triggered. The downtrend has been reinforced by the Relative Strength Index (RSI) correction toward the mean line.
However, the support at $1.5 can hold and may see the resumption of the uptrend. If the breakout above $1.8. Trading past this hurdle may trigger massive buy orders as bulls speculate the rise back to $2.5.
Cardano intraday levels
Spot rate: $1.63
Trend: Short-term bearish bias
Volatility: Low
Support: 1.6 and $1.4
Resistance: 1.8 and $2
Cardano could fall againAfter the recent low of around 1usd figure, Cardano has risen 80% and reached 1.8 important resistance.
As in a lot of coin's cases, I don't believe we are back on bull trend, but just correcting the recent steep fall and a new leg down in fallow.
That being said, I will look to sell around resistance, and only AdaUsd clearly above 2 would change my opinion

Cardano price technical breakout sets out for 60% rallyCardano had an interesting last week whereby it rose into the fifth spot on the market despite the freefall in price. The staking platform boasts of a market cap of $48 billion and trails immediately behind Binance Coin.
The trading last week was gruesome not only for ADA but the entire crypto market. From the recently traded all-time high of $2.5, ADA plummeted to the support at $1.1.
However, the downswing appears to have allowed more investors to enter the market at a lower price, explaining the reflex recovery to $1.6. Moreover, a highly bullish pattern is formed on the chart and is likely to bolster Cardano significantly.
Cardano bulls focus on sustaining a falling wedge pattern breakout
The recovery included the breakout from the falling wedge pattern stalled within a whisker of brushing shoulders with $1.6. Perhaps the overhead pressure came from the resistance at the 200 Simple Moving Average.
It is apparent that bulls are fighting to hold at higher support, a move that ensures that buyers the uptrend is not sabotaged. The falling wedge is a highly bullish pattern, with a target at $2.2.
Meanwhile, Cardano must bring down the resistance at the 200 SMA on the four-hour chart and close the day above $1.6 to validate the anticipated liftoff. The Moving Average Convergence Divergence (MACD) has a bullish outlook, cementing the prevailing technical picture.
Looking at the other side of the picture
The Relative Strength Index (RSI) emphasizes the growing overhead pressure following the rejection at $1.6 and the 200 SMA. Its retreat below the midline is a vivid bearish picture that cannot be ignored. Therefore, investors should be prepared for the bearish leg to extend to $1.4 and $1.1 levels, respectively.
Cardano intraday levels
Spot rate: $1.5
Trend: Short-term bearish bias
Volatility: Expanding
Support: $1.4 and $1.1
Resistance: The 200 SMA, $1.6 and $1.8

ADA Analysis - next 24 to 48 hours are importantADAUSDT is currently within range , once it breaksout and it will test the resistance 1.6 or support level 1.37
Will update the analysis once we see a clear direction for this pair

+630% on 45 mins !!! that's why ADA will reach 10$ 🚀🚀ADA REACHED 23 CENTS !!
19 MAY the price was +2$ n went to 23 cents on the same day !!
I'm pretty sure this the most coin whales agreed to short it.
what we can observe from that:-
1- huge whales shorted from 2$ then closed their short positions n finally they bought tons of ADA.
2- ADA made +630% in minutes cuz they bought a lot.
3- spikes went up after going down cuz they bought first to close their shorting positions.
what we can conclude from that:-
1- this is extraordinary cuz that didn't happen even with BTC.
2- when ADA go up from 23 cents then 1.80 again in minutes this mean that whales believe in Cardano n they loaded thousands of bags.
3- a bullish term indicator for the whole market, they know that Cardano wont go less than 1$ again.
Please click like button and Appreciate my hard work.
Must follow me for latest crypto real time updates.
Thank you.

Cardano price pace sets recovery for altcoinsCardano plunged from highs around $2.4 amid the broad-based cryptocurrency declines. The losses extended below $2 before the bulls regained balanced at $1.4. Like Bitcoin, ADA immediately started a reflex recovery where the gap to $2 was almost closed on Thursday.
Despite leading altcoins in recovery, Cardano stalled under $2 and, more specifically, at the 50 Simple Moving Average (SMA) on the four-hour chart. A correction ensued, allowing bears to come into play.
At the time of writing, ADA is doddering at $1.75 after losing the key support at $1.8, provided by the 50 SMA. Higher support is needed for the bulls to concentrate on recovery fully. However, all is not lost because short-term technical levels appear steady.
Cardano rejected at the 50 SMA, but bulls focus on $2.4
The Moving Average Convergence Divergence (MACD) on the four-hour chart has a bullish impulse. For instance, the MACD line (blue) has crossed above the signal line, insinuating that it was time to buy into Cardano.
Note that the MACD is a chart overlay indicator tracking the trend of an asset and measuring its momentum. Although it does not suggest whether an asset is overbought or oversold, the MACD helps identify positions to buy the dip or sell the bottom.
A confirmed break above the 50 SMA will assist in guaranteeing the journey above $2 and toward the all-time high at $2.4.
However, the Relative Strength Index (RSI) has a bearish outlook, hinting at a more extended correction. As the RSI drops under the midline, overhead pressure rises; thus, jeopardizing support levels at $1.6 and $1.4.
Cardano intraday levels
Spot rate: $1.75
Trend: Bearish
Volatility: Low
Support: $1.6 and $1.4
Resistance: $1.8 and $2

Very Cheap CARDANO / ADA 3.05 $Bitcoin and Ethereum are falling, the island does not fall.
Let's not neglect to collect Fruits that will appear as Peak to Us when Btc and Eth de fall.
Get tp. Stop-loss = 1.96 $ There is a high chance of winning. But it is still affected by the rise and fall of bitcoin.
When the time comes, no one can afford to pay $ 3 within 4 hours at most.
The money entering Cardano is generally fixed inside, the market does not go below a minimum of $ 35 billion
Their investors are solid, so they don't take the act of short selling.
A coin is not short-selling, it always increases, albeit slowly. I suggest you read my old articles.
I don't think it will go below $ 3 in the future, not investment advice.
But be careful when buying for the first $ 3 visit.
If he enters full bull, his first goal is $ 4, his next target goes up to $ 12-14.
Do not forget to take Tp and set your Stop-loss.

ADAUSD BUY/LONG NOW READY (Might still do a restest)Hi All, this is an update based on my previous ADA chart release. You can consider re-entering now already. HOWEVER, note that the market could still fall back to 1.27 - 130.
AGAIN THE OVERALL is still an uptrend yeap.
Technical Analysis
1. Fibonacci Retest to 0.618 (Golden Zone) - Market is bouncing off it already.
2. Retest of Fibonacci Level is also on NEW Horizontal SUPPORT level
Consideration: The market could still fall to 1.27-1.30 range so bear in mind. However, overall and long-term still a strong up all the way to at least 2.00 range.

ADA - 6h. We expect a test in the range of $1.45-1.5After almost 2 months of torment, buyers managed to take control of $1.45-1.5 . It was from the 4th time that Cardano buyers broke through this liquid zone and continued their journey with an ultimate goal of $2. However, given the nature of the breakdown of this range and the not too vigorous growth of the ADA price, it seems that buyers will have to continue defending the range of $1.45-1.5.
If we look at the hourly timeframe , how sellers started their local downward trend, we see a significant increase in sales below the $ 1.7-1.72 range. Buyers' unsuccessful attempt to maintain this local range allowed sellers to hit stop orders that were below $1.58-1.64:
Buyers managed to get the price back above this local range, but we do not believe that this local range can become a solid support for the continued growth of ADAUSDT.
In addition, we see that the current wave of growth is taking place at low volumes, which indicates a small number of interested buyers in this range. Therefore, our main scenario is the continuation of the fall in the ADAUSD price with the first target at $1.45-1.5.
Alternative scenario. If the BTC price breaks the mark of $48600, we think that the ADA price will again return to the wide consolidation zone $0.91-1.5 with the first stop at $1.2
_________________________
We create both short-term ideas (for a local understanding of the market situation) and medium-term forecasts of price movements.
Subscribe to us and get daily concise analytics!


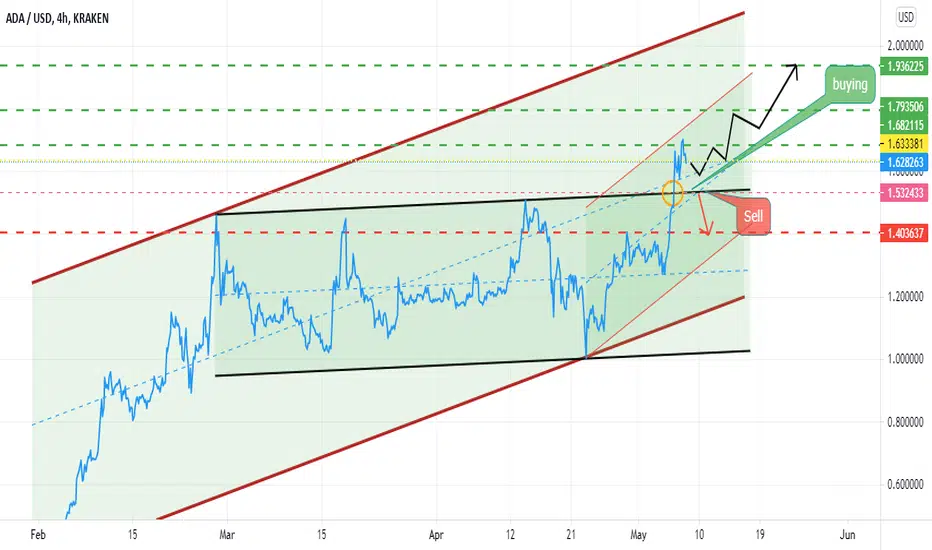
Cardano analysis (ada).= 4h chart.
= Inside a strong bullish price channel.
= Inside his model, and he crossed it to the top.= 4h chart.
= Inside a strong bullish price channel.
= Inside his model, and he crossed it to the top.
========
= Anticipation:
First: buy (strong expectation)
To 1.682115--1.793506-1.936225.
= Buy will fail if 1.532433 is broken.
Second: Selling (poor expectation)
= If we break 1.532433, it goes to 1.403637.
=======
= Buy personal opinion
========
= Anticipation:
First: buy (strong expectation)
To 1.682115--1.793506-1.936225.
= Buy will fail if 1.532433 is broken.
Second: Selling (poor expectation)
= If we break 1.532433, it goes to 1.403637.
=======
= Buy personal opinion
ADAUSD in the next 6-12 daysHey guys, so I'm still learning how to use the Phoenix Ascending and the Bad Ass BB indicators by @WyckoffMode
Both these indicators are great because they give you, the analyst, tons of information on many different timeframes without taking away your responsibility to interpret the data you are presented.
DISCLAIMER:
I'm still very bad at using these Indicators, so don't take my predictions as any kind of advice.
ADAUSD in the next 6-12 days:
The stochastic RSI, the thin yellow and purple lines in the Phoenix indicator, is more sensitive than the regular RSI and thus one can use it to predict what the regular RSI, in this case the green line, might do in the future.
When the yellow sRSI is above the purple one, the price action tends to be bullish and when the purple sRSI is above the yellow one the price action tends to be rather bearish.
The current 3D candle, from the 4th of May till the 7th of May 2021, seems to be crucial for the near term price action of Cardano. If this 3D candle closes with the yellow sRSI BELOW the purple sRSI, we MIGHT see ADAUSD retrace to the 1.18$ - 1.14$ area.
I'm not going to enter any shorts here because this 3D candle can still go either way, but I think the bearish scenario is more likely to occur.
Feel free to share your thoughts and ideas in the comments :)
