ADAADA in the year 2021 was a spectacle. We do exactly 1600% this year. After all this fuss, we are in consolidation, which for me is a continuation of bullish consolidation. The interesting thing is that we create a small consolidation within a larger one.
DISCLAIMER: Please note that my studies portray my personal opinion only and should be considered for educational purposes only. They should not be considered as a recommendation to buy or sell an asset!
I am not responsible for any damages to your capital. Your capital is at risk in the equity market.
Adausdlong

Bouncing of Important Support Zone and FIB levelSince beginning 1.20ish has been the most traded level for ADAUSD ... from the beginning of bull journey to the top, the current level is also an important 61.8% retracement level ... Go long and keep trail the SL. with slow below 1.

ADAUSDT | The best target to climb📍Hello traders, Cardano in daily timeframe , Waves 1, 2 and 3 are composed of this currency and wave 4 is also being formed.
The structure of wave 4 is zigzag and from this zigzag wave a is completed.
We also considered wave b to be complete, but it is not in a good position in relation to wave a in terms of time. In mind.
But for now, we have shown an uptrend to form more waves to make sure the trend continues.
🙏If you have an idea that helps me provide a better analysis, I will be happy to write in the comments🙏
❤️Please, support this idea with a like and comment!❤️

ADA/USDT Hi, ADA is in the ABC correction phase. After 5 waves, Elliott is correcting. The price is currently on an uptrend. We expect growth and ABC seems to be coming to an end.

NeutralHello guys, as you can see, Cardano is in an ascending channel, and if it can maintain the channel, and this maintenance is from the current price, it is 200% profit, and if you want to buy more confidently, enter after the downward trend and 140% profit. Earn and the loss limit is stabilized below 0.87

ADA-USDT (Cardano technical analysis) Daily ViewHello all! 👋🐢
I am expecting to see the red/green pathway play out 🟥🟩. This is just my current view.👍
Long-term I am extremely bullish on ADA (Cardano) and its fundamentals.
(Daily view) Blue arrow only if we maintain extreme bullish momentum
Cardano is currently the third largest cryptocurrency by market capitalization (Number of shares multiplied by price.)
BTC may do a little bit of correction and I expect altcoins such as Cardano to follow with it.
I always recommend looking at multiple charts and reading crypto news before making a large investment.📈💲✔
Thank you for considering this short technical approach analysis 🐶
🛑🛑🛑This is not financial advice🛑🛑🛑 Above are approximate targets based on fibs and major trend lines etc. I always recommend looking at multiple charts when making a big investment. Always have a stop loss ✋🛑💲 set🆗
Any thoughts 💭💡, questions 🙋♀️🙋♂️❓, good 👍, bad👎, happy 😄 or sad 😥, in the comments always welcome.
Jazerbay 🍊🍁

ADA is so valuable at these prices ✔Hello dear Traders. I hope you are having a great day.
Today I am looking at the large picture of ADA chart. As you can see price is moving a ascending channel long term and in the descending channel
short term. In my opinion correction will finish once price touches the bottom of the ascending channel around 1.4$. But I would start buying ADA if
I were you at the current prices. You can DCA until 1.4$. Short term targets are shown on the chart and long term target of ADA can be when it touches
the top of the ascending channel.
🚩 Always remember to put stop loss for your orders in order to reduce the risk of your trades.
🚩 Always keep an eye on BTC chart as well because it can affect the movement of altcoins as you all know my dear traders.
Thank you guys for reading my idea on ADA and don`t forget to comment what you think. ✌

Cardano And FiboCardano in the best Area to Enter
i bought ADA in 1.5$ and my Target for sell is higher than 3$
but i believe in 2$ and 2.5$ we have some pullbacks

CARDANO ADAUSDTHello Traders,
as we said before the area of interest buy will be taken shortly and we will enter long.
BINANCE:ADAUSDT

ADAUSDT | BUY ON BREAKOUTADAUSDT | BUY ON BREAKOUT
ADAUSDT is trading in a downward parallel channel.
It has taken good support from 1.462 which is also a fib level.
Buy position can be taken on break of overhead falling channel. It has the potential to reach 2.056
Plan
Buy: 1.622 (closing required)
SL: 1.462
TP: 2.056 (trail SL accordingly)

ADAUSDT , Buy zone activated , Did you bought ?Hello everyone
According to the previous analysis we shown on chart a buy zone area (green box) and tonight that box is activated and we expect that the price can rise up to reach the first target , and if it can break the first target the other targets is on way of price because when it can break the first target the trend is change to upward and we exit from the wave of correction-downward and the more high target is on our way .
Dont forget use stop loss and attention to money management
Previous analysis :
Good Luck
Abtin

ADAUSDT , We are in ...Hello everybody
According to the chart you can see we are in correction-downward wave, in here we have a key and this means that is the point for the change trend to the up ward and the correction can be finish
But until the price is below the key the trend is downward and we think because of the momentum of movement , the price should make another bottom and will supportin in green box then its ready to go up to reach to the resistance trendline (dynamic) red box and ...
We try to update the chart at that time for the road map of movement
Dont forget use stop loss and take signal then entrance in position
Good Luck
Abtin

ADAUSDT/Cardano AnalysisHello Trader's
I am sharing my analysis for Cardano.
personal I am waiting for ADA to come to touch his support for buy long term.
ADAUSDT/Cardano Analysis.


ADAUSDT | The best area to fall📍Hello traders, Cardano in daily timeframe , this analysis has been prepared in daily timeframe but has been published for a better view in 2 day timeframe.
According to the wave count in this currency, waves 1, 2 and 3 are over and now we are inside wave 4.
Wave 4 will be formed in a zigzag pattern, and from this zigzag, wave a has ended and we are probably inside wave b, we have considered wave b as a flat, to complete this flat, the price will rise to the area of 2.300 It is necesary.
Wave b is very short in time compared to wave a so far we do not think that wave b is complete. We assume that with another ascent this sideways position will continue and then wave c will descend as much as wave a .
🙏If you have an idea that helps me provide a better analysis, I will be happy to write in the comments🙏
❤️Please, support this idea with a like and comment!❤️

ADAThere is low risk to good profit. ADA has divergence and the price is on the important area. risk to reward is 10% to 100%

Ada AnalysisHere's a quick look at ADA 4HR chart. As we can see, the price has been showing a good support zone. We can see S/R flip here anytime.
Now its time to wait and hold it
Definitely one to keep an eye on .
The best entry at Support level now.
Targe t 2.055$
2.3$
Short term target

ADA/USDT 4HOUR UPDATEWelcome to this quick ADA/USDT analysis.
I have tried my best to bring the best possible outcome me in this chart.
Reason of trade :- ADA/USDT is bullish trend conform retest buy the dip and green zone
Entry:- buy green zone
Traget:- 20% to 30%
Stoploss:- 1.786
Remember:-This is not a piece of financial advice. All investment made by me is under my own risk and I am held responsible for my own profit and losses. So, do your own research before investing in this trade.
Happy trading.
Sorry for my English it is not my native languages.
Do hit the like button if you like it and share your charts in the comments section.
Thank you...

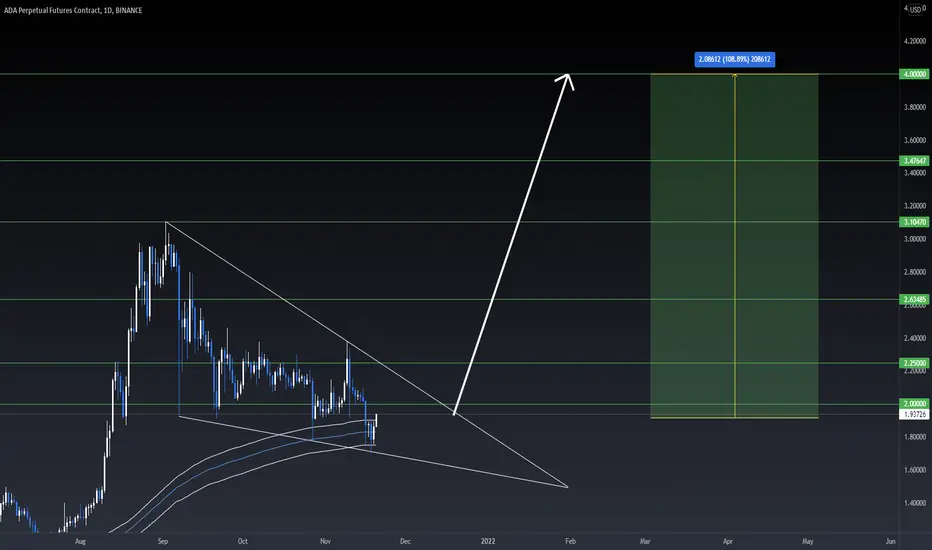
ADA BULL FLAG $4 POTENTIAL? LONG TERM!ADA we all know is a great project.
ADA is currently sitting at #3 already and will need a lot of money for ADA to move and there's a bull flag forming up and seems like we'll get out of the major resistance soon once we do we'll see ADA hitting all the targets one by one.
I believe it will take a few months for these TPs to hit.
Buy the dips and accumulate like whales sell at every TP!!
Hope you liked the idea, give a thumbsup guys!
ADAUSD 200MA SupportAn idea for ADAUSD.
The 200MA in white, can be seen as a previous rejection point for the bulls, lets see if it acts the same way again
I have also used another indicator which demonstrates the change from bear to bull, which can be seen to approaching a change quickly.

ADA 100% is coming .. not over yet
we should totally admit that ADA is bubble n about to burst, like now from a year ago was just 3 cents!!
which means in just year ADA jumped from 0.03 till 3.10 !! (102X)
Do u still think it will continue without a massive correction?
ADA is so successful n amazing project but even though it has to correct first then it will continue upwards.
No uptrend or downtrend will continue forever.
so expect a huge massive correction but after bull run end first .
I think we still bullish till now.
on chart it is crystal clear that ADA is consolidating in triangle segment since we reached 3.10
the same triangle was formed from previous phase leading to a great breakout
now I think correction is done and going up is must.
Dont forget that November, December n January are bullish months for ADA
You can buy now n sell targets ( 2 months)
be patient n stay calm , dont forget your stop loss
✅ buy: 1.80 - 2.00 ✅
🎯TARGETS:
1- 2.35
2- 2.72
3- 3.10
4- 3.60
💵 Trade Size: 5-7% of Portfolio
🚫Invalidation(SL): daily close below $1.68

ADA BreakOut Might Happen Soon, Be on the lookout!ADA might breakout soon, if you are thinking about entering, I would wait for conformation first but I think it might breakout soon.

ADA is a BullADA would break the resistance at 2.06 it and my first take profit would be 2.14 and second is 2.26
