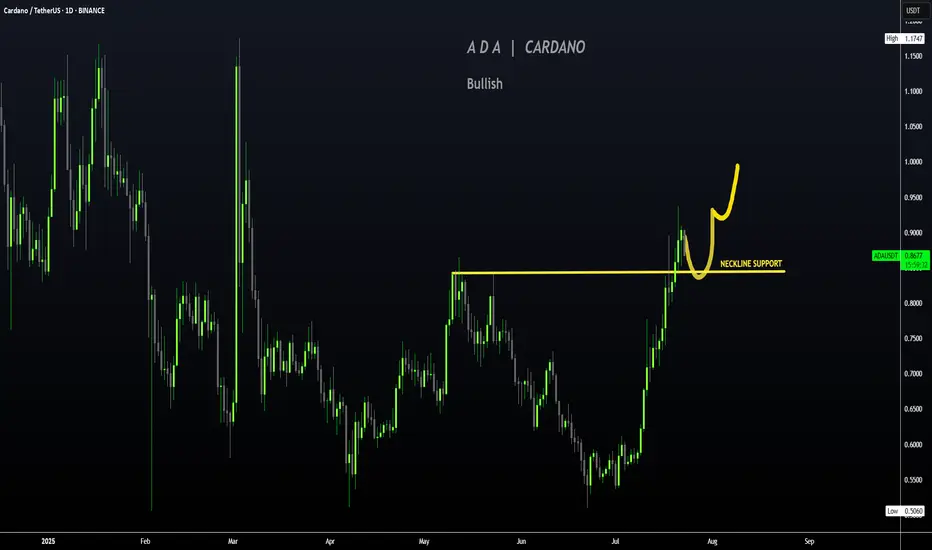
CardanoAda usdt Daily analysis
Time frame daily
Risk rewards ratio >3 👈👌
Double bottom pattern has been created
ADAUSDT

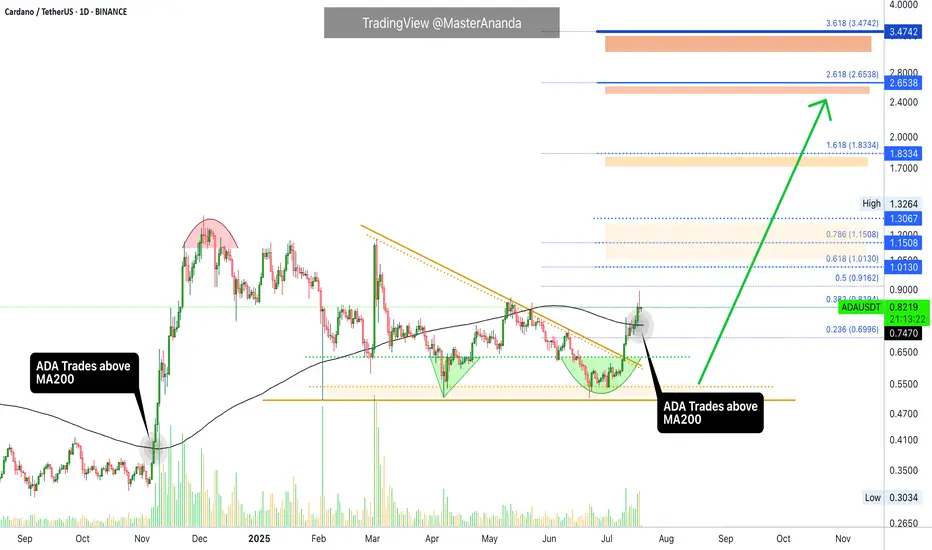
Cardano Has Plenty of Room To Grow · Will Hit Beyond $4 EasilyCardano's all-time high is $3.10. Cardano is currently trading at $0.82. Pause. You will be a genius when ADA is trading at $4 if you decide to buy below $1. It is not too late. This is only the start.
Good afternoon my fellow Cryptocurrency trader, how are you feeling in this wonderful day?
The first major advance for Cardano after the last bull market happened November 2024 and peaked December; we are still getting out of the consolidation that followed the correction of this bullish wave.
Only now Cardano is breaking a sideways channel and still trades below its December 2024 peak. Bitcoin is trading at a new all-time high and is preparing for a major move above $130,000. XRP is trading at a new all-time high and is not dropping. Ethereum is very close to a new all-time high and will certainly continue to grow, only days away. Cardano still has to break its March 2025 high, its December 2024 high; this is not bad, it only means that is still early for this amazing pair.
A bullish advance started 8-July and lasted only 13 days. We are seeing a small retrace now, three days with only one day red. Cardano will recover and continue growing. This growth will not be exhausted in a matter of weeks, it will go for months. Cardano has to grow straight up, daily, weekly, for a prolonged period of time to move beyond $4. But $4 is not the top, $7 and $8 are also possible.
The reason why the action might seen slow, is because this is only the start. Give it time, the market is giving us an opportunity to join. The market is giving everybody the opportunity to buy Cardano while prices are still low. You know how Crypto operates. When it starts moving, it goes so strong and so fast that there is no time to react. Act now and you will reap the reward.
The bullish cycle is confirmed. Just look around, what do you see?
Our sisters and cousins are rising. Our young children are growing; Crypto is going up.
Cardano is one of the main projects in this market and it will not stay behind. You will not be disappointed, you will be happy with the results.
Namaste.
Cardano (ADA) Just Flipped Bullish — Next Stop: $0.9373?ADAUSDT is currently displaying a strong bullish structure on the 4-hour chart, bouncing from a critical support zone near $0.7774–$0.7315. After a healthy retracement, the pair appears to be regaining momentum, forming a potential higher low, which aligns with the continuation of the broader uptrend that started earlier this month.
Recent price action confirms that buyers are stepping in at key zones previously marked by blue “B” labels, and sell-side pressure seems to be weakening after the last swing top around $0.9373. The support zones, marked with dotted green lines, have held well, and the current structure suggests a rebound toward the previous high.
The most recent small leg up shows the formation of a bullish engulfing setup near $0.78, which could serve as a launch point toward the higher resistance. The candlesticks are also showing longer lower wicks — a sign that buyers are defending lower levels aggressively. With price currently floating near $0.81, there’s a good upside window available.
Here’s the trading setup based on the chart:
• Entry: Around $0.8106 (current price zone)
• Take Profit (TP): $0.9373 (previous swing high — +18.23%)
• Stop Loss (SL): $0.7315 (invalidates higher low structure — -7.73%)
• Risk-Reward Ratio: 2.36R (favorable for swing positioning)
If ADA can reclaim the $0.85 zone with strong candle closures, it would signal bullish continuation. Momentum indicators like RSI or MACD (not shown) would likely confirm the shift, especially if divergence was forming on recent dips.
Until ADA breaks below $0.7315, the bullish bias remains intact. The formation of higher lows and increasing buying interest at dynamic supports adds weight to the long setup. Price reclaiming the $0.85 zone may trigger a fast rally to $0.93, and possibly beyond if market-wide sentiment remains risk-on.

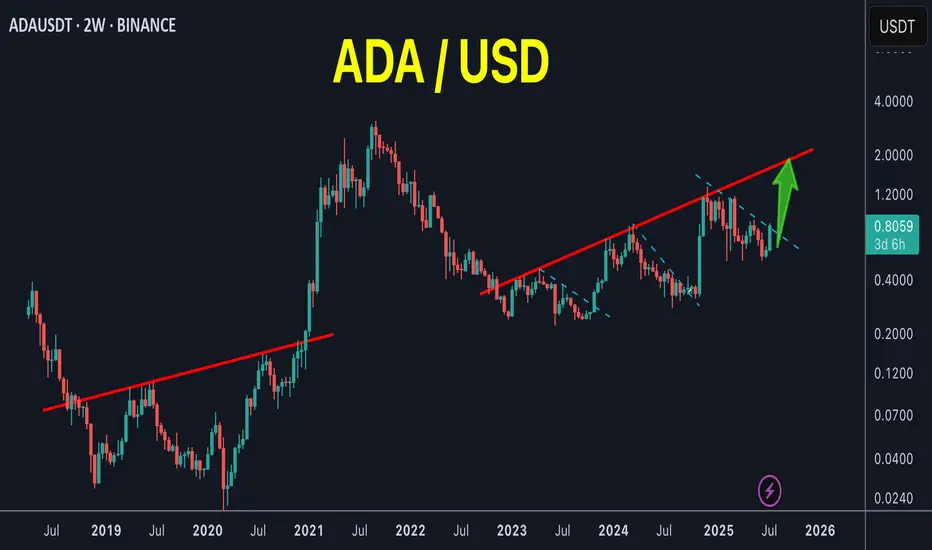
ADA/USDT | Multi-Month Breakout Brewing — a 10x play ?Cardano is quietly mirroring its previous macro cycle — but this time, the structure looks tighter, cleaner, and potentially more explosive.
The multi-month chart reveals a consistent uptrend forming off the 2022 lows, contained within a well-respected ascending channel. The price action shows strong similarities to the 2018–2020 accumulation phase, followed by the breakout that led ADA to its all-time high in 2021.
The current price structure is forming higher highs and higher lows within a channel — a strong bullish continuation pattern.
Volume has been increasing steadily during the up-moves, signaling real demand building underneath.
Fibonacci Extensions from the previous cycle highs and lows show key long-term resistance zones:
1.618 – $4.91
2.618 – $7.79
4.236 – $12.47
These levels could act as major psychological targets if the trend continues to evolve similarly to the last cycle.
⏳ Current Price (~$0.64) is still significantly below previous all-time highs and long-term extension zones — offering a potentially favorable risk/reward setup for patient investors.
⚠️ As always, nothing moves in a straight line — but if you're a macro-mind investor, you’ll start to notice more straight lines than most. Zooming out often reveals the patterns that noise hides.

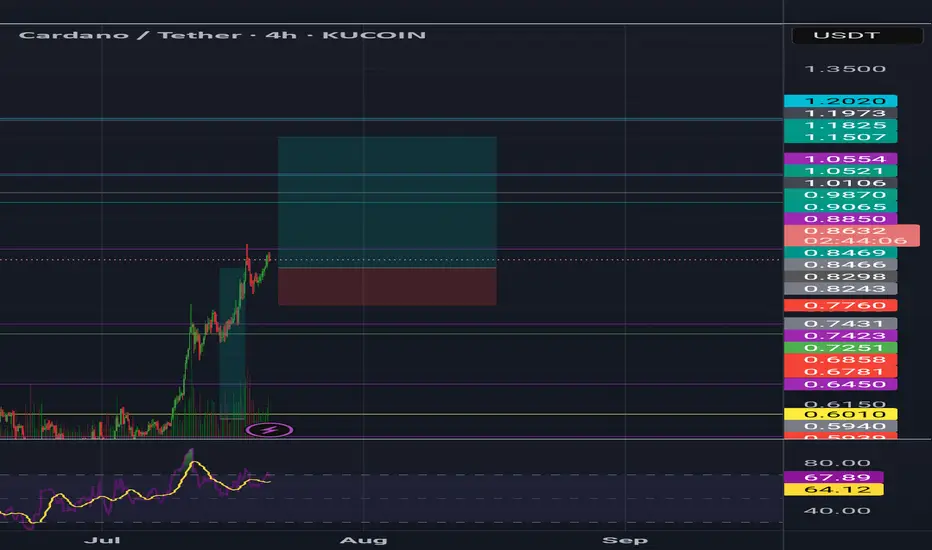
CardanoAda usdt Daily analysis
Time frame 4hours
Risk rewards ratio >4.3
Target =1.15$
Cardano is the Valuable asset in crypto market
CARDANO | ADA Creeping UP to $1Cardano has made a big move in recent weeks, boasting a 77% increase.
If you were lucky enough to buy in around 30 or 40c, this may be a great TP zone:
Looking at the Technical Indicator (moving averages), we can see the price makes its parabolic increases ABOVE - which is exactly where we are currently beginning to trade. This could mean more upside is likely, and the 1$ zone is a big psychological resistance zone:
A continuation of the current correction may look something like this for the next few weeks:
_____________________
BINANCE:ADAUSDT
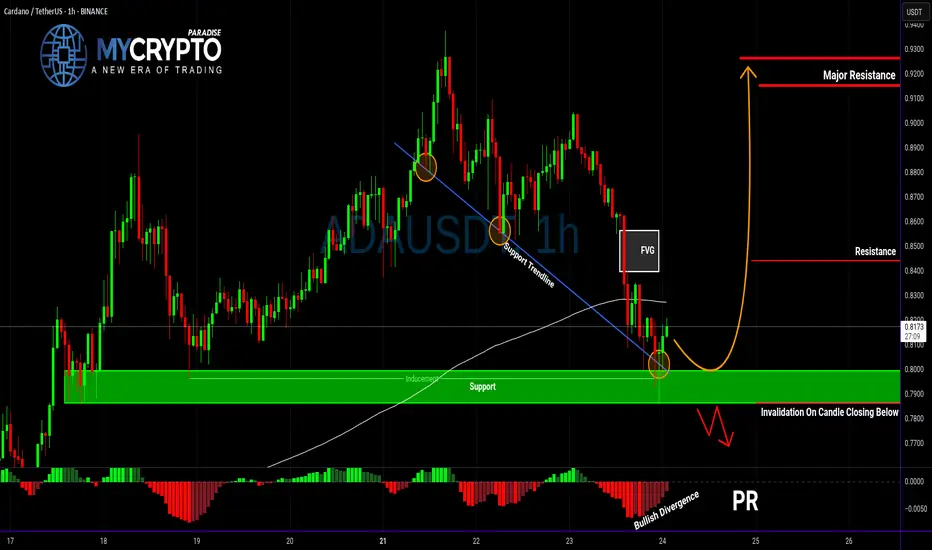
ADA About to Explode or Collapse?Yello Paradisers — is ADA gearing up for a breakout, or are we walking straight into a bull trap? After the recent pullback, the market is throwing mixed signals, but this setup is becoming too important to ignore. Here’s what we’re seeing right now on ADAUSDT.
💎ADA is currently showing positive signs of strength after a solid retracement. Current support zone is not only a historical price pivot, but it's also aligned with a supportive trendline, the 200 EMA, and a developing bullish divergence on the chart. All these factors combined are increasing the probability of a short-term bounce — but that doesn't mean we go in blind.
💎For aggressive traders, entering at the current price might make sense, especially if you’re targeting the first resistance level. However, it’s important to note that this entry offers a relatively limited reward compared to the risk — roughly a 1:1 risk-reward ratio — so it’s crucial to size your position accordingly and keep tight control over your stop loss.
💎If you're looking for a cleaner setup with a better risk-to-reward profile, patience is key. A more favorable scenario would be waiting for a proper pullback and a confirmed retest of the support zone. Ideally, you want to see a strong bullish candle at the support level to signal continuation — that’s when the setup shifts from average to high-probability.
💎But be cautious. If the price breaks down and closes a candle below our support zone, the entire bullish idea becomes invalid. In that case, it’s much wiser to step back and allow the market to develop more structure before re-engaging. Forcing trades in uncertain conditions is where most traders lose, and we don’t want to be part of that crowd.
🎖Strive for consistency, not quick profits. Treat the market as a businessman, not as a gambler. Be patient, Paradisers — only those who follow structured strategies and risk management will thrive in the long run.
MyCryptoParadise
iFeel the success🌴
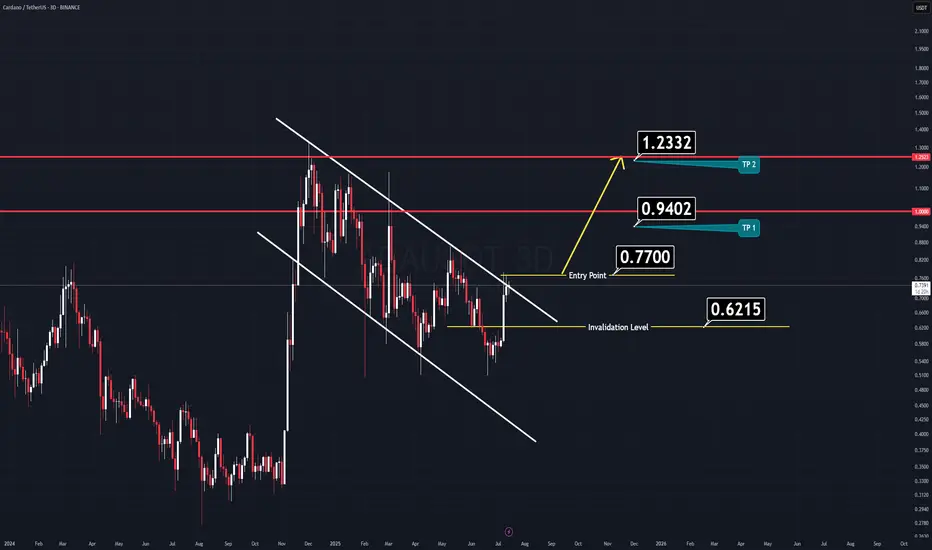
ADAUSDT - Buy or Regret!As clear and simple as the chart is… the target is just as clear and reliable.
ADA is showing strong bullish structure on the 3-day chart — breaking above the red trendline with a successful retest, and also breaking above the 100 EMA.
The blue trendline represents a strong hidden resistance level that many traders are overlooking.
The upside move is likely to end around the 0.786 Fibonacci level, which intersects with this blue trendline — in the $1.50–$1.70 range.
A strong project. A fundamentally sound coin that respects technical analysis.
A logical and high-probability target.
Best regards Ceciliones🎯

ADAUSDT.P m15 : a Short Position fot TP3The price, on its weekly upward path, reacted bearishly to the daily zone and seems likely to take out key lows to collect liquidity (whether for a future decline or rise).
Our trade will be activated after the liquidity Grab, based on trend and horizontal levels

ADA (repeat the pattern)ADA /USDT
ADA keeps repeating its old patterns as it’s clearly obvious in my chart
Breakout is going on lower time frames
Looks like an easy 2X
ADA / USDT lying on support ,ready to bounce and break trendlineADA/USDT broke above horizontal resistance and is now retesting from the trendline above. If it holds this support and bounces, a strong move toward $1.00, $1.20, and even $1.40 could follow. One to watch closely in the coming days.

ADA Analysis (3D)Here’s another clean and straightforward chart, this time on Cardano (ADA).
ADA has formed a large flag pattern, which looks poised for a breakout soon.
Just like the previous setup, nothing complicated here.
✅ Entry Idea:
Consider entering when the price breaks above the previous daily candle’s high.
All the key levels are already marked on the chart for easy reference.
Keep it simple,
Good Luck.
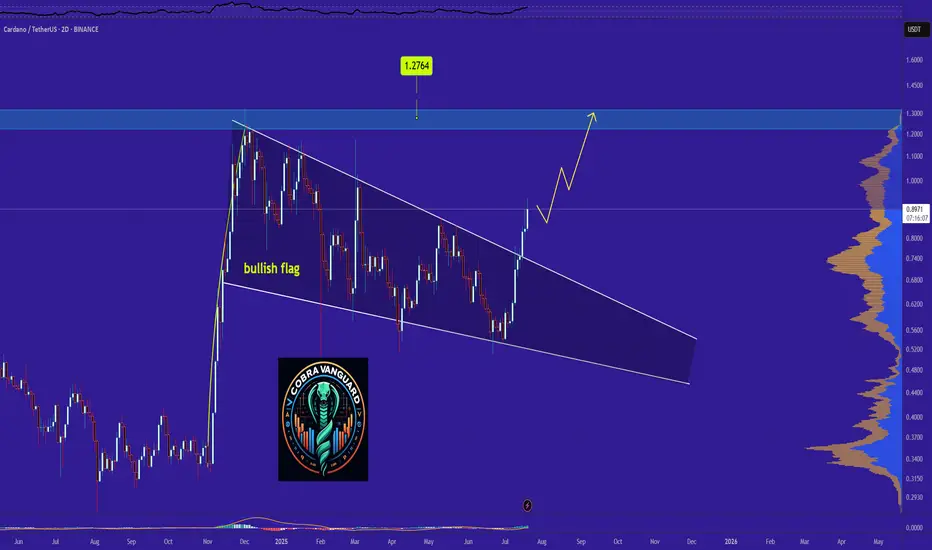
Why ADA Remains Bullish and Its Next Potential Move !The pattern has broken, and now I expect the price to rise to $1.27 . AB=CD.
Give me some energy !!
✨We spend hours finding potential opportunities and writing useful ideas, we would be happy if you support us.
Best regards CobraVanguard.💚
_ _ _ _ __ _ _ _ _ _ _ _ _ _ _ _ _ _ _ _ _ _ _ _ _ _ _ _ _ _ _ _
✅Thank you, and for more ideas, hit ❤️Like❤️ and 🌟Follow🌟!
⚠️Things can change...
The markets are always changing and even with all these signals, the market changes tend to be strong and fast!!
accordion to the moonhows and whys of the trade of way out of your IQ level,I'm an Iranian and i'm not going to make you muricans rich while you bomb my country. if it does break above it first high that it will form it becomes really high probability and that's why i published this.

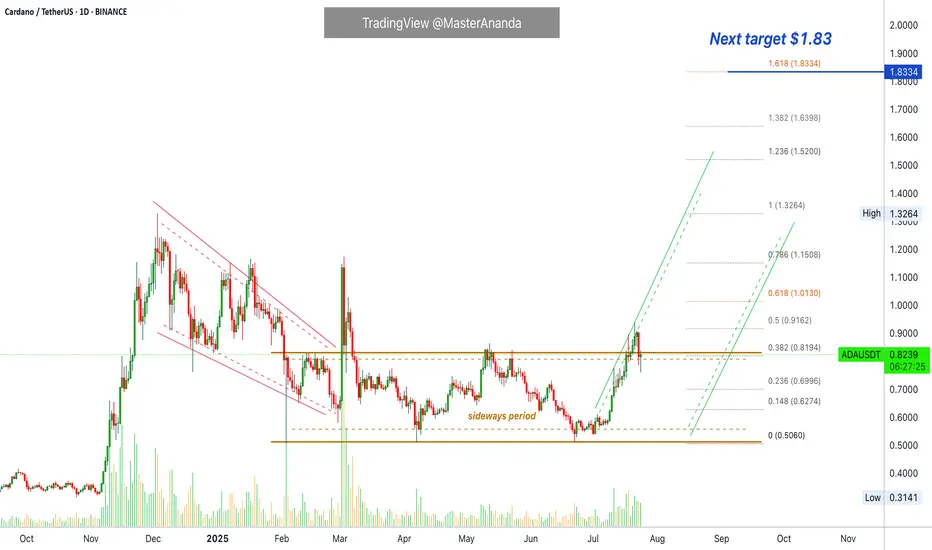
Cardano Update · Straight Up · New ATH & MoreCardano is easy to predict. We already have three great examples. Remember Bitcoin Cash? It has been growing straight up for 100+ days. Cardano will do the same. What about XRP? It is already trading at new all-time highs and Cardano is in the same group/category; big market capitalization. Then we have Ethereum which is the most recent example, as predicted, it is moving straight up. No retrace nor correction which is normal because it went sideways for months before the current bullish breakout.
Cardano has now four green weeks and this is the fifth one. This one will not be red which means straight up.
Technical analysis
I already told you about EMA55 and EMA89, weekly timeframe, ADA is trading above. MA200 as well. Notice the descending triangle on this chart. This was the consolidation period and it already broke bullish.
Targets & new all-time high
Expect ADA to continue growing until it hits the highest prices since 2021. $1.83 and beyond. Once this level is conquered, we can start rooting for a new all-time and this will happen with a high level of certainty.
Cardano will easily reach $3 and move beyond $4. I think it can go much higher...
I will do a new publication with updated new all-time high projections. The targets above are valid for the coming months.
Just a friendly update.
And thank you for your continued support.
(If you enjoyed this post, follow!)
Namaste.

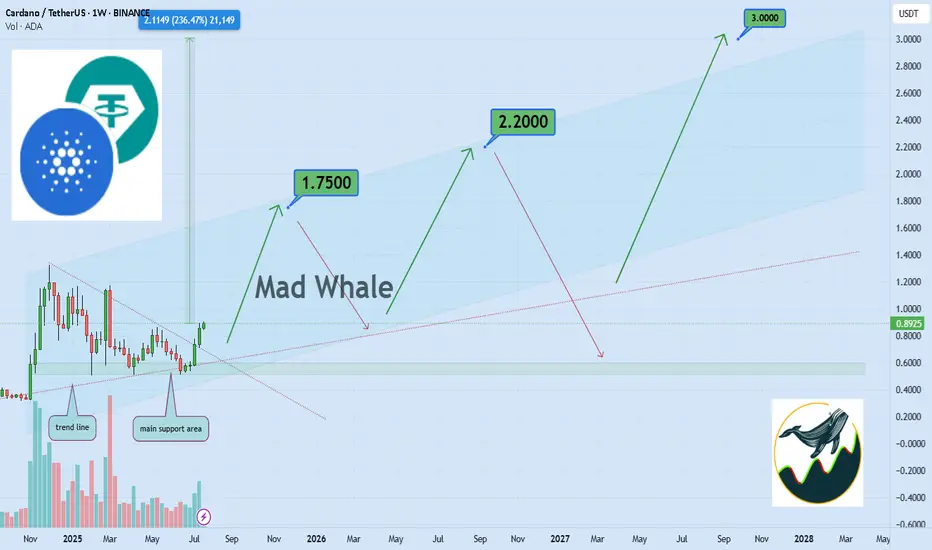
Bullish Cardano Setup: $1.75, $2.20, $3 Price TargetsHello✌
Let’s analyze Cardano’s upcoming price potential 📈.
BINANCE:ADAUSDT , I expect a long-term upward bullish trend.
There are three main targets in this analysis: $1.75, $2.20, and a final target of $3. These targets could be reached within 2 to 6 years.
The current bullish channel may stay valid and continue moving upward.
✨We put love into every post!
Your support inspires us 💛 Drop a comment we’d love to hear from you! Thanks , Mad Whale🐋
🐋Many of the points and levels shown on the chart are based on personal experience, feeling, and over 7 years of research and daily study of crypto charts.
Some of the lines, channels, and price zones are drawn to make the chart easier to understand and to help imagine possible future price movements.
I’ve also included one very big drop in price even bigger than the others because in the crypto market, it’s common for prices to suddenly fall hard and push out small investors and traders with positions.
The targets on the chart are not guaranteed; they might be reached, or they might not.📚
📜Please make sure to do your own research before investing, and review the disclaimer provided at the end of each post.
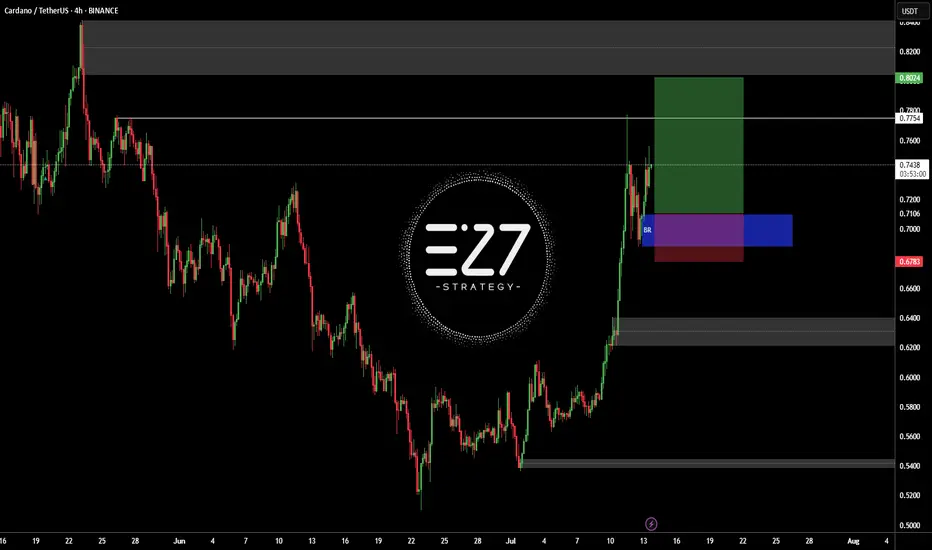
ADAUSDTBINANCE:ADAUSDT in up-trend and my open position buy in latest sowing low.
Best entry: 0.6952 - 0.7259
Target: 0.7754 - 0.8024
Stop loss: 0.678
Please control RISK management
Cardano Update · What Happens Now?I am going to assume that you read the XRP update I just published. While these are different pairs, my updates and publications are all related because I look at the entire market—for you—as a unit.
The situation with Cardano is different to XRP. Why? Because XRP already broke its previous bullish wave high while Cardano hasn't. This first tells us that Cardano has more room for growth and has less risk from a buyers standpoint. It can also be seen as Cardano being weaker or lagging behind in someway but I wouldn't give credit to this interpretation. The truth is that the market moves in unison but not at the exact same time.
May's high, reached first from the 7-April bottom, has been challenged but confirmed as resistance. This won't last long. It has been confirmed as resistance and we can easily see it by yesterday's red candle. This is normal. If you look at 14-July and 12-July, these days were also red yet Cardano continued growing. You can expect the same.
We can have one day red, two red days, three red days and nothing changes. The market is set to grow, is growing and will continue to grow in the coming weeks and months. Long-term growth and even beyond months. There is the possibility of growth extending to years similar to Bitcoin.
When a huge wave develops, we get a half year strong correction, a major higher low compared to the start of the phase followed by additional growth.
Let's get back to today and what is happening now.
ADAUSDT managed to break above MA200 16-July, just three days ago. This confirms a long-term growth process; it is now confirmed. This means that Cardano is on track to grow for 3-6 months minimum.
What we are seeing now is only the start of a major advance and the continuation—on a long-term basis—of the move that started in late 2024.
You can rest easy, sleep easy while you watch your profits grow. Cardano will continue growing, it will do great; you have my word.
Thank you for reading.
If you enjoy the content leave a comment just for this one, I will be sharing updates for you now, today, yesterday, tomorrow and for years to come.
Namaste.
Major Move Ahead for ADA – Breakout or Breakdown?
🔍 ADA/USDT Analysis – Dual Scenario Setup (BUY & SELL)
Currently, ADA is ranging between major supply and demand zones. Two clear scenarios are in play depending on how price reacts to key levels:
📈 Bullish Scenario (Long):
Entry: On breakout and confirmation above $0.6027
Target: $0.869 (major resistance zone)
Stop Loss: Below $0.523
Trigger: Break of descending trendline and solid structure above $0.6027
📉 Bearish Scenario (Short):
Entry: Around $0.5120 (rejection from supply zone)
Target: $0.315 (strong demand zone)
Stop Loss: Above $0.6027
Trigger: Failed breakout and rejection from $0.5120 level, with confirmation below it
📌 Based on the descending channel structure, this might have been the final leg of the downtrend, and a reversal to the upside could be underway. However, for confirmation, we prefer to wait for stronger price action signals before fully committing.
🛑 Always use risk management. Market remains bearish until proven otherwise.

From Liquidation to Withdrawal, It’s the MapDo you remember your first heavy loss? That exact moment when you realized trading isn’t just about patterns and candles?
This analysis is for you if you’re looking for a path to escape that liquidation pit and actually make your first real withdrawal.
No hype, no signals just a practical roadmap built on experience and mistakes.
Hello✌
Spend 3 minutes ⏰ reading this educational material.
🎯 Analytical Insight on Cardano:
BINANCE:ADAUSDT is testing a crucial daily support near the 0.38 Fibonacci retracement level, setting up for a potential 16% upside toward the key psychological and monthly resistance at $1. If this level holds, ADA could confirm bullish momentum and target higher levels soon. 📊🚀
Now , let's dive into the educational section,
🧭 It All Starts With the Tools
Before anything else, you need a compass and in trading, that compass is made of tools you can actually use on TradingView.
Here are some tools that serious traders never ignore, especially when analyzing crowd behavior and institutional traps:
Volume Profile (Fixed Range)
Shows you where money is actually concentrated, not just where price is. High-volume nodes often become breakout or breakdown zones in days ahead.
Liquidity Zones – Custom Indicators
Search for "liquidity" or "order block" in the Indicators section. There are tons of free community scripts that help you spot stop-loss clusters the exact places where the market loves to hunt.
Relative Volume (RVOL)
Tells you how strong the current market move is compared to its average volume. Is this a real breakout, or just noise? RVOL helps answer that.
Session Volume & Time-Based Boxes
Use drawing tools to box London, New York, or Asia sessions. This lets you track where real money enters. Time matters volume without time is meaningless.
Got the tools? Great. But now what? Let’s walk the path...
🚪 The Entry Point: First Liquidation
Almost every trader starts here: a signal, a rushed entry, a tight stop... then liquidation or a brutal margin call.
But that exact moment? It’s not your failure. It’s the beginning of your real journey.
Ask yourself:
Why did I take that trade?
What tool was available but ignored?
Was my position size reasonable or emotional?
Analyze this moment deeper than you analyze Bitcoin’s chart.
🔁 Repeat or Reroute?
This is the loop most traders never escape.
They stay stuck between losses because they don’t reflect, don’t learn, and don’t adjust.
What you should do instead:
Start a trade journal raw and honest.
Use TradingView as your lab, not just a chart. Practice, backtest, fail, and fix.
🧠 Turning Point: Where Your Mind Starts Trading
Once you stop chasing profit and start chasing clarity, things shift.
You begin spotting real triggers, real volume, and real market intent.
Here’s where tools become meaningful:
Use OBV to confirm volume alignment
Let RSI tell you about weakness before reversal
Follow EMA50/EMA200 to map trend structure
Not because someone told you to but because now you know why and when to use them.
🤑 The First Real Withdrawal Isn’t From Your Wallet
The first "withdrawal" isn’t a bank transfer.
It’s when you can walk away from the market without FOMO, without guilt, and without overtrading.
You now:
Accept risk, every single trade
Respect the market, not fear it
Have patience not because you're lazy, but because you understand timing
That’s the real payout.
📌 Final Thoughts
The path to becoming a trader starts with loss, grows with tools, and ends with discipline.
TradingView isn’t just for charts it’s your practice field.
Before chasing the next win, start by understanding your last mistake.
✨ Need a little love!
We pour love into every post your support keeps us inspired! 💛 Don’t be shy, we’d love to hear from you on comments. Big thanks , Mad Whale 🐋
📜Please make sure to do your own research before investing, and review the disclaimer provided at the end of each post.

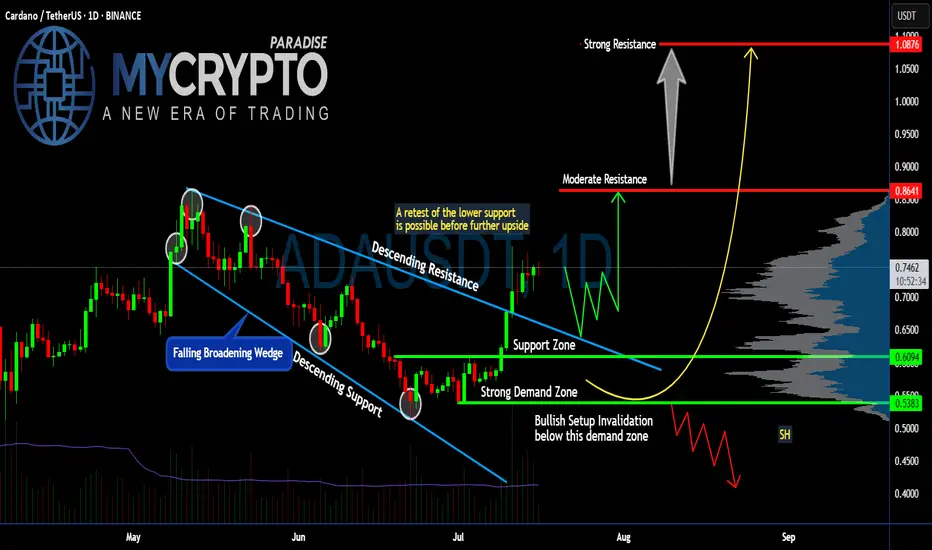
Is #ADA Ready For a Major Move or a Trap is Ahead? Watch this Yello, Paradisers! Is this breakout on #Cardano the start of a major upside move or just another bull trap waiting to flush out impatient traders? Let’s break down the latest #ADAUSDT setup:
💎After weeks inside a falling broadening wedge, #ADA finally broke above the descending resistance, signaling a potential trend reversal. The breakout above $0.70 has pushed the price toward the current $0.74 zone. The soaring volume and a positive broader market outlook reinforce our bullish bias. While this looks bullish, the key question is whether #ADAUSD will hold above its reclaimed support or retest lower levels first.
💎The structure is straightforward: #ADA reclaimed the support zone around $0.70 after bouncing strongly from the demand zone near $0.61–$0.60. This demand zone remains the critical area to watch—any healthy retest here would provide a high-probability continuation setup for bulls.
💎If buyers maintain control, the first target sits at the moderate resistance of $0.86. That’s where the next notable selling pressure is expected. But the real battle will take place near the strong resistance at $1.08—a zone where major distribution and profit-taking could occur.
💎However, the bullish setup becomes invalid if #ADAUSD loses the $0.61–$0.60 demand zone. A confirmed close below $0.538 would flip the structure bearish, signaling a potential continuation to lower lows.
Stay patient, Paradisers. Let the breakout confirm, and only then do we strike with conviction.
MyCryptoParadise
iFeel the success🌴
Cardano: Still Boring or Finally Ready to Move?🧐🔁 Cardano: Still Boring or Finally Ready to Move? 🚦📈
Welcome to the Altcoin Series, kicking off this weekend with none other than Cardano (ADA).
Later on I will explain why i will be 'Divorcing Alts' and just trade them, but that time will be at the cycle end, not now.
It’s Saturday, July 12th — a classic retail weekend after a solid macro pump. Salaries are hitting accounts, the charts are alive again, and it's time to look at structure over sentiment.
🔍 A Personal Note on ADA
I was fortunate to exit near the top during the Cardano Summit in Athens (2021) — not just due to chart structure, but after meeting with developers and understanding how deeply Haskell shapes this ecosystem. And what a challenge that seemed!
Haskell, while academically impressive, has proven difficult to scale, and in practice, it's slowed down development. Expectations were sky-high, but reality hit hard. And let’s be honest — Cardano has been boring for years.
But that boredom may be hiding something...
I’ve still been 'going Long' under key levels, because when you zoom out — Cardano is still U.S.-centric , regulation-aware, and deeply rooted . In a time when the U.S. might look to lead crypto adoption, especially with figures like Trump signaling support , Cardano could become part of that narrative.
⚙️ Technical Setup
The recent pump from Nov–Dec 2024 was rejected right at $1.193 — our second test of that critical resistance. But now, we’re staring down a potential third test, with Test #3 marked on the chart near $1.15, and this time, the context is shifting.
✅ TOTAL3 structure is bullish
✅ Retail energy is back
✅ Altcoin momentum is quietly building
🔑 Key Levels
Support Zone:
🟢 $0.70–$0.71 — the current base to hold
Target Zones:
🔹 $1.15–$1.19 — Third test of resistance
🔹 $1.47
🔹 $1.89
🔹 $3.02
🔹 Top Extension Target: $3.65
A break above that descending level could turn this "boring" coin into one of the cleanest long continuation setups of the cycle.
📌 We trade technicals, not hope:
✅ Buy over support
✅ Exit under resistance
✅ Control risk, always
So… will Cardano keep boring us? Or is it finally time for a show?
One Love,
The FXPROFESSOR 💙

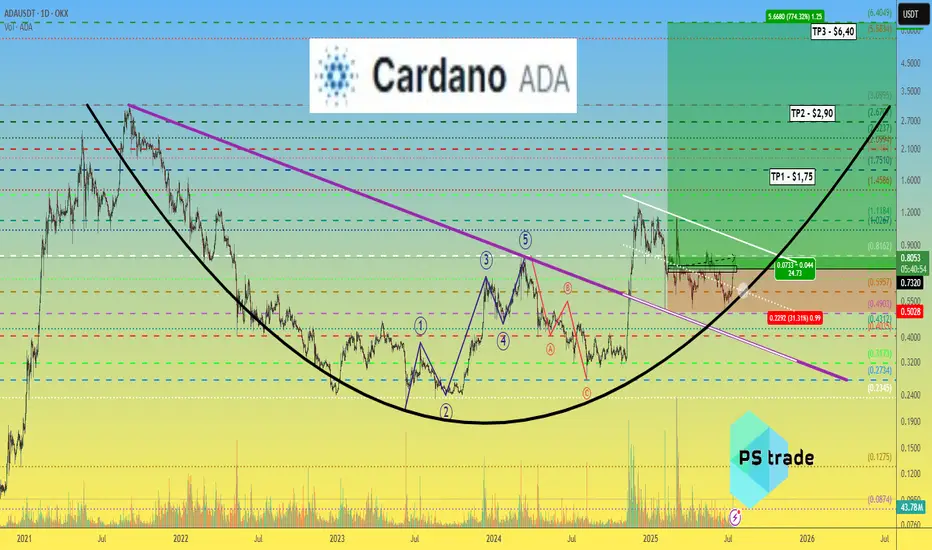
Cardano ADA price analysis🪙 Five months ago, we published a medium-term trade for CRYPTOCAP:ADA , and the price still remains in the buying zone.
With the current growth, the price of OKX:ADAUSDT remains in consolidation, and when the correction begins, it would be very good if it stayed above $0.60.
😈 If you still have faith in the prospects of the #Cardano project, you can continue to hold or even buy #ADA during the correction.
Well, theoretically possible targets for the #ADAusd price are:
TP1 - $1.75
TP2 - $2.90
TP3 - $6.40
_____________________
Did you like our analysis? Leave a comment, like, and follow to get more