ADA ADA / USDT
One of US coins that are showing strength in these days along with Trump inauguration (ie XRP - HBAR - ALGO ) i think it can follow them soon
Looking at high time frame we can see something like that in coming weeks / months
NFA
Best of wishes
ADAUSDT

ada going up Ada did Not done yet lets c where it can reach>
T1 1.25
i don't think it will hold the 1.3 . but we will c .

ADA BUY!Hello friends
due to the failure of the downward structure and the good upward movement, now it is possible to buy a step in the specified supports and move with it to achieve high goals with capital management.
*Trade safely with us*

Cardano on the Edge: Breakout AlertADA is currently trading within a symmetrical triangle, a pattern that typically signals market indecision. The price is tightening as it moves between an upward-sloping support line and a downward-sloping resistance line. Currently the price is testing a descending resistance line.
After making its new all-time high at $1.3264 the price is also trading within a range support zone Green at $0.8140 - $0.8416 and the resistance zone Blue at $1.1074 - $1.1567. A breakout above the resistance zone Blue and the symmetrical triangle with volume and daily candle close above could move the price towards the new all-time high, if the momentum continues Cardano (ADA) would make new highs.

CRYPTO. Buying opportunitiesHello everyone!
Let's take a look at the following crypto assets. They have formed patterns that increase the likelihood of price growth. Buyer zones have formed on all assets (green rectangles on the charts) and buyer's current vectors.
The nearest targets are indicated on the charts:
1. BTCUSDT
Potential long target: 102,724.38. +2.94%
2. ADAUSDT
Potential long target: 1.1819. +11.63%
3. AAVEUSDT
Potential long target: 390.15. +24.67%
4. LINKUSDT
Potential long target: 25.99. +19.58%
5. AVAXUSDT
Potential long target: 45.05. +14.68%
6. TRXUSDT
Potential long target: 0.2596. +9.26%
Wishing you all successful trades and a profitable day!

Old ADA giant continues to move!ADA like other legacy assets has shown good growth. I believe that such coins will not show crazy growth anymore. The global market maker has been accumulating assets and is playing its cards. This is the main reason why old coins started to rise. Regarding ADA here we can fixation above 50 EMA on daily timeframe, which confirms bullish movement further. We are also pushing back from the support zone, which was resistance a couple months ago. I would expect ADA to rise to the 0.718 Fibonacci level area. That's a pretty good target for such a project.
Horban Brothers.

SUIUSDT 8H : NICE ENTRY FOR LONG Hello, good day
As you can see, we are in a long-term bullish channel.
Given the low liquidity and good order block in the 4.3 range, I expect such a move.
SecondChanceCrypto
⏰ 15/Jan /25
⛔️DYOR
Always do your research.
If you have any questions, you can write them in the comments below and I will answer them.
And please don't forget to support this idea with your likes and comments.

CARDANO ADA Retesting SeekingPips' KEY PRICE LEVEL🟢Identifying key PRICE LEVELS is key to finding great trading OPPORTUNITIES however SeekingPips' OPINION is that PRICE ALWAYS comes SECOND TO TIME.
ℹ️ If there is REALLY A SECRET SAUCE to trading that is it.
🟢 SeekingPips says "TIME then PRICE" ALWAYS.👌
🌍 FOLLOW NOW TO SEE OUR LATEST IDEAS🌎

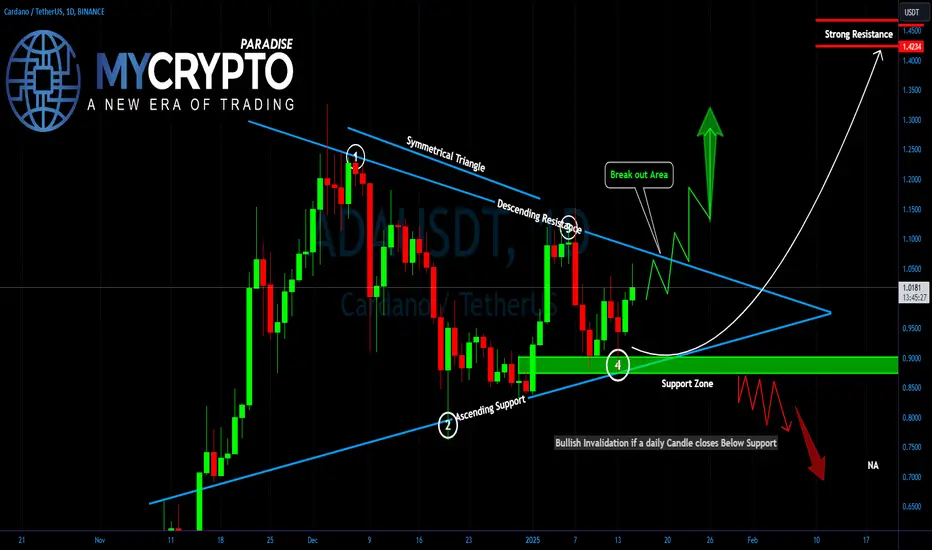
Is ADA About to Explode or Collapse? Key Levels You Can't IgnoreYello Paradisers! Are you watching Cardano (ADA)? If not, you might miss one of the most decisive moments in recent weeks. The symmetrical triangle forming on the daily chart is nearing its breaking point, and when it does, we could see an explosive move.
💎#ADAUSDT is currently trading within a symmetrical triangle, a classic pattern that indicates market indecision. The price is compressing between an ascending support line and a descending resistance line, creating a tightening range. This formation suggests that a breakout or breakdown is imminent, and Paradisers should be prepared for either scenario.
💎On the bullish side, the resistance zone between $1.0660 and $1.0774 is the key level to watch. A breakout above this range, confirmed by a daily close and increased volume, could ignite a powerful move toward $1.25, $1.35, and even the $1.4469 region, where we see significant historical resistance. Such a breakout would confirm bullish momentum and potentially attract new buyers.
💎Conversely, the support zone between $0.8970 and $0.8756 is a critical level for the bulls to defend. A breakdown below this zone would invalidate the bullish triangle and open the path for a sharper decline.Wait for a clean break of either resistance or support before committing to a position, and always trade with a proper risk management plan in place.
Discipline, patience, and a clear strategy will always set you apart from the herd. Let the market reveal its direction, and act decisively when it does. Be a pro, Paradisers!
MyCryptoParadise
iFeel the success🌴
ADAUSD BUY LONG ADA when TIME & PRICE MEETSeekingPips Shows Once Again That TIME trumps PRICE ADAISD

ADAUSD What does SeekingPips think? ADA Key PRICE what about TIMAs you know my now SeekingPips often consider TIME more important than PRICE when analysing any TIME and PRICE chart.
🟢 There is no difference here with ADA.
ADAUSD is not really something that has really been on our radar but NOW THINGS MIGHT CHANGE.
⭐️TIME & PRICE have met in a crucial space and SeekingPips likes what he sees.⭐️
🟢 The next 9 hours are very important for the longer term PRICE on this.
🟢 Our key level is shared on this chart.
Currently favour the long side but we have no valid trigger to get involved.
🟢 SeekingPips will be watching this one closely this morning.
✅️ Have a GREAT DAY & Like Always Manage Your Risk and the PROFITS will take care of themselves.
⭐️ PLEASE LIKE AND FOLLOW SEEKINGPIPS NOW FOR OUR LATEST ANALYSIS⭐️

pain before gainwe're looking to finish the abcde structure to the downside before we make any updside gains. The h/s pattern is also pointing to the initial drop with sustained bearish trend to follow.

ADA Outlook after the Dip. What to expect NOW ?As you can see, the price is forming two bullish patterns on the DAILY timeframe. I expect the price to rise to the top of the triangle to complete the handle of the cup and handle pattern. If my view is correct, Cardano will rise to $1.25 .
And if this pattern is correct and breaks, higher targets are possible.
Give me some energy !!
✨We spend hours finding potential opportunities and writing useful ideas, we would be happy if you support us.
Best regards CobraVanguard.💚
_ _ _ _ __ _ _ _ _ _ _ _ _ _ _ _ _ _ _ _ _ _ _ _ _ _ _ _ _ _ _ _
✅Thank you, and for more ideas, hit ❤️Like❤️ and 🌟Follow🌟!
⚠️Things can change...
The markets are always changing and even with all these signals, the market changes tend to be strong and fast!!

BTCUSDT 4H :Very important Area(120k or 77K)Hello, good day
According to the analysis we had, the liquidity below $90,000 was hunted with a quick move. And according to the analysis, we reached the very important area at 95,000 and 96,000 again. According to the USDT chart, I expect us to experience a short-term correction and then move to break the resistance at $96,000. The target for the first step of the rise could be 108,000.

H/S, down to .80The H/S should take us down to low .80 cents region. It's likely that we dip further. Levels to watch will be every 5 cents down from 80. 75, 70, 65, 60

ADA - The reason of AcidityThe time when i drew the purple line it fell like a gud boi. Now when people will think okay its a head and shoulder lets short it with our house that moment it goes up, follow the green line. Aiming for 1.1826. Direction marked as long but wait for retracement.

ADA GOING DOWN ?In the long and short term, it's unsafe to buy. I think it will get to around 0.75 / 0.79. Good luck, everyone!

Which way ADA: Break down or Sideway...sIf you find this information inspiring/helpful, please consider a boost and follow! Any questions or comments, please leave a comment!
ADA Pattern Analysis: Key Levels and Scenarios
$1.20 Rejected Before Reaching
Cardano (ADA) recently made an attempt to push higher but failed to reach the $1.20 resistance level, resulting in a rejection. This rejection highlights $1.20 as a key barrier for the bulls. A successful break above this level in the future will likely require significant momentum and increased volume to confirm a continuation of the uptrend.
Move Up Didn’t Hit the 80% Retrace → Flat/2x3 Ruled Out
The recent upward move failed to reach the 80% retracement level, effectively ruling out the possibility of a flat correction or a 2x3 pattern. These structures typically require a deeper retracement to remain valid. With these possibilities eliminated, attention shifts to other likely scenarios that fit the current price action.
Likely X of 2xZZ or B of a Triangle/1 of Diagonal
The failure to hit the 80% retracement brings a few potential patterns into focus:
X of a Double Zigzag (2xZZ): ADA could be forming a complex corrective structure, with the current move acting as another actionary wave to a most likely break of the W pivot. X waves can be anything, depending, but a ZigZag is the most likely.
B of a Triangle: The price action may reflect a triangle formation, with ADA consolidating within a bounded structure before resolving either upward or downward.
1 of a Diagonal: The possibility of a Ending diagonal suggests the end of a trend.
$0.76 (BCC) Critical
The $0.76 level has emerged as the Bearish Count Confirmation/Conversion (BCC), a critical pivot for determining the pattern printing. Holding above $0.76 indicates that ADA is likely entering a sideways consolidation phase, building a base for the next significant move. A break below this level would signal potential weakness, invalidating some of the bullish scenarios and shifting the bias toward a more bearish outlook.
Conclusion
The $1.20 resistance rejection underscores the need for stronger momentum to break higher, while the $0.76 level serves as a key support. Observing price action at these levels will help determine whether ADA is in an X wave of a double zigzag, a B wave of a triangle, or the early stages of a diagonal.
Patience is key as these patterns develop.
Trade safe, trade smart, trade clarity.


ADA on high time frame
"Regarding ADA on the high timeframe, the chart indicates that recent candle formations and analysis suggest that the price has swept liquidity and is poised for an upward movement. Depending on your strategy as a holder or trader, consider buying in anticipation of higher prices."

ADAUSDT"In this analysis, I aimed to examine the entire structure of Cardano from the beginning. I identified that we are currently within a corrective structure, and the current position appears to be the third wave of this correction. I anticipate that it may unfold as a Diametric pattern. Follow me to stay updated as we track this structure!"

BUY ADAhello friends
According to the support range we are in, we can enter into a purchase transaction with capital management.
*Trade safely with us*

I think I have drawn a flawless painting !!! As you can see, the price is forming two bullish patterns on the 4-hour timeframe. I expect the price to rise to the top of the triangle to complete the handle of the cup and handle pattern. If my view is correct, Cardano will rise to $1.5 . so I think I have drawn a flawless painting!!!!!
Give me some energy !!
✨We spend hours finding potential opportunities and writing useful ideas, we would be happy if you support us.
Best regards CobraVanguard.💚
_ _ _ _ __ _ _ _ _ _ _ _ _ _ _ _ _ _ _ _ _ _ _ _ _ _ _ _ _ _ _ _
✅Thank you, and for more ideas, hit ❤️Like❤️ and 🌟Follow🌟!
⚠️Things can change...
The markets are always changing and even with all these signals, the market changes tend to be strong and fast!!
