ADA Daily Update · Moving Averages · 262% Target ExposedGood morning my fellow Cryptocurrency trader, I know you are having a wonderful day because the market is doing great. We looked at Cardano together on the weekly timeframe and this is a big picture but what about short-term? Where are prices headed next? The next target, resistance/support and the moving averages of course.
I've been looking at the moving averages lately and this is a theme that I will continue for a few days, or weeks, once we exhaust it we use other indicators. You know we also like the RSI and MACD, candlestick reading, volume, chart structure, chart patterns, market cycle, etc. Marketwide action, subtle signals, market sentiment, on and on.
Cardano is already trading above many major moving averages but this is a recent event. First consider the fact that in late 2024 ADAUSDT grew 320% right after breaking above the same EMAs that I am showing you now.
ADA closed just recently above EMA89, EMA233, EMA55, etc. Only MA200 is missing and this is an important one but will soon break. I am not showing it here because the action is still happening below.
There is a rounded bottom. This alone is a reversal signal already confirmed because the action is happening above the base of the pattern. In April we had a triangular bottom and here we can see an alternation. In February it was a straight line. A straight line, a triangle and then a circle; interesting.
The bullish bias is confirmed and we are seeing straight up, the next target is 0.8194. Cardano has been green four days straight. Go back to November 2024... The possibility exist for continued growth. Day after day after day. At some point there will be a stop, can be a retrace or correction. Know that when this stop happens it is not the end. There will be several stops along the way but we are set for a strong new all-time high. You will need to be patient while holding but just make sure to aim high. Don't get greedy of course. If at some point you start to feel anxious, read on the topic, go out into nature or simple sell a small portion until you feel better. The best choice is to be prepared and this can be done by studying the charts and the market. If you have a good plan and a nice map you will do fine. If you are an advanced trader, I am sorry, let's get back to the chart.
$1.01, $1.30, $1.15. These are all resistance. So there will be some challenge around this price zone. Once it is conquered though the advance should be swift until 1.83. Another stop and then 2.65 which is the main target for 262%. Depending on how this level is handled we will update the chart and the targets. For higher targets look at earlier analyses or those on the weekly timeframe.
Thank you for reading.
Namaste.
ADAUSDT

Cardano Forming Potential Reversal Structure Inside TriangleHello guys!
Cardano’s been stuck inside this big descending triangle for months. We had a fake breakout a while back that totally failed.
Now, price is back at support and showing bullish divergence. That’s usually a sign sellers are getting tired.
If buyers step in here, I’m expecting a move back up toward 0.67–0.70 (top of the triangle). But if it loses the 0.53 support, that setup’s off the table.
Bias: Leaning bullish
🎯 Target: 0.67–0.70
Invalidation: Clean break below 0.53
Let’s see how this plays out.

ADA/USDT : ADA Rally in Motion – Over 20% Gain and More to Come?By analyzing the Cardano (ADA) chart on the 3-day timeframe, we can see that after revisiting the $0.57 zone, the price once again followed the previous analysis and encountered strong buying pressure—rallying up to $0.61 so far.
The return from the previous entry has now exceeded 8%, and the overall gain from the full move stands above 20%.
The next bullish targets are $0.76, $0.93, $1.05, and $1.33.
(A deeper and more detailed analysis is recommended for long-term investment decisions.)
THE MAIN ANALYSIS :

Cardano Ultra Bullish Confirmed, $1.83 Next (Easy) TargetThis is it. This is the signal you've been waiting for and the strongest possible signal across the Cryptocurrency market. Cardano is now moving above MA200 on the weekly timeframe, on a full green candle, as Bitcoin produces a very strong new all-time high. Simply put, this is the best ever.
Cardano has been testing the same low since early February, for five months. Five months and this support held nicely and now the action is turning green. The correction is over; consolidation is over, now comes the resumption of the bullish wave.
The bullish wave will produce a major, major, higher high compared to early December 2024, a target of $1.83 in the coming months and this is not all. This is not the end of the bull market nor the bullish wave, this is just the start, mid-portion, we are set to experience growth long-term.
You can go all-in now. The altcoins bull market is already confirmed. Bullish momentum will start to grow. Feel free to buy and hold.
Thanks a lot for your continued support.
Namaste.

TradeCityPro | ADA Eyes Breakout from Bearish Channel Top👋 Welcome to TradeCity Pro!
In this analysis, I want to review the ADA coin for you. The Cardano project is one of the oldest and most popular projects in crypto.
🔍 The coin of this project has a market cap of 22.21 billion dollars and is ranked 10 on CoinMarketCap.
📅 Daily Timeframe
On the daily timeframe, ADA is moving downward within a descending channel and is currently trying to break out of the channel from the top after reaching a support zone.
⭐ One positive sign for buyers is that they didn’t let the price reach the bottom of the channel. Instead, they used the overlap between the midline of the channel and the key 0.5579 zone (marked as a support area) to stop the price from falling.
✨ However, as long as the coin is fluctuating inside this channel, the trend remains bearish. Holding the midline is not a sign of trend reversal yet, but it does indicate weakening of the current trend and may act as one of the bases for a future reversal.
✅ Looking at the RSI oscillator, we can see that each time the price tried to break the channel’s top, RSI reached the 70 area and got rejected, causing the price to drop.
⚡️ Currently, the price is very close to the top of the channel, but RSI has just broken above the 50 line and is moving upward. This is a bullish sign for buyers, as it shows there is still room for upward momentum, which increases the chance of a breakout.
🎲 The nearest trigger for confirming the breakout from the channel is the 0.7212 zone, which is a bit far, and the price will likely form a higher low and high before reaching it, confirming the breakout earlier.
💥 But based on the current data, the breakout trigger remains at 0.7212, and for spot buying, this is the first valid entry level.
👀 Personally, I’m not adding any altcoins to my portfolio right now, as Bitcoin Dominance is still in an uptrend. As long as this trend continues, large capital flows into altcoins are unlikely.
🛒 More reasonable triggers for spot entries would be a breakout above the 0.8414 supply zone. If I were to buy, I’d enter at this level. The final trigger is 1.1325, which is quite far from the current price, and if BTC Dominance continues upward, it could take several months to reach this zone.
🔽 If you already hold this coin in spot, your stop-loss can be set at a break below the 0.5579 level. A breakdown here would also provide a good short setup in futures, as the price could move toward the bottom of the box or the static level at 0.4322.
📝 Final Thoughts
This analysis reflects our opinions and is not financial advice.
Share your thoughts in the comments, and don’t forget to share this analysis with your friends! ❤️

ADA/USDT Ready to Explode? Watch This Symmetrical Triangle
🧠 Detailed Technical Analysis:
Cardano (ADA) is currently consolidating within a well-defined Symmetrical Triangle pattern on the 3-day chart. This pattern is formed by a series of lower highs and higher lows, indicating compression and indecision in the market — a classic setup for a strong breakout in either direction.
Price has recently bounced off the lower boundary of the triangle and is now heading toward the resistance trendline. A breakout from this structure could trigger a powerful bullish move if confirmed with volume.
🔼 Bullish Scenario (Upside Breakout):
A confirmed breakout above the descending trendline (~$0.65) with strong volume would indicate buyers regaining control.
Key upside targets based on historical resistance zones and the triangle's height:
🟡 $0.8144 – First major horizontal resistance
🟡 $0.9386 – Mid-range resistance from March 2025
🟡 $1.0920 – Former distribution zone
🟡 $1.2118 – Medium-term bullish target
🔵 $1.3264 – Key structural high from previous cycle
🔔 A breakout from a symmetrical triangle often leads to significant price action due to the long period of coiled pressure release.
🔽 Bearish Scenario (Breakdown):
If ADA fails to break above $0.62–$0.65 and gets rejected from the upper boundary of the triangle, the price could:
Revisit the lower trendline support around $0.55
A breakdown below this zone could lead to:
🔻 $0.48
🔻 $0.39
🔻 $0.2756 – A major psychological and historical support level
⚠️ This scenario would invalidate the bullish structure and potentially resume the mid-term downtrend.
📐 Pattern Breakdown – Symmetrical Triangle:
Pattern Duration: ~6 months of consolidation (Feb – July 2025)
Support Zone: $0.55 – $0.60
Resistance Zone: $0.65 – $0.75
Breakout Confirmation: Requires strong bullish candle close with increased volume
Volume Profile: Decreasing, typical of symmetrical triangle before explosive move
💡 Final Thoughts:
Cardano is at a make-or-break point. It has bounced from support and is attempting a breakout from this symmetrical triangle. If successful, this could mark the beginning of a major trend reversal with over +100% upside potential from current levels.
On the flip side, failure to break resistance could lead to a deeper retracement. That’s why confirmation is critical before entering a position!
#ADAUSDT #CardanoAnalysis #CryptoBreakout #SymmetricalTriangle #AltcoinSeason #BullishBreakout #BearishScenario #TechnicalAnalysis #CryptoChart #CryptoTrading #Altcoins

#ADA Update #2 – July 7, 2025🟠 #ADA Update #2 – July 7, 2025
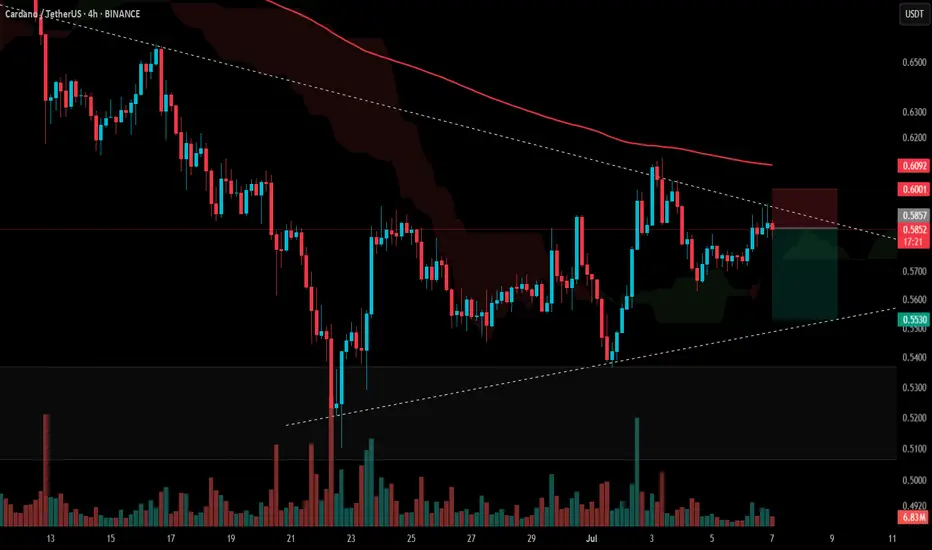
ADA has been consolidating within a descending triangle for a while now. Staying below the 200MA reinforces the bearish outlook, as this level acts as strong resistance. We’re seeing clear selling pressure on upward moves, which is confirmed by low volume on green candles.
Given this structure, it's likely ADA will retest the lower boundary of the triangle. Therefore, I see a short opportunity here.
Trade Plan:
🔘 Entry: 0.5857
🔴 Stop Loss: 0.6001
🟢 Target: 0.5530
At this stage, ADA does not present a favorable long setup. Only the short side seems worth considering.
ADA/USDT – Possible ShortADA/USDT – Bearish Reaction from Key Channel Resistance | Short Opportunity
Bias: Short Setup (Counter-Trend)
Cardano (ADA) has reached a significant technical juncture following a strong bullish impulse. Price has tapped into a critical resistance zone marked by:
The upper boundary of a broadening ascending channel
A horizontal liquidity pocket at 0.6195, labeled as “Level 1”
An extended impulsive move without consolidation, suggesting potential overextension
📌 Key Price Levels
Resistance (Short Entry Zone):
Level 1: 0.6195 USDT
Bearish Targets (Take Profits):
TP1: 0.6017 – Local support & minor demand
TP2: 0.5939 – Mid-range value zone
TP3: 0.5842 – Confluence of wedge support & previous demand
The structure resembles a rising broadening wedge, typically a bearish reversal formation, especially after a sharp leg into resistance.
The breakout from the smaller consolidation wedge has now run into major supply, where early short entries may begin to scale in.

Cardano Eyes 16% Gain, Main Target Set Firmly At 0.65Hello and greetings to all the crypto enthusiasts, ✌
All previous targets were nailed ✅! Now, let’s dive into a full analysis of the upcoming price potential for Cardano 🔍📈.
📉 Cardano is currently trading inside a descending channel, hovering near a key historical support — the strong daily level at the psychological 0.50 mark. This zone could act as a solid base for a potential bounce.
🚀 I’m targeting at least a 16% upside, with a primary resistance around 0.65.
🧨 Our team's main opinion is: 🧨
Cardano is holding a strong daily support near 0.50 within a down channel, setting up for a potential 16%+ rally toward 0.65. 📈
✨ Need a little love!
We put so much love and time into bringing you useful content & your support truly keeps us going. don’t be shy—drop a comment below. We’d love to hear from you! 💛
Big thanks , Mad Whale 🐋

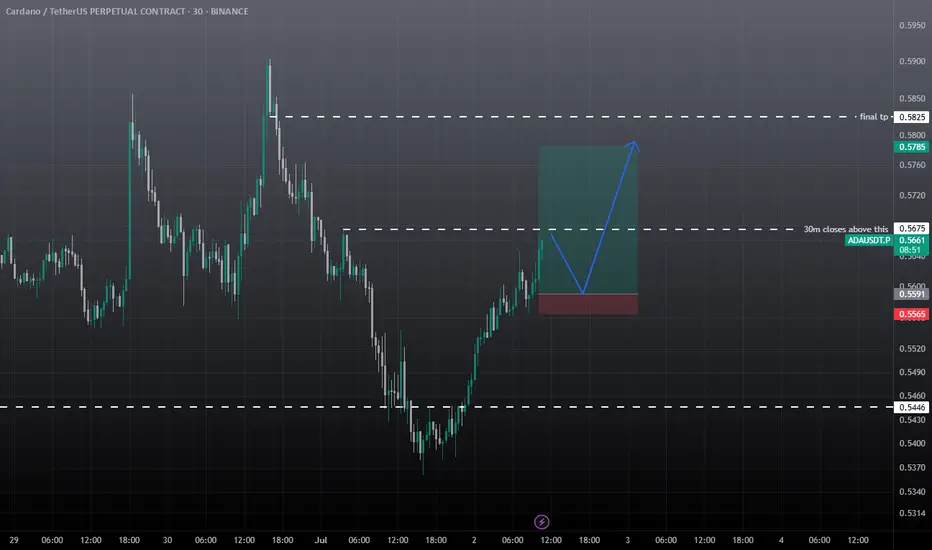
ADAUSDT Intraday SetupAda Showing some good movement. Trade Rules
must gave 30m candle closing above marked area, if wick above marked area then trade will become risky. Must use the sl. Target is given.
If retraces back before the marked area then it also good, in this case 30m marked area will first tp book 30% here, rest hold till final tp or SL.
ada usdt scalp tradeshort term pullback expected from ada, cardano so take it with small amount, trade entry based on 5m, so don't expect bigger targets. must use sl.

ADA/USDT : First Target Reached, Ready for Next ? (READ)By analyzing the #Cardano chart on the 3-day timeframe, we can see that the price is currently trading around $0.57. After reaching the first target at $0.61, a slight correction occurred, but ADA has managed to hold above the key support level of $0.55 — which is a significant sign of strength. As long as this level holds, we can expect further bullish continuation.
The next potential targets are $0.76, $0.93, $1.05, and $1.33.
The Latest Analysis (Tap for More Details) :
Please support me with your likes and comments to motivate me to share more analysis with you and share your opinion about the possible trend of this chart with me !
Best Regards , Arman Shaban

ADA/USDT : Get Ready for another Bullrun (READ THE CAPTION)By analyzing the #Cardano chart on the 3-day timeframe, we can see that the price is currently trading around $0.59. After sweeping the liquidity below $0.51, our bullish outlook for the next upward wave has strengthened significantly.
I'm now expecting a strong move from ADA, with short-term targets at $0.61 and $0.76, and longer-term targets at $0.93, $1.05, and $1.33!
Please support me with your likes and comments to motivate me to share more analysis with you and share your opinion about the possible trend of this chart with me !
Best Regards , Arman Shaban

$ADA Bulls Wake Up—Potential 9% Rally If This Level HoldsCardano (ADA) appears to be attempting a short-term recovery after a prolonged decline, as shown in the 4H chart from Binance. The price recently bounced from a well-defined support level around $0.5391, which has held multiple times in recent sessions, confirming buyer interest in this zone. This support also aligns with a previous consolidation range and has proven reliable in the past.
The price is now approaching a zone of dynamic resistance marked by the BEST Cloud ALL MA indicator. This red-shaded cloud represents the bearish control zone, and ADA has repeatedly failed to break through this area in recent weeks. However, ADA is now showing early signs of upward momentum as it consolidates just beneath the first resistance at $0.5734 (also marked as TP1). This resistance corresponds with the bottom of the cloud and recent swing highs.
The broader trend is still bearish, but the structure suggests a possible reversal if bulls can reclaim levels above the cloud. A further push above $0.5734 could attract fresh buying interest and target the next resistance level near $0.6155, which also represents TP2 on the chart. This upper zone served as a breakdown point in mid-June and may now act as a key level to watch.
Meanwhile, the green moving average line (part of the cloud setup) is starting to flatten. This often signals a transition from downtrend to range or even an early reversal—especially when combined with a support bounce and higher low formation.
There’s no clear bullish breakout yet, but the setup looks favorable for a cautious long position.
Trading Idea
• Entry Zone: 0.5550 – 0.5600 (near current consolidation)
• Target 1 (TP1): 0.5734
• Target 2 (TP2): 0.6155
• Stop Loss: Below 0.5391 (e.g., 0.5320 – adjust based on your risk appetite)
• Risk/Reward to TP2: Around 2:1
If price breaks below $0.5391, the bearish structure would be confirmed, possibly leading ADA back toward the $0.50–$0.48 region. But as long as this support holds, the market favors a recovery scenario toward the resistance levels mentioned.
Overall, this is a textbook support-to-resistance play, with potential for an 8–9% upside if bullish momentum sustains. Confirmation through volume breakout above the cloud will further strengthen the case for short-term gains.

"ADA - Time to buy again!"If the price can break through this Wedge's resistance, I expect it to reach $0.80 in a short time.
Stay Awesome , CobraVanguard.

#ADAUSDT: Is the crypto hype finally over? ADAUSDT is likely to drop first then it can reverse and continue the bullish move upwards of previous all time high. Before we can confirm any entry on this pair we need strong confirmation which will allow us to predict a correct and accurate swing move.
If you like the work then do consider liking and commenting on the idea.
Team Setupsfx_❤️

It's disappointing !!!Do you think this will happen, or do you see ADA below $0.50 in the future?
Best regards CobraVanguard.💚

ADA About to Explode or Fakeout Trap?Yello Paradisers — is ADA quietly setting up for a powerful reversal, or are we about to walk straight into a painful bull trap? This zone could decide everything, and here’s why you need to pay close attention.
💎Cardano (ADAUSDT) is currently sitting right on the supportive trendline of a descending channel, while also forming a classic double bottom pattern. What makes this even more significant is the presence of bullish divergence on RSI. This combination alone already hints at a potential bullish reversal, but there’s more to it.
💎The current zone also served as a previous resistance area, and it has now flipped into support—this “resistance-turned-support” structure adds confluence and increases the probability of an upward move. When multiple bullish signals align at a major structural level like this, it usually sets the stage for a strong bounce.
💎Aggressive traders who entered early from current levels are already seeing a potential 1:1 risk-to-reward ratio. However, for safer and more strategic positioning, conservative traders can wait for a pullback to this support zone. Waiting for a bullish confirmation candle after the pullback can offer a better entry with a healthier RR and higher probability of success.
💎That said, if the price breaks below the current support and closes a candle below our invalidation level, the entire bullish idea will be invalidated. In that scenario, the smart move is to remain patient and wait for a new setup to form. Chasing trades after invalidation is how most retail traders get trapped—don’t be one of them.
🎖Strive for consistency, not quick profits. Treat the market as a businessman, not as a gambler. This is the only way you’ll make it far in your crypto trading journey. Be a PRO.
MyCryptoParadise
iFeel the success🌴

HolderStat┆ADAUSD retest of the supportBINANCE:ADAUSDT has bounced from the 0.55 support level, completing a falling wedge structure. The price now attempts to recover, with a visible bullish wave formation targeting the 0.62 resistance trendline. Multiple past consolidations have preceded breakouts, and if this pattern holds, a strong upside push is possible. Watch for confirmation of continued higher lows.

ADA Long Swing Setup –Support Holding, Watching for Retest EntryADA has held the $0.50 support level over the past few weeks. If price retraces into the $0.53–$0.55 zone, we’ll be looking to enter a long spot trade from support for potential upside continuation.
📌 Trade Setup:
• Entry Zone: $0.53 – $0.55
• Take Profit Targets:
o 🥇 $0.64 – $0.66
o 🥈 $0.71 – $0.75
o 🥉 $0.80 – $0.84
• Stop Loss: Daily close below $0.51

Cardano, The Support Line —Crypto For The FutureHere we have Cardano long-term. I am keeping it simple because simple is best.
We have this "support line." Notice that a descending wave ends on a flat support. Each time this pattern showed up, decreasing prices with a stable base, what followed was a strong inverse reaction. Prices were going down but the reaction was a strong jump. Notice how each time the bullish jump becomes bigger.
» The first support line and descending triangle happened in 2023. This led to a small bullish wave, not a fast one but a good one.
» The second descending triangle and support line happened in 2024 and this one led to a strong bullish jump supported by high volume. Here the candles start to become bigger.
» The third and final support line is the current one, 2025. This one is expected to produce such a strong reaction that a new all-time high is expected and beyond.
Now, the action will be wild and strong but it won't happen in a single day, week or month, it will take months, many months. The bullish wave can develop in 4 months as it can take 6 months or even more. And this even more is very important because this is something not seen before. A "White Swan" event. The bullish cycle can develop for 12 months or even more because the preparation has been so prolonged and because fundamental market conditions have been improving for years, with a major boost the past 6 months. Conditions are so much better now compared to just a few years ago, that it is even hard to understand. It is like the world is shifting, changing and adapting to our vision. We saw Crypto, we voted for Crypto with our energy, attention and money, and the world is now catching up.
If all this "improvement" in acceptance and adoption has already happened within just 6 months, what do you think will happen in four full years? By the time this cycle is over, we will be living in a different world.
If you are in this market now, Oh boy! you are blessed; you are wise, you made the right choice.
If you are a developer, a reporter, a coder, designer, web manager, project owner, entrepreneur, promoter, innovator and the like, you are damn smart and you will be reward for the risk you took.
If you are on the other side of the spectrum, the artist, the dancer, the writer, the composer, the teacher, the athlete, the body builder, yoga instructor, waiter, the server, the clerk; the lawyer, the accountant, the advisor, and decided to put your hard earned money in Crypto, you decided to join... God bless you, you will be rewarded for the risk you took.
Patience is key, we are very close.
If you decided to trust my clean-sharp-straight words, Thank you!
You are appreciated greatly for your continued support.
If you are a human being, we love you... Crypto was made for all of us.
Don't worry about Cardano, it is going up.
Namaste.

CardanoAda usdt Daily analysis
Time frame daily
Risk rewards ratio >3 👈👌
Double bottom pattern has been created

ADAUSD long termADAUSD long term
I think the 7 wave is finished.
I Hope that Btc break the price 112k .
