New ADA Long Opportunity 18-30%+ BreakoutIf CRYPTOCAP:ADA continues on its uptrend over the next few weeks to months, which is more than likely if you look at the total Altcoin Market Cap breaking out, then here are two targets to watch: 0.82 for an 18% gain and 0.9 for a 31% gain.
Watch and wait for confirmed breakouts from the drawn resistance levels, and enter once it surpasses them with some momentum. These resistance levels are based on past price action and can usually be relied on for market price walls.
DYOR AND GET THOSE GAINS!
Like and follow if you're longing for CRYPTOCAP:ADA , and check out my X account, same handle!
ADAUSDT

Cardano(ADA) is Ready to Fall at least 🚨➖10%🚨🏃♂️ Cardano(ADA) is moving near 🔴 Heavy Resistance zone($1.053-$0.746) 🔴 and Resistance line .
🌊According to Elliott wave theory , Cardano(ADA) seems to have completed Zigzag correction(ABC/5-3-5) .
🔔I expect Cardano(ADA) to start falling again from the 🟡 Potential Reversal Zone(PRZ) 🟡 and at least fall to the 🟢 Support zone($0.661_$0.633) 🟢.
❗️⚠️Note⚠️❗️: An important point you should always remember is capital management and lack of greed.
Cardano Analyze (ADAUSDT), 15-minute time frame ⏰.
Do not forget to put Stop loss for your positions (For every position you want to open).
Please follow your strategy; this is just my Idea, and I will gladly see your ideas in this post.
Please do not forget the ✅' like '✅ button 🙏😊 & Share it with your friends; thanks, and Trade safe.

ADAUSDT → Breakthrough readiness. Target 1.25.BINANCE:ADAUSDT is forming an interesting potential that may allow the price to break out of the current range and head towards $1.25.
There is an interesting situation on W1. A breakout of 0.746 level is formed and price consolidation above the level (On D1), which allows the bulls to cfrm an intermediate bottom. If we pay attention to bitcoin, on H1 the coin is preparing to continue its growth, Cardano may respond to this by breaking through resistance and then rallying to the mentioned targets.
Strong support is forming on the chart, based on the local double bottom, liquidation on March 6, as well as the liquidity zone below 0.6850. This allows to form a potential for further growth.
Resistance levels: 0.7882, trend resistance.
Support levels: 0.730, 0.6850
I expect a breakout of the range resistance, which may give a new breath for the coin. The intermediate target in our case is the end point of the correction at the bear market 0.8992, as well as the psychological level of 1.00
CME:BTC1! BINANCE:BTCUSD CRYPTOCAP:TOTAL CRYPTOCAP:TOTAL2
Regards R. Linda!

Cardano(ADA) Bullish continuation to the ATHsCardano, also been one of those tokens that are actually not pumping that hard, also mves like a tortoise, XRP's Brother.
Based on the chart, ADA on the Bull run as well, from around 0.6400 we have been bullish, then we hit correction from 0.7525 which has just completed around 0.6827 then our perfect entry was at 0.7000, from there Im still expecting more moves to the upside till 0.8000, but also note that we might break above this zone till new ATH's, as im expecting ADA to atleast create a new ATH this bull-run.
So you can take positions from the current price if you want to ride the wave as well.
Otherwise its NFA as always. Awesome trading week.

ADA is poised for an upswingHello traders!
If you "Follow" us, you can always get new information quickly.
Please also click “Boost”.
Have a good day.
-------------------------------------
(ADAUSDT 1M chart)
The upward trend began when the MS-Signal indicator rose above.
Additionally, since the MS-Signal indicator has switched to a bullish sign, it is expected to continue its upward trend if the price holds above 0.236 (0.6024).
(1W chart)
If the upward trend continues,
1st: 0.9250
2nd: 1.3678
3rd: 1.9655
It is expected to rise to around the 1st to 3rd levels above.
We need to check whether the price can be maintained above the top of the box of the HA-High indicator.
(1D chart)
The (1) section is the psychological volume profile section.
Accordingly, the key is whether the (1) section can be broken upward.
To do that, we need to make sure the price stays above 0.6984.
If it falls below 0.6984 and shows resistance, there is a possibility that it will turn into a short-term downtrend.
The important point to continue the upward trend is around 0.236 (0.6024).
Looking at the Renko chart, it shows that an upward trend is about to begin.
Have a good time.
thank you
--------------------------------------------------
- The big picture
The full-fledged upward trend is expected to begin when the price rises above 29K.
This is the section expected to be touched in the next bull market, 81K-95K.
#BTCUSD 12M
1st: 44234.54
2nd: 61383.23
3rd: 89126.41
101875.70-106275.10 (when overshooting)
4th: 13401.28
151166.97-157451.83 (when overshooting)
5th: 178910.15
These are points that are likely to encounter resistance in the future.
We need to see if we can break through these points upward.
Since it is thought that a new trend can be created in the overshooting area, you should check the movement when this area is touched.
If the general upward trend continues until 2025, it is expected to rise to around 57014.33 and then create a pull back pattern.
1st: 43833.05
2nd: 32992.55
-----------------

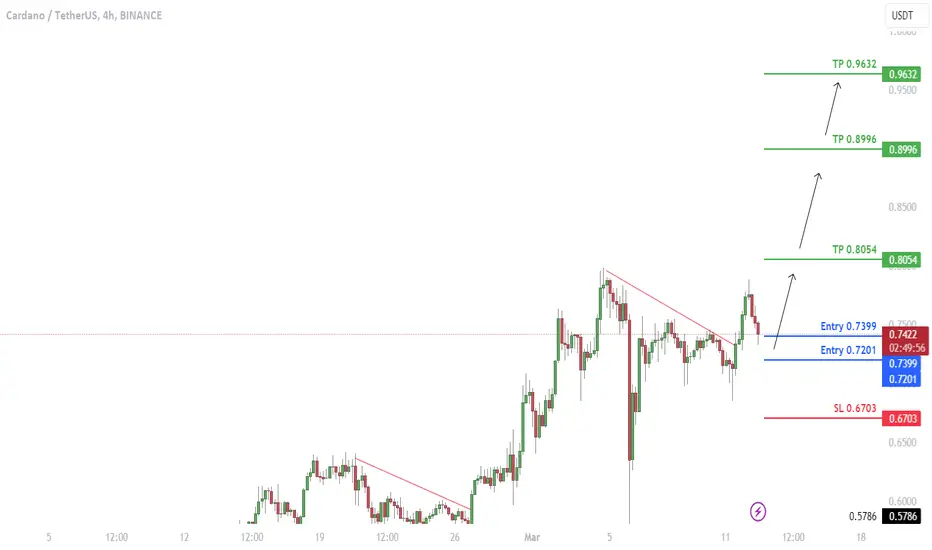
ADA has formed a bullish patternADA has formed a bullish pattern
🔵Entry Zone 0.7201 - 0.7399
🔴SL 0.6703
🟢TP1 0.8054
🟢TP2 0.8996
🟢TP3 0.9632
Risk Warning
Trading Forex, CFDs, Crypto, Futures, and Stocks involve a risk of loss. Please consider carefully if such trading is appropriate for you. Past performance is not indicative of future results.
If you liked our ideas, please support us with your likes 👍 and comments.
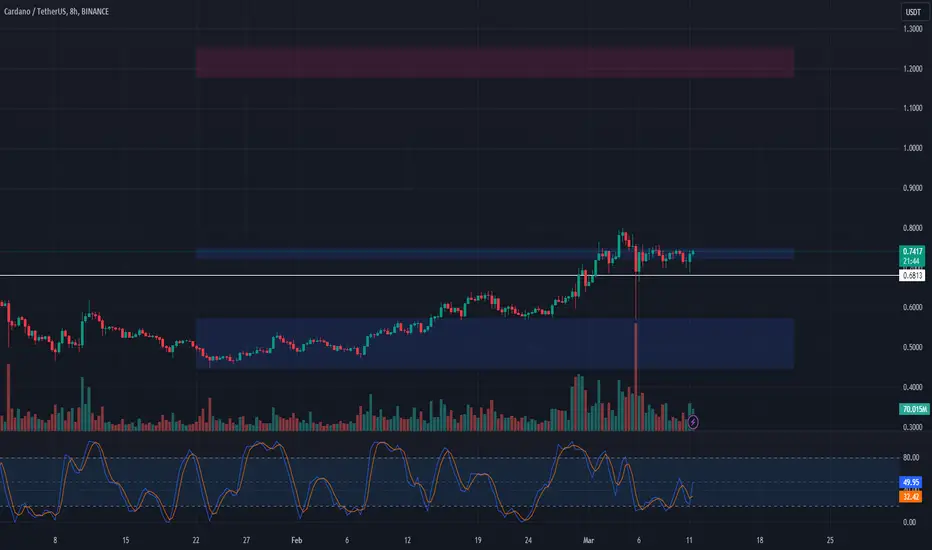
🔄 Cardano (ADA) Consolidation and Potential Upside Trade Setup!📊 Analysis:
Consolidation Phase: ADA has been consolidating sideways for almost two weeks, indicating a potential accumulation phase.
Key Level: Watching the $0.75 level closely for a breakout, which could signal a push up to the next area of resistance.
Entry Point: Consider entry with a break of the $0.75 level, entering into a long spot trade.
Upside Target: The next area of resistance is at $1.18 - $1.25.
Stop Loss: Place a stop loss just below $0.68.
🌐 Note: Given the overall market conditions and the potential for a correction, it's essential to manage risk closely. Keep an eye on market dynamics and any news that may impact ADA.
ADAUSDTADAUSDT is in strong bullish trend.
As the market is consistently printing new HHs and HLs.
currently the market is retracing a bit after last HH, which is 50% Fib retracement level and local support as well. if the market successfully sustain this bullish confluence the next leg high could go for new HH.
What you guys think of this idea?

ADA: sell-high buy-low📊Analysis by AhmadArz:
🔍Entry:
sell:0.758
buy:0.598
🛑Stop Loss:
sell:0.788
buy:0.562
🎯Take Profit:
sell:0.726-0.687-0.654
buy:0.662
🔗"Uncover new opportunities in the world of cryptocurrencies with AhmadArz.
💡Join us on TradingView and expand your investment knowledge with our five years of experience in financial markets."
🚀Please boost and💬 comment to share your thoughts with us!

🚧ADA is Bullish now🚧 & many Traders don't see it 👀!!!Hi.
COINEX:ADAUSDT
✅Today, I want to analyze ADA for you in a 3D time frame so that we can have a MID-term view of ADA regarding the technical analysis. (Please ✌️respectfully✌️share if you have a different opinion from me or other analysts).
Broadening wedge is broken and the price can reach 0.83 ,and as you can see, The bullish flag has been broken, which could be a positive event for Cardano's further growth
also a Hidden bullish Divergence (HD+) on RSI which shows Positive Signs for CARDANO.
✅ Due to the Ascending structure of the chart...
- High potential areas are clear in the chart.
- Flag
- AB=CD
- wedge
- Hidden Divergence
Stay awesome my friends.
_ _ _ _ _ _ _ _ _ _ _ _ _ _ _ _ _ _ _ _ _ _ _ _ _ _ _ _ _ _ _ _ _
✅Thank you, and for more ideas, hit ❤️Like❤️ and 🌟Follow🌟!
⚠️Things can change...
The markets are always changing and even with all these signals, the market changes tend to be strong and fast!!

Cryptolean Cardano ADA Update: Watch $0.76-$0.80 ZoneAfter a fast bearish dip to the key daily support at $0.57, an ascending trendline, 50-Day and 100 Day Moving Averages, Cardano recovered strongly.
It is bullish in the daily ADAUSDT chart and re-testing the key daily resistance zone of $0.76-$0.80.
Above $0.80, bulls will take control of the ADA price chart towards $1.
A daily candle closure above $0.80 will push XRP price towards $0.90 and higher.
A bearish rejection of $0.76-$0.80 zone will result in price declining towards $0.66, the current key support, for Cardano.
The ADAUSDT 4-Hour chart is teasing the key intraday support of $0.72.
A reversal from its current price location is likely and a bullish rejection of $0.72 will push Cardano to the key intraday resistance zone of $0.81-$0.84.
A bearish dip to $0.69 or, even better, to $0.65 and a bullish rejection of one of these levels could offer a long trade towards $0.81-$0.84 and higher.
ADA will follow BTC. A strong bearish rejection of $69,654-$73,422 in the BTCUSD daily chart will lead to the weakness of the whole #crypto market and ADA won't be an exception.
Like once read.
Thank you!

ADA is about to pump upAs it is obvious ADA is in reverse and is going back up, but not a crazy pump to 20$ or something like that, my best guess is that the earliest it can get back to 3$ is by Nov 2024

Alikze → ADA | Cup pattern formationIn time H8, a cup pattern is formed, the depth of which is more than 37% according to the structure, which in time D1 has a resistance in the supply area, and this break will have the ability to grow up to the specified area with support of 0.5860. Therefore, this break should happen soon for the specified target. The specified areas can be considered as profit limits.
🟩Sup:0.5860
⛳️Tp 1:0.6806
⛳️ Tp2 : 0.7826
⛳️ Tp3 :Red Box
------------------
Please support this idea with a LIKE and COMMENT if you find it useful and Click "Follow" on our profile if you'd like these trade ideas delivered straight to your email in the future.
Thanks for your continued support.
Sincerely.❤️

ADAUSD | Wave Analysis | Inverted Head & Shoulders Pattern +150%Confluent Wave Analysis with price action and chart pattern trading setup:
> The third wave correction after doubled zigzag ABC pattern forming a valid inverted head & shoulders pattern with barrier triangle ABCDE wave - with confirmation fake breakout D and E wave.
> Entry at B-D downtrend line breakout / WMA50 week
> Target 1 @ 161.8% Fibonanci extension +100% upside
> Target 2 @ 200% +150%
> Indicator: EWO - doubled bullish divergence in TFW

#ADA/USDT#ADA
The price is moving in a descending channel on a 4-hour frame
We now have a successful penetration of that channel upward
We have oversold conditions on the MACD indicator
We also have a higher stability moving average of 100
Entry price is 0.5230
First target 0.5443
Second target 0.5852
Third goal 0.6391

Cardano price can reach 0.78 levelHi everyone,
Cardano price broke all levels and set new yearly high 0.68 price level. To be honest I didn't expect this bull run in December as Cardano price rose more steadily than rapidly.
At this point main resistance remaining at 0.78 price level. In case if ADA manages to break it then road to $1 becomes open.
It might be that after reaching 0.78 price level there might be some price correction on Cardano. I don't think that ADA will manage to break 0.78 before Bitcoin halving happens.
Cardano price already increased on more than 50% just in one week and it's not good idea to expect another 50% increasement from it.
Please, do not forget to boost this idea & share it with your friends; thanks.

ADA on its way?!If you find this information inspiring/helpful, please consider a boost and follow! Any questions or comments, please leave a comment!
#ADA
One more squirt up, min, would make this variant a bit prettier.
.6788 break from here, would say ext W5.

[ADAUSDT] - long term accumulation in Adam & eve has broken out!in monthly chart ada completed a long term accumulation i adam & eve ..
additionaly:
🔸 produced a positive retest now... meaning a bullish path
🔸three white soldiers (monthly time frame)
targets shown at chart
dont forget to support us with ur like, comment and follow for more updates🎯

Cardano IdeaI am following this chart since 05/07/2022. It is not a prediction for investment. I explain why I continue to hold my own portfolio. Currently 122% has been added to the purchase price.

ADA/USD Secondary trend.Secondary trend. Logarithm. Timeframe 3 days.
The same parameters on the line graph.
local trading situation . Clamping zone. Timeframe 1 days.
ADA/USD Local trading situation
The main trend for understanding accumulation and distribution zones. Timeframe 1 month
ADA/USD Main trend

ADA/USD Local trading situationLocal trend. Clamping zone. Logarithm. Timeframe 1 day.
The same parameters on the line graph.
Secondary trend for understanding the work area.
ADA/USD Secondary trend.
The main trend for understanding accumulation and distribution zones.
ADA/USD Main trend

ADA/USDT Could ADA back to continue Upward or Go for downward ??💎 ADA's recent market performance is making waves, evidenced by a robust bullish candle on the daily close. This pattern suggests a potential resurgence in its upward trajectory, aiming for a significant resistance target. Investors and traders are closely watching this development, as a sustained upward movement could signal a strong bullish phase for ADA.
💎 However, if ADA stumbles in its ascent and fails to maintain its upward momentum, a shift in market dynamics could be imminent. Such a scenario probability would likely lead ADA to revisit and retest its support levels, a critical juncture for the asset.
💎 The support zone thus becomes a key area of focus. ADA needs to demonstrate resilience by bouncing back from this level to keep the bullish trend alive. A strong recovery from the support area would reinforce investor confidence and could reignite upward momentum.
💎 Conversely, if ADA is unable to hold above this support level and breaks down, it may trigger a slide towards lower support regions. This could lead to a more pronounced bearish trend, pushing ADA towards the next significant demand area. Therefore, the response of ADA at this support level is crucial and could dictate its short to medium-term market trajectory.

1D: ADA; LONG SETUP. 30% Upside- WYA Bulls?Sorry about the last chart being on mobile sucks but hope this is better
