Bearish Divergence Warning: Will ADA Break the Channel?Hello guys!
Cardano has been trading within a rising parallel channel after forming a clear Inverse Head and Shoulders pattern, triggering a bullish breakout. However, recent price action has shown signs of weakness, especially with a noticeable bearish divergence between the price and RSI.
What I see:
The price is approaching the lower boundary of the ascending channel.
A channel breakout to the downside could lead to a deeper correction toward the $0.58–$0.62 support zone (highlighted area), which aligns with previous consolidation and the neckline of the inverse H&S.
If bulls defend the channel and push price higher, a potential rally toward the $0.93 resistance level remains in play.
⚠️ Keep an eye on the channel support and RSI behavior to anticipate the next move.
ADAUSDT

ADAUSDT: Targeting $1.5 Long Term Swing View| Comment Your View|Hello everyone,
The cryptocurrency price is approaching a major bullish zone where it is anticipated to reverse. Price momentum has been slightly bullish in recent times, possibly due to the release of economic data that is against the US Dollar. A weak US dollar has recently influenced the cryptocurrency market volume, resulting in all-time highs. We anticipate similar or increased volume in the future.
We would appreciate your support by liking and commenting on your views about the cryptocurrency pair. Please let us know in the comments if you would like us to analyse any other cryptocurrency or trading pair.
Best regards,
Team Setupsfx_

Cardano 5X Lev. Full PREMIUM Trade-Numbers (PP: 2110%)I want to share a trade setup that looks really good. It has relatively low risk with a very high potential for reward. The low risk is not based on the amount of leverage but the chart itself.
Notice the low 3-Feb., there is a higher low 7-Apr.
If you can open a position that is safe above the 3-Feb. low, then this would a low risk position and can work for the long-term.
The falling wedge pattern and the two green candles are also great. The previous session and the current active session.
Since we already looked at Cardano in detail, let's focus on the full trade-numbers for this chart setup. Most of the targets should hit within months.
_____
LONG ADAUSDT
Lev: 5X
Current price: $0.6637
Entry levels:
1) $0.6800
2) $0.6300
3) $0.6000
4) $0.5710
Targets:
1) $0.7000
2) $0.8213
3) $1.0130
5) $1.1508
9) $1.8300
12) $2.6500
13) $3.4620
Stop-loss:
Close weekly below $0.5600
Potential profits: 2110%
Capital allocation: 5%
_____
This chart setup can also be approached with 3X since it is already moving.
The amount of leverage you use will depend on your own risk tolerance.
Leveraged trading is high risk. High potential for rewards but also very high risk. This is a game not for kids. This is for adults. Mistakes can result in a major loss. Good decisions can result in big gains.
If you enjoy the content, consider hitting follow and leaving a comment.
Boost also to show your support.
Thank you for reading.
You are appreciated.
Your support is appreciated.
I am here working for you for the long-term.
Namaste.

Cardano Explosive Move Ahead?The daily chart for ADA/USDT shows that Cardano is still trading within a clear descending channel, facing consistent resistance near the upper trendline. Recently, the price was rejected from a key resistance zone Green between $0.8140 and $0.8416. Despite several attempts, ADA has struggled to break above this level, reinforcing the bearish outlook. Strong support lies between $0.5408 and $0.5696 in Yellow, which previously held during a sharp decline in April. Unless ADA breaks above the descending trendline and holds above the Green zone resistance with strong volume, the downside risk remains, with potential for a retest of lower support levels.

ADA - Time to buy again!The pattern has broken, and now I expect the price to rise to $0.93 . AB=CD.
Give me some energy !!
✨We spend hours finding potential opportunities and writing useful ideas, we would be happy if you support us.
Best regards CobraVanguard.💚
_ _ _ _ __ _ _ _ _ _ _ _ _ _ _ _ _ _ _ _ _ _ _ _ _ _ _ _ _ _ _ _
✅Thank you, and for more ideas, hit ❤️Like❤️ and 🌟Follow🌟!
⚠️Things can change...
The markets are always changing and even with all these signals, the market changes tend to be strong and fast!!

ADAUSDT 3D Analysis ADA ~ 3D Analysis
#ADA Buy after successfully breaking through this resistance line with a short-term target of at least 10%++, long-term target $3

ADA: Bigger move is coming! If you're looking to trade ADA at the moment, here's a quick setup that you might find helpful!
The idea is: Buy when the price breaks above $0.865 and take profits at the levels shown in the chart.
Targets:
1. $0.9
2. $0.98
3. $1.03
-------------------------------------------
About our trades:
Our success rate is notably high, with 10 out of 11 posted trade setups achieving at least their first target upon a breakout price breach (The most on TW!). Our TradingView page serves as a testament to this claim, and we invite you to verify it!

#ADA/USDT#ADA
The price is moving within a descending channel on the 1-hour frame, adhering well to it, and is heading for a strong breakout and retest.
We are experiencing a rebound from the lower boundary of the descending channel, which is support at 0.7200.
We are experiencing a downtrend on the RSI indicator, which is about to break and retest, supporting the upward trend.
We are looking for stability above the 100 Moving Average.
Entry price: 0.7358
First target: 0.7510
Second target: 0.7700
Third target: 0.7946

ADAUSDT , 1HrPattern is looking Good , If BTC is Sustaining Above 1,06,834 this level then , This ADA pattern will Give a Good Breakout ,
Enter only When Upper Trendline is Breakout
Take Your Own Risk According to your Capital .
Follow for More Ideas Like This

ADA/USDT: Bullish Move Ahead ? (READ THE CAPTION)By examining the #Cardano chart on the 3-day timeframe, we can see that the price is currently trading around $0.80. If it holds above $0.71, we can expect more upside. The expected return for Cardano is around 30% in the short term, 47% in the medium term, and 85% in the long term.
Please support me with your likes and comments to motivate me to share more analysis with you and share your opinion about the possible trend of this chart with me !
Best Regards , Arman Shaban

Be prepared for everything...Hello dears
Given the recent growth, the price is stuck in a range and now that it has reached the bottom of the range, there are two options:
1_The price grows from here and hits our target.
2_The price continues to fall and falls to the support area below and our second buying step is activated and grows from there.
Buy a step and be ready for anything.
*Trade safely with us*

Altcoins: Analyzing the Ecosystem Beyond BitcoinAltcoins — short for “alternative coins” — encompass all cryptocurrencies other than Bitcoin. Emerging as early as 2011, they have since evolved into a diversified sector aiming to improve upon Bitcoin’s limitations or explore new use cases.
Classification of Altcoins
Smart Contract Platforms (Ethereum, Solana): Enable programmable finance and decentralized applications (dApps).
Privacy Coins (Monero, Zcash): Focus on anonymity and data protection.
Utility and Infrastructure Tokens (Chainlink, Polkadot): Facilitate blockchain communication and ecosystem functionality.
Market Analysis
In 2024, altcoins made up roughly 48% of total crypto market capitalization.
Ethereum continues to lead as the foundational layer for DeFi, NFTs, and DAOs.
New entrants like Avalanche and Near Protocol are gaining ground through scalability improvements.
Key Strengths and Challenges
Strengths:
Drive innovation in DeFi, Web3, and tokenized finance.
Foster scalability, low-cost transactions, and cross-chain connectivity.
Challenges:
Fragmentation: Competing standards hinder interoperability.
Security Risks: Vulnerabilities in smart contracts can lead to major hacks.
Regulatory Exposure: SEC scrutiny may classify some tokens as securities.
Conclusion
Altcoins represent the innovative edge of the crypto sector. For investors, they offer high-reward opportunities, but also come with elevated risks. Understanding their ecosystems is essential for long-term participation.

#ADA/USDT#ADA
The price is moving within a descending channel on the 1-hour frame, adhering well to it, and is heading for a strong breakout and retest.
We are seeing a bounce from the lower boundary of the descending channel, which is support at 0.7025.
We have a downtrend on the RSI indicator that is about to break and retest, supporting the upward trend.
We are looking for stability above the 100 moving average.
Entry price: 0.7045
First target: 0.7364
Second target: 0.7584
Third target: 0.7884

ADA (Cardano) – Long Swing Setup from Major Support ZoneADA is currently trading within a critical support area ($0.71–$0.73), offering a compelling higher low opportunity. With BTC holding strength, ADA may be gearing up for a rebound, particularly if it maintains structure above the support.
🔹 Entry Zone:
$0.71 – $0.73
🎯 Take Profit Targets:
🥇 $0.80 – $0.84
🥈 $0.98 – $1.02
🛑 Stop Loss:
Daily close below $0.66 (loss of higher low and structural invalidation)

ADAUSDT | Two-Tier Long StrategyAfter a period of quiet accumulation, ADAUSDT maybe a good choice after the manipulation of orange box. This presents a near-term opportunity for those seeking quick entries:
Short-Term Longs
Wait for a liquidity cleaning of the orange box first. Below that level you can look for 4h upward breakout and enter with retest. This signals that buyers are stepping in decisively and can fuel a retracement or trend resumption.
For investors with a multi-year horizon, the deep blue box at the chart’s base represents a true margin-of-safety zone:
Long-Term Accumulation
Placing staggered buy orders within the blue box, and scaling in as price holds, aligns with a value-based approach. If ADAUSDT respects this area over time, disciplined accumulation here could yield life-changing returns years down the road.
In both cases, rely solely on real volume footprint confirmations, never on guesswork. By trading these zones with patience and strict risk control, you tap into where genuine demand resides and strict risk control, you tap into where genuine demand resides and let market behavior guide your entries.
📌I keep my charts clean and simple because I believe clarity leads to better decisions.
📌My approach is built on years of experience and a solid track record. I don’t claim to know it all but I’m confident in my ability to spot high-probability setups.
📌If you would like to learn how to use the heatmap, cumulative volume delta and volume footprint techniques that I use below to determine very accurate demand regions, you can send me a private message. I help anyone who wants it completely free of charge.
🔑I have a long list of my proven technique below:
🎯 ZENUSDT.P: Patience & Profitability | %230 Reaction from the Sniper Entry
🐶 DOGEUSDT.P: Next Move
🎨 RENDERUSDT.P: Opportunity of the Month
💎 ETHUSDT.P: Where to Retrace
🟢 BNBUSDT.P: Potential Surge
📊 BTC Dominance: Reaction Zone
🌊 WAVESUSDT.P: Demand Zone Potential
🟣 UNIUSDT.P: Long-Term Trade
🔵 XRPUSDT.P: Entry Zones
🔗 LINKUSDT.P: Follow The River
📈 BTCUSDT.P: Two Key Demand Zones
🟩 POLUSDT: Bullish Momentum
🌟 PENDLEUSDT.P: Where Opportunity Meets Precision
🔥 BTCUSDT.P: Liquidation of Highly Leveraged Longs
🌊 SOLUSDT.P: SOL's Dip - Your Opportunity
🐸 1000PEPEUSDT.P: Prime Bounce Zone Unlocked
🚀 ETHUSDT.P: Set to Explode - Don't Miss This Game Changer
🤖 IQUSDT: Smart Plan
⚡️ PONDUSDT: A Trade Not Taken Is Better Than a Losing One
💼 STMXUSDT: 2 Buying Areas
🐢 TURBOUSDT: Buy Zones and Buyer Presence
🌍 ICPUSDT.P: Massive Upside Potential | Check the Trade Update For Seeing Results
🟠 IDEXUSDT: Spot Buy Area | %26 Profit if You Trade with MSB
📌 USUALUSDT: Buyers Are Active + %70 Profit in Total
🌟 FORTHUSDT: Sniper Entry +%26 Reaction
🐳 QKCUSDT: Sniper Entry +%57 Reaction
📊 BTC.D: Retest of Key Area Highly Likely
📊 XNOUSDT %80 Reaction with a Simple Blue Box!
📊 BELUSDT Amazing %120 Reaction!
📊 Simple Red Box, Extraordinary Results
I stopped adding to the list because it's kinda tiring to add 5-10 charts in every move but you can check my profile and see that it goes on..

ADA bulling :)📈 ADA/USDT 4H Analysis
ADA has broken above the 0.7408 resistance, now at 0.78150, showing strong bullish momentum within an ascending channel, targeting higher levels if the trend holds.
🟢 Support Levels:
🔹 0.7220 – recent breakout zone (20/50 EMA)
🔹 0.6630 – key support
🔹 0.6230 – deeper support
[ *]🔴 Resistance Levels:
🔹 0.8430 – next target
🔹 0.9670 – major resistance zone

"ADA - Time to buy again!" (Update)So if you pay attention to the ADA chart you can see that the price has formed a Ascending FLAG or wedge which means it is expected to price move as equal as the measured price movement.( AB=CD )
NOTE: wait for break of the FLAG .
Give me some energy !!
✨We spend hours finding potential opportunities and writing useful ideas, we would be happy if you support us.
Best regards CobraVanguard.💚
_ _ _ _ __ _ _ _ _ _ _ _ _ _ _ _ _ _ _ _ _ _ _ _ _ _ _ _ _ _ _ _
✅Thank you, and for more ideas, hit ❤️Like❤️ and 🌟Follow🌟!
⚠️Things can change...
The markets are always changing and even with all these signals, the market changes tend to be strong and fast!!

Cardano (ADA) Ready to Break Out – Key Levels in Play!Cardano (ADA) Ready to Break Out – Key Levels in Play!
Post with Emojis:
📈🔥 Cardano (ADA) Ready to Break Out – Key Levels in Play! 🚀✨
Hey Traders!
Cardano is back at the spotlight, and this time, the setup looks even stronger! After testing key support zones, ADA is holding above the crucial $0.775 level. The market is coiled tight, and the breakout could come any moment. Are you ready for the move?
📊 Key Levels to Watch:
📍 Immediate Support: $0.775 – Holding strong.
📍 Short-Term Resistance: $0.8368 – Expect a test soon!
🚀 Breakout Target: $1.1930 – First major target on the breakout path.
🎯 Secondary Targets: $1.4757 and $1.8937 – Next zones of resistance if momentum builds.
🏆 Ultimate Bull Target: $3.65 – The long-term upper trendline from the all-time high!
📚 Historical Pattern:
Remember late 2020? ADA compressed for months before exploding upward. The current price action is forming a very similar pattern, and the breakout trajectory is clearly mapped on the chart.
🛠️ Action Plan:
As long as we stay above $0.775, the bias remains bullish.
A breakout above $0.8368 could ignite the next leg towards $1.1930 and beyond.
With stock markets pumping and crypto lagging slightly—this might be the perfect moment to position for ADA’s next big move!
💬 What’s Your Play?
Are you already loading up on ADA, or waiting for the final confirmation breakout? Let’s hear your plans and favorite targets for this run!
One Love,
The FXPROFESSOR 💙

ADAUSDT – Major Breakout Brewing, Watch These Key Levels! 📈🔥 ADAUSDT – Major Breakout Brewing, Watch These Key Levels! 🚀
Cardano is waking up from its long consolidation phase, and the chart is setting up for a potential major impulsive wave. History shows us what happens when ADA compresses at the lower all-time trendline—and we’re right back at that critical point!
📊 Key Technical Levels:
📌 Immediate Support: $0.6799
📌 Resistance Levels to Watch:
$1.1930
$1.4757
$1.8937 – Major Resistance Zone
🎯 Ultimate Target: $3.65 – Upper All-Time Trendline
📚 Historical Context:
We saw a similar accumulation phase back in late 2020 before ADA skyrocketed.
The current price structure mirrors that move, with a clear breakout pattern forming.
🚦 Action Plan:
As long as ADA holds above the $0.6799 support, momentum favors the bulls.
A break above $1.1930 could trigger the next powerful rally toward $2.00 and beyond.
⚠️ Stay mindful of volatility as this breakout zone is tested. Rejections at key resistance could lead to short-term corrections before the next leg higher.
One Love,
The FXPROFESSOR 💙
PS. You HAVE to watch out for this first:

CARDANO CONSOLIDATION - When Breakout?CRYPTOCAP:ADA has been seen to range within the box on the 1hr timeframe chart since Friday 9th May and it’s still within the box. Trade with caution.
Please support this idea with a LIKE👍 if you find it useful🥳
Happy Trading💰🥳🤗

ADAUSDT 2D Analysis ADA ~ 2D Analysis
#ADA Buy after successfully breaking through this resistance line with a short-term target of at least 15%++
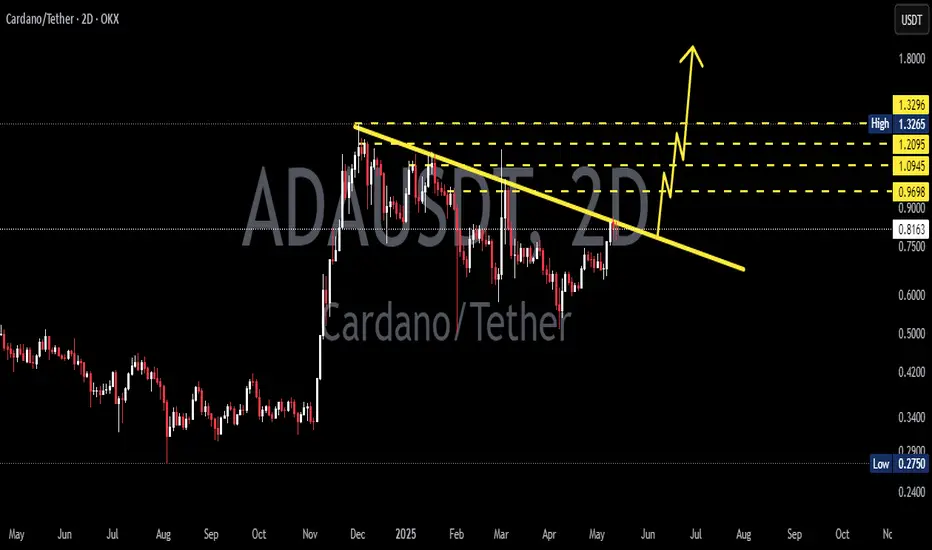
Cardano, Next Target (Weak vs Strong Resistance Levels)So the day started with a bearish tune but now is trading green. Based on the overall market conditions, this little event becomes a very strong bullish signal. This happening confirms the continuation of the bullish trend.
Notice thin blue line on the chart, it was drawn weeks ago but ADAUSDT bounced perfectly off this level. This means that the low is in.
With a continuation happening starting now/today, all that matters are the targets.
Where is Cardano likely to face resistance on the way up?
Which level is a strong resistance vs a weak one?
Consolidation has been happening since early February, which means that we have three months the market gaining strength. This means that Cardano can now perform a very strong move.
$0.91 is very easy and should be ignored. This is a weak resistance and Cardano can move straight up. There can be some days as the market never moves straight up, but no corrections or retraces are expected at this point. The same for $1.01. The next resistance is found at $1.15. This one yes, watch out for it.
The $1.15 resistance matches the rejection in early March as well as twice in January. It is also close to the peak in December. I drew a purple dotted line on the chart.
Since the December peak is so close, let's make the next resistance level a zone or range. Between $1.15 and $1.32. Or you can say $1.15 followed by $1.32. This is the first resistance to watch out for but it should break after a few attempts. It will definitely break because we had several months of consolidation and we are super bullish.
After this range, we have $1.83 and $2.64. Can go higher
These targets should all hit within 1-2 months.
I will leave the rest for another article, just so you have a reason to comeback.
Thanks a lot for your continued support.
Namaste.

ADA in coming days ...The pattern has broken, and now I expect the price to rise to $1.3 . AB=CD.
Give me some energy !!
✨We spend hours finding potential opportunities and writing useful ideas, we would be happy if you support us.
Best regards CobraVanguard.💚
_ _ _ _ __ _ _ _ _ _ _ _ _ _ _ _ _ _ _ _ _ _ _ _ _ _ _ _ _ _ _ _
✅Thank you, and for more ideas, hit ❤️Like❤️ and 🌟Follow🌟!
⚠️Things can change...
The markets are always changing and even with all these signals, the market changes tend to be strong and fast!!
