ADAUSDTThis is a 1D frame analysis for ADAUSDT The price of Bitcoin has tested its static support band for some time and is currently above the support line. The candle has started to move upwards with a shadow a few days ago, and we can expect a price increase, but keep in mind that as long as the price is above the support line, we can expect a price increase. If the price can maintain itself above the support line, it can experience higher prices for a long time. But don't be fooled, it is possible for the price to go slightly higher and be pushed back by selling pressure and experience more volatility. We have mapped out support and resistance areas for you dear friends so that you can use them in different situations.
ADAUSDT

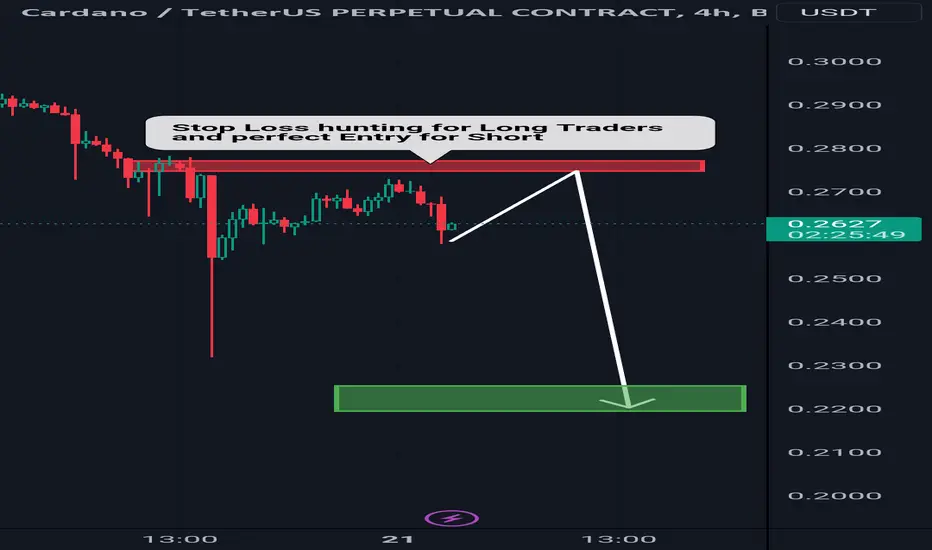
ADA Simple analysis ADA is trading at 0.2620 currently. And there is sell side liquidity above the previous high where are many stop losses of traders. Market will go up to 0.2750 area to grap liquidity and this is my Short Entry. Targeting below the previous low wick on buy side SL hunting.
FIL/USDT 4H: ready for short positionIn the daily time frame, we can see that after breaking the trendline, it could not cross the static resistance (flip zone) and take back the last top
Weakness in price stabilization is evident
In the 4H time frame, we have an upward trend line that the price has penetrated twice and is currently moving tangentially with it. There is also a support zone that has prevented the price from falling
If the trendline and the support zone are broken, we can enter the short position in this area in pullback (according to the drawn scenario)

ADAUSDT → Let's take a look togetherhello guys...
let's check this coin together.
in 4h time frame, this coin engulfed the last higher high but it is on the descending channel so it is risky for getting a long position now.
we can wait until the breakout happens.
what this coin is doing in the upper time frame?!
the bearish trend in a daily time frame:
the bearish trend in the weekly time frame:
what do you think about this coin?!
hold it?!

Ada BottomLooking At market Structure i have previously monthly be critical support ones it possibly brakes down to target is market.

ADAUSDT (Cardano) Potential Bottom Formation Explored💎Attention, Paradisers! An imperative update on #ADAUSDT is here. We've pinpointed another pivotal bounce off the support for #Cardano. Following a verified daily dip below the 61.8% Fibonacci support, the trend persisted in its descent, aligning with our preliminary predictions.
💎With this support breached, our gaze is set on #ADA approaching our lower target at the dual Fibonacci support. Yet, the previous day's decline halted precisely at the 88.6% Fibonacci support, casting shadows on the prospects of a further downward trajectory.
💎If this support remains unyielding, it could herald an optimistic turn in #ADAUSDT's price movement, possibly marking the nadir of the prevailing downtrend. However, for a trend reversal to gain our stamp of approval, we're keenly awaiting a breach and subsequent closure above the resistance thresholds of $0.35 and $0.38.
💎Such a move would amplify the chances of a medium to long-term bullish wave. For the time being, our focus remains unwavering on the current support, which might just be the linchpin for long-term stability. Stay vigilant, Ladies and Gentlemen of ParadiseClub!
ADA .P perfomance in last 8 months in 2023This year has been a rough year for crypto. Downward pressure appears with all coins.
With the ADA 2h frame, we see the price continuously entering the red area (possibly signaling a downtrend).
This is test result from the beginning of 2023 to the present including the current bearish period. Let's see how the S1-TM performs in a downtrend.
If you have an opinion or want to see results with Spot ADAUSDT, please leave a comment.

Good night - Altcoins | Bitcoin Dominance Carnage Continues (LN)
VC's continue to try sell Bitcoin to "prop" up their token to keep interest going.
Its not working and at the same time they're losing the only assets that matters, Bitcoin.
"BNB" losing power every time Binance tries to do this and they're running low on Bitcoin supply and USDT.
Ethereum also mimicking the BNB sell cycle.
Once exchanges start to adopt Lightning (USDT) (USDC) over Bitcoin its game over.
I can't help but see the repeat of 2002 where share holders off load useless non functioning business model companies and retail purchasing them at all time lows believing they will make a recovery.
There was 457 Initial Public Offerings (IPO's) riding on the wave of Apple, Microsoft, IBM, Intel none of the 457 made it out and went to zero.
We're in the final period where the market caps consolidate to the winner, Bitcoin.
-------------------------------------------------------------------------------------------------------------------
"Today #Tether announces the ending of the support of 3 blockchains CRYPTOCAP:USDT : OmniLayer, BCH-SLP and Kusama.
Customers will be able to continue to redeem and swap CRYPTOCAP:USDT tokens (to another of the many supported blockchains), but Tether won't issue any new additional CRYPTOCAP:USDT on those 3 blockchains."
"Yet we want to emphasize that Tether's team is rooted in the belief of leveraging the most secure, audited, and decentralized blockchain ever built: #Bitcoin .
In fact, we are actively contributing to developing RGB, alongside to
@bitfinex
and Fulgur Ventures, a client-side validated state and smart contracts system operating on Layer 2 and 3 of the Bitcoin ecosystem.
RGB has been postulated and boostrapped by
@peterktodd
and
@giacomozucco
.
You can find more info here: rgb.info
RGB functions both on-chain (Bitcoin L1) and on the Lightning Network ⚡️, promising unparalleled scalability. We firmly believe that RGB will usher in a new era for digital assets, smart contracts, and digital rights, garnering comprehensive support from major players in our industry. Once CRYPTOCAP:USDT on RGB goes live, the world will witness CRYPTOCAP:USDT on another super-powerful and scalable #Bitcoin layer.
If you didn't take a look at RGB yet, I strongly recommend you to do it.
It's community driven, fully open source, developed and maintaned by super talented minds.
RGB does not require any other token.
Simply secured by #Bitcoin built by bitcoiners ♥️"
Paolo Ardoino TO @tether_to + CTO @bitfinex
twitter.com

ADA, just an idea, don't stonewall me right nowHello friends, I'm taking a break for some time, this is just an idea and a thought, if you have any comments and suggestions, I'd be happy to hear about both BTC and Cardan. Have a nice day and be careful always SL

Cardano just broke 0.3 levelHi guys, let's look at the current situaition on Cardano.
So, Cardano finally broke 0.3 support level and this was expected. Now there is only one path to 0.25 support level. Probably, ADA price will stay around 0.3 level for a while and then will slowly drop to 0.25 level. One way or another 0.25 is the next big stop for Cardano.
If this post is useful to you, you can support me with like/boost and leave comments below.
Many thanks.


ADAUSDT can ascend further!As you can see, ADA was in the falling wedge, the price was able to break the wedge, now the price is in the PRZ zone, which has the potential to grow.
➡️ Note if the PRZ is broken downwards with the strength of Bearish candles or , this analysis of ours will be failed.
✅Thank you, and for more ideas, hit ❤️Like❤️ and 🌟Follow🌟!

DOW THEORY APPLIEDADA is showing one of the tenets of the DOW Theory. According to Dow, the market has three phases:
1) An accumulation phase
2) A public participation phase
3) A distribution phase
The accumulation phase represents informed buying of the investors.
The public participation phase is where the prices advance rapidly along with great news.
In the distribution phase, the same "informed investors" who "accumulated" near the bottom begin to "distribute".
Right now, we might expect a couple of months-long Accumulation Phase before any rally due to Public Participation.
For more information on Dow Theory, you can read "Technical Analysis of Financial Markets" by Johny J. Murphy

🔴 ADAUSDT 🔴NO LIQUDITY SWEAP NO ENTRY.
STRUCTURE IS CHANGING ANYTIME.
EVERY CANDLE HAS LIQUIDITY.
PRICE ALWAYS NEED LIQUIDITY.
Nobody Knows Where is Price Going.
Hey traders, here is the analysi.
If you guys like my analysis please hit like?? and follow.
Thanks.
SMART MONEY CONCEPT.
identify Liquidity Or Become Liquidity
DISCLAIMER- This is not financial advice.

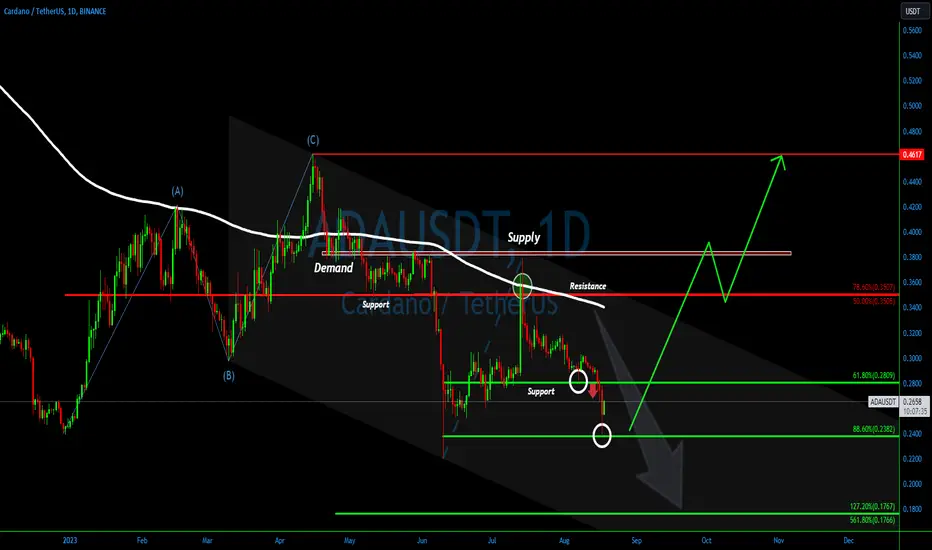
ADA/USDT Bullish Scenario Incoming !!💎 At present, ADA is undergoing a retest within its supply zone, hinting at a potential move downwards towards the demand or Bullish OB region between $0.270 - $0.253. Should the price touch this zone, we could witness a bounce-back, propelling ADA towards an upward trajectory to challenge the resistance trendline and the subsequent supply zone.
💎However, if ADA swiftly breaches the supply zone and firmly establishes above it, it might skip the demand zone altogether, setting its sights directly on the resistance trendline and the supply points at $0.379 and $0.428.
💎On the flip side, should ADA fail to hold the Bullish OB, it's plausible for it to carve a new lower low, indicating a deeper descent.
💎 Paradisers, keep a keen eye on these potential market movements! 🌴

ADA ☁️ 24-Hr Outlook - Bearish Market; Rebound In 1 Week? Cardano faces clouds ☁️ or even 🌧️ rain in the next 24 hours. This translates into a slightly bearish market with downside risk. 📉
Over a one-week horizon, CRYPTOCAP:ADA will likely see the sun return. ☀️
Follow us for more #Crypto weather insights!

ADAUSDT Price Dynamics and Potential Bearish Signals💎In recent times, #ADAUSDT has witnessed a significant price spike that caught many sellers off guard. However, it is crucial to delve deeper into the price action to gain a more comprehensive understanding. Could this sudden surge be a stop-loss hunt, designed to shake out the bears before a major price decline ensues? Let's explore the evidence.
💎 One notable aspect is the recent price action, specifically the bounce from the 200 Exponential Moving Average (EMA) on the daily chart. This serves as an intriguing signal, suggesting a potential reversal. Moreover, we observe how the price spiked above the EMA, reaching the supply zone, but was ultimately unable to surpass it. This observation underscores the significance of the $0.38 supply zone, as it continues to maintain the long-term bearish trend for #Cardano.
💎 Additionally, #ADA remains within the confines of a descending channel, providing further validation of the prevailing long-term downtrend. With this in mind, it is prudent to anticipate a minor upside pullback before a substantial drop occurs. This potential pullback could elevate the price to the $0.35 level, which aligns with a double Fibonacci resistance, adding strength to the expected price decline.
💎 Looking ahead, the anticipated drop could be as significant as a 50% decline over the coming weeks or months. The key support level to monitor resides at $0.1767, further reinforced by a double Fibonacci level, as illustrated on the chart. As Paradise Club members, it is crucial to remain attentive to these developments.
💎 In conclusion, the MCP team is diligently monitoring the current pullback, seeking the optimal entry point for a short trend strategy. As always, we are committed to providing timely updates and guiding our Paradisers toward informed decisions amidst the evolving market conditions. Stay tuned for further analysis. 🌴

ADAUSDT"Daily crypto market analyses I provide are personal opinions & not financial advice. Trading carries risks, so do your own research & seek advisor's help."
Don't forget to like and comment

Cardano staying above 0.3 levelHi guys, let's look at the current situaition on Cardano.
There is nothing much changed on Cardano since my last idea. ADA price is still fighting to stay above 0.3 support level and it's good sign for the bulls. But the only problem here is that Cardano's price is falling faster than growing. The ADA price is showing that it's unable to rise to 0.35 level and it's keep trading just above 0.3 support level. In case if Bitcoin price drops under 29k level then we surely will see ADA price dropping under 0.3 level.
Overall I'm still bearish on Cardano as its price unable to show any signs of life.
If this post is useful to you, you can support me with like/boost and leave comments below.
Many thanks.

Keep an eye on $ADA/USDTDid you find this crypto market analysis helpful? Stay updated about the latest crypto market update.
Please continue to follow my analysis and feel free to ask any queries, you may have. I am here to assist you.
TradingView: @FarmanBangashh

it's time to going up for ADAUSDTbefore buying, please check for being sure about your opinion about this CRYPTOCURRENCY!!!
(in every target you want closed the position but our target is the third one)
be rich...
and
doing and living in the best quality *-*
(Guy's the entry place is importance things in enter in a position and be careful do not going up your leverage over 7x ,all things it's about risk management)
*************************************************
if you want to enter in this position:
Enter Price: 0.3136(when completely closed here or higher, not different)
Target1: 0.3155
Target2: 0.3192
Target3(Final Target): 0.3221
Stop loss:0.3111
*************************************************
