The 0.4080 point is the divergence point of the rise and fallHello?
Traders, welcome.
If you "Follow", you can always get new information quickly.
Please also click "Boost".
Have a good day.
-------------------------------------
(ADAUSDT chart)
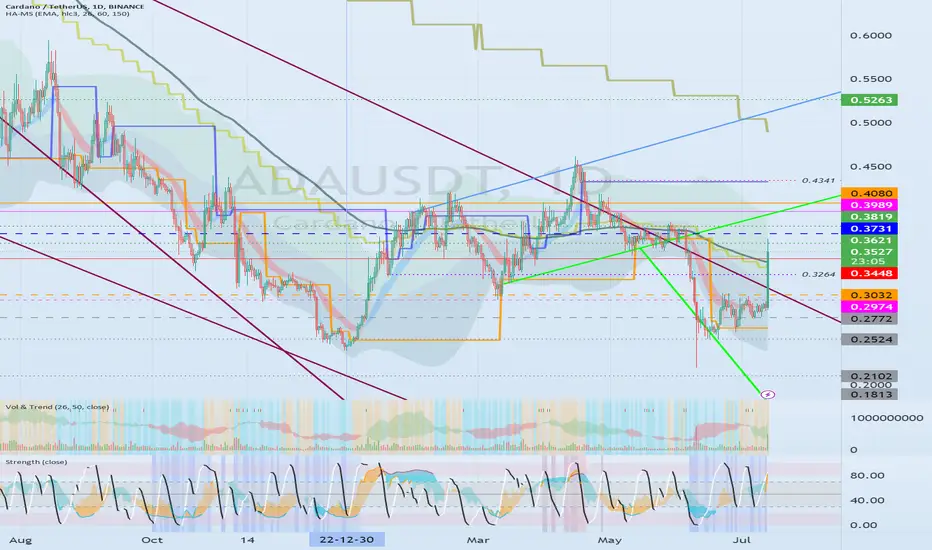
This rise did not turn the trend into an uptrend.
Therefore, I think that the movement to switch to an upward trend will begin only when the price rises above the 0.3032-0.3731 section and maintains it.
I would expect the price to hold above 0.4080 to start a full-fledged uptrend.
The timing of purchase is important for investment, that is, trading, but in the end, you must think about the increase compared to the investment period and decide.
In that sense, if it rises above 0.4080, ADA is a good coin to trade from a mid- to long-term perspective.
-------------------------------------------------- -------------------------------------------
** All descriptions are for reference only and do not guarantee profit or loss in investment.
** Even if you know other people's know-how, it takes a considerable period of time to make it your own.
** This is a chart created with my know-how.
---------------------------------
ADAUSDT
⚠️ Beware of what you invest in ⚠️There is no investor for this coin
just noises
i dont like fundamental, full of lies

ADAUSDT 🔥 Ascending Triangle Reversal Pattern As you can see price has been in a downtrend for a while but for now we can clearly see an ascending triangle pattern that oftentimes lead to a trend reversal.
My trading plan is laid out clearly in the chart. You can see TPs and SL as well as the best entry point. You can either wait for the breakout of this pattern or even a breakout and re-test approach whichever your style is.
The most important thing, NEVER risk more than 3% of your entire capital on a single trade. Master risk management and become profitable this way in the long run.
Happy Trading!
Kina 🔥

ADA Cardano Buy TF H4. TP = 0.3338On the 4-hour chart the trend started on June 10 (linear regression channel).
There is a high probability of profit. A possible take profit level is 0.3338
But do not forget about SL = 0.2161
Using a trailing stop is also a good idea!
Please leave your feedback, your opinion. I am very interested. Thank you!
Good luck!
Regards, WeBelieveInTrading

Cardano on a riseHi guys, let's look at the current situaition on Cardano.
Cardano stays in a narrow range of 0.25-0.3 for the past couple weeks. it shows positive dinamics and slowly climbing to 0.3 resistance. Everything is indicateing that ADA at least will try to break this resistance but it might be fake breakout, so need to be careful.
If Bitcoin goes above 32k than we can expect Cardano breaking 0.3 resistance and going up to the next resistance at 0.35.
But mid-term I'm not so optimistic about Cardano. Even that at the moment price goes up and probably there will be breakout, I still think that we'll see Cardano under 0.25 mid-term.
If this post is useful to you, you can support me with like/boost and leave comments below.

Cardano ADA can show new dipHello, Community!
Let's continue analyze crypto assets using SmartBot. I will remind you, this is an automatic trading strategy which defines the dynamic support and resistance levels, adjusting entry and exit points according to current market state. Today it's time for my favorite altcoin CRYPTOCAP:ADA .
On the ADAUSDT price chart we can see that since start of July SmartBot have already succesfully closed to position in profit. It had two entries at $0.287 and $0.27 using DCA approach. Notice how perfectly the second level corresponds with the local bottom. After that the bounce has ended exactly at the dynamic resistance level which has been defined by the strategy.
After closing the trades script has generated the base, which is pointed out as old base, but this base was not valid becuase we have the current base formed before reaching any support level.
Now we have the new base at $0.283 which is about to be broken. In case of breakdown it's likely to see the dip to the four support levels. Support 1 is located at $0.276, support 2 at $0.268, support 3 at $0.255, support 4 at $0.233. When one of this support will be reached the resistance level is gonna be generated as well.
Best regards, Skyrexio team
__________________________________________________
🔥Follow and smash the rocket 🚀 button to support us🔥

ADAUSDT is a good approach to the 0.3 levelHello everyone! The coins are divided into two camps: some roll down the stairs, others go up the stairs. But it is I who am in the mood for the crypto market - long. Therefore, consider a coin with a positive graph - ADAUSDT. After a big correction, we move up a little bit and beautifully press the level of 0.3. I think that with such a good approach, the coin can break through this level and go to 0.35

Cardano reached very important resistanceHi guys, let's look at the current situaition on Cardano.
Cardano just reached very important resistance level at 0.3 but so far didn't manage to break it or stay above. As I indicated earlier it's good spot to look for a short but considering ovarall situation on crypto market I would wait and see what's gonna happen next. Bitcoin just broke all resistance levels and it's difficult to predict what move will be next. Considering that all altcoins follow Bitcoin I will be very careful with shorts at the moment.
Unlike Bitcoin and Ethereim, Cardano didn't manage to recover its recent losses and that's why I even more pessimistic about it. As soon as Bitcoin starts its fall, Cardano will run ahead. It will be good if Cardano manage to climb to 0.35 but it depends on Bitcoin. If Bitcoin won't manage to go higher than 31k than it's unlikely that we see Cardano at 0.35.
If this post is useful to you, you can support me with like/boost and leave comments below.

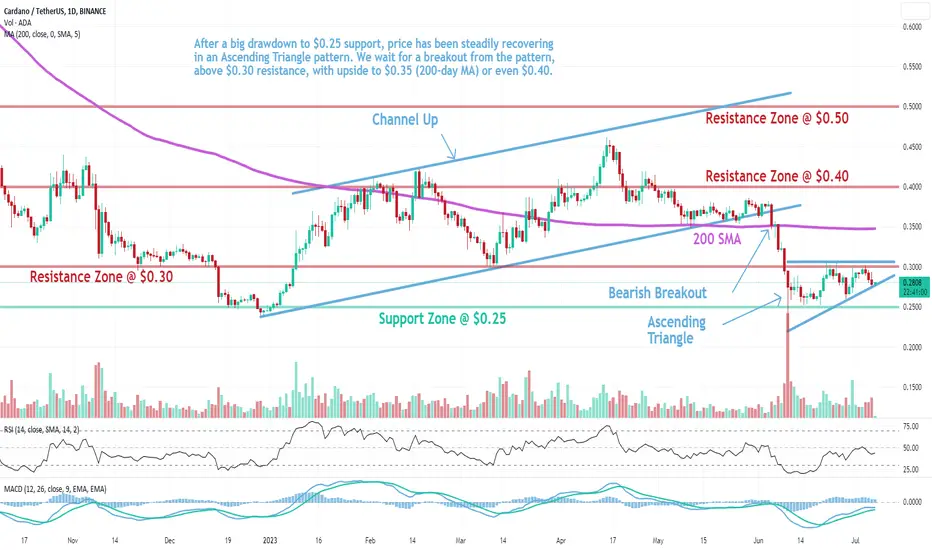
ADA: Ascending TriangleCardano (ADA) technical analysis:
Trade setup : After a big drawdown to $0.25 support, price has been steadily recovering in an Ascending Triangle pattern. We wait for a breakout from the pattern, above $0.30 resistance, with upside to $0.35 (200-day MA) or even $0.40.
Trend : Downtrend across all time horizons (Short- Medium- and Long-Term).
Momentum is Mixed as MACD Line is above MACD Signal Line (Bullish) but RSI < 45 (Bearish). MACD Histogram bars are declining, which suggests that momentum is weakening.
Support and Resistance : Nearest Support Zone is $0.25. The nearest Resistance Zone is $0.30 (previous support), then $0.40, and $0.50.
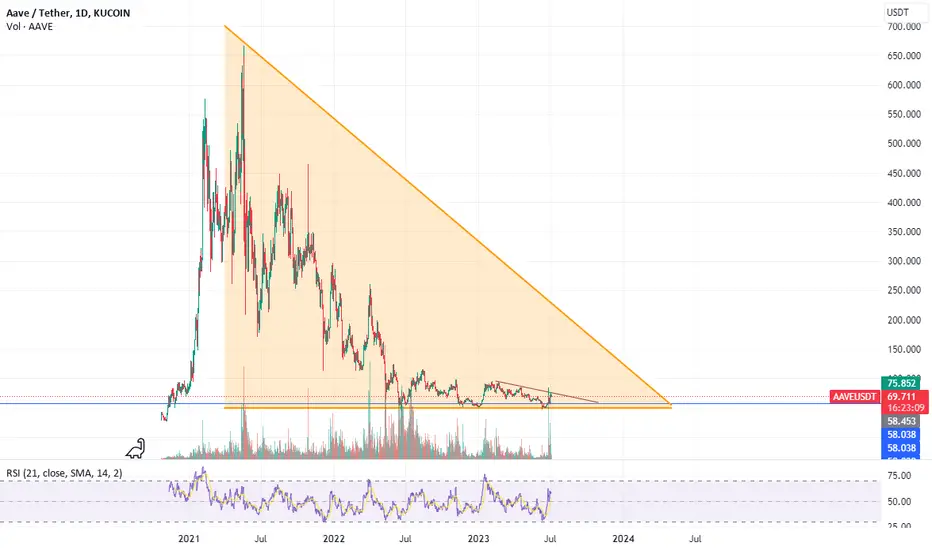
this is aave from beginingyou can see aave chart from begining BINANCE:AAVEUSDT as you can see we are in support line, this is for almost all altcoins. dont worry about futere,if you love crypto and if you believe to crypto, buy at thic prices, altcoins for examples, BINANCE:SOLUSDT , BINANCE:ADAUSDT , BINANCE:DOTUSDT , BINANCE:DASHUSDT , and,,, worth to buy now for this prices.
ADA LongRevolut, a prominent digital investment bank, has made a surprising move by announcing the cessation of support for three major tokens — Cardano (ADA), Solana (SOL) and Polygon (MATIC). The news, revealed by esteemed crypto journalist Colin Wu, came to light after Revolut reportedly sent an email to its U.S. users, notifying them of the impending delisting.
Read more on U.Today u.today

Cardano ADA potential rally with the Stock MarketCryptocurrencies were left behind by the recent Stock Market rally.
With the arrival of new BTC Bitcoin ETFs, I expect the Crypto Market to follow!
ADA/USDT long
Entry Range: $0.26 - 0.29
Take Profit 1: $0.34
Take Profit 2: $0.40
Take Profit 3: $0.43
Stop Loss: $0.22

BTC/USDT 1H: Coffin waiting for buyers!In the 1H time frame, we see the formation of a coffin pattern
For the farewell ceremony with buyers who enter buy positions in resistance areas, please wear formal clothes
thank you so much

ADA- Strongly bearish under 0.3The trend for Ada is clearly bearish and the coin has made even a new low after the start of the year's crypto rally.
At this moment AdaUsdt is trading under important 0.3 resistance and a new drop is probable.
The target for this drop is the recent low, but a new low is not out of the question, even probable

ADAUSDT - Bottoms In, Bullish EngulfingHi Traders, Investors and Speculators of Charts 📈📉
ADAUSDT seems to have finally bottomed out at 23c or 21c, depending on the exchange you're using. This concludes the completion of the bearish Head and Shoulders pattern in the daily timeframe.
After this long wick towards a major demand zone / support zone , there has been a bullish engulfing candlestick in the weekly timeframe which is extremely bullish for Cardano.
We also observe a similar pattern playing out back in Feb 2020, when another long wick formed followed by a strong v-shaped recovery. This was the start of the next major bull run for Cardano.
Is the bullish price action on Cardano as a result of the recent Hydra update? 🤔
_______________________
📢Follow us here on TradingView for daily updates and trade ideas on crypto , stocks and commodities 💎Hit like & Follow 👍
We appreciate your support !
CryptoCheck
__________________________
CRYPTOCAP:ADA BYBIT:ADAUSDT.P BINANCE:ADAUSDT BINANCE:ADAUSD.P COINBASE:ADAUSD BINANCE:ADAUSD OKX:ADAUSDT.P KRAKEN:ADAUSD BINANCE:ADABTC

ADA – New Trading Range• Between June 10th to June 22nd ADA was trading in a range between the 0.25 – 0.29 USD.
• During the weekend (Since June 22nd) ADA broke above the previous range high and tested it as support.
• The New trading range is compressed between the 0.2857 – 0.305 USD. IMO, this tight range has to breakout to the up or downside.
• Big picture, I am assuming that ADA will move higher.
• Short term, I am on the lookout for a liquidity grab to the downside before an upward move. Trading crypto makes you suspicious…
• This week, Fed Chairman Powell is scheduled to speak on June 29th and the 30th. This could be a perfect opportunity to generate volatility. Just be aware.
• It is possible that ADA will drop lower but IMO, it is not likely to drop below the previous range low. You could possibly take a long trade from the current range-low (0.285), but your SL should be wide.
Trade Idea:
This is a long-term swing trade. Long-term I am expecting ADA to make a recovery and reach the 0.46 level at least. If This trade is stopped out, I will probably try again lower.
• Entry: 0.278 USD.
• SL: 0.27 USD.
• Target: 0.46 USD.
• TP: 0.32, 0.37, 0.42, 0.46 USD.
NFA
What do you think? Please share in the comments
Best wishes to all.
