ADA : This May Be Your Last Chance Before Exploding to Upside !!The ADA will increase 40 cents and reach to the top of the wedge in the coming weeks.
Give me some energy !!
✨We spend hours finding potential opportunities and writing useful ideas, we would be happy if you support us.
Best regards CobraVanguard.💚
_ _ _ _ __ _ _ _ _ _ _ _ _ _ _ _ _ _ _ _ _ _ _ _ _ _ _ _ _ _ _ _
✅Thank you, and for more ideas, hit ❤️Like❤️ and 🌟Follow🌟!
⚠️Things can change...
The markets are always changing and even with all these signals, the market changes tend to be strong and fast!!
ADAUSDT

ADA/USDT | Multi-Month Breakout Brewing — a 10x play ?Cardano is quietly mirroring its previous macro cycle — but this time, the structure looks tighter, cleaner, and potentially more explosive.
The multi-month chart reveals a consistent uptrend forming off the 2022 lows, contained within a well-respected ascending channel. The price action shows strong similarities to the 2018–2020 accumulation phase, followed by the breakout that led ADA to its all-time high in 2021.
The current price structure is forming higher highs and higher lows within a channel — a strong bullish continuation pattern.
Volume has been increasing steadily during the up-moves, signaling real demand building underneath.
Fibonacci Extensions from the previous cycle highs and lows show key long-term resistance zones:
1.618 – $4.91
2.618 – $7.79
4.236 – $12.47
These levels could act as major psychological targets if the trend continues to evolve similarly to the last cycle.
⏳ Current Price (~$0.64) is still significantly below previous all-time highs and long-term extension zones — offering a potentially favorable risk/reward setup for patient investors.
⚠️ As always, nothing moves in a straight line — but if you're a macro-mind investor, you’ll start to notice more straight lines than most. Zooming out often reveals the patterns that noise hides.

TradeCityPro | ADA: Watching Support and RSI for the Next Move👋 Welcome to TradeCity Pro!
In this analysis, I want to review the ADA coin for you—one of the most popular and long-standing cryptocurrencies, currently ranked 10th on CoinMarketCap with a market cap of $22 billion.
📅 Daily Time Frame
In the daily time frame, as you can see, after ADA’s previous uptrend, the price moved upward and, after breaking 0.4322, continued its bullish leg up to 1.1325.
✔️ Following this move, the price entered a corrective phase, and during its first pullback, it performed a time-based correction down to 0.8161, but after breaking this area, deeper corrections began.
📰 Coinciding with the news of the creation of a crypto reserve in the U.S., this coin—alongside other coins in that basket—saw another bullish move that once again pushed the price up to 1.1325. However, within a few days, it reversed the entire bullish move and dropped to the 0.5579 zone.
📈 During this correction, we can draw a trendline from the price lows. As you can see, the price has reacted well to this trendline, and the overlap of this line with the 0.5579 zone has created a strong support, causing the price to bounce and show some bullish momentum.
📊 Currently, after bouncing from this zone, the price initially moved up strongly and with high volume. However, over the past few days—especially with the weekend—momentum has decreased, and volume has dropped as well.
📉 If this decline in volume continues, the price won’t be able to rise further, and bearish momentum could gradually return. If the 0.5579 support breaks, the price could continue moving downward.
💥 The downward trendline currently in play could act as a dynamic resistance during the next bullish legs.
🔼 For a bullish move, the key is the RSI divergence. This positive divergence, now visible with three higher lows, could support a bullish reversal. The trigger for this divergence is a break above the 50 level on RSI.
🛒 If RSI stabilizes above this level, bullish momentum will likely enter the market. In that case, breaking the 0.8161 trigger would offer a long entry or spot buy opportunity. The main trigger for price, however, remains the break of 1.1325, which is ADA's key resistance level.
📝 Final Thoughts
This analysis reflects our opinions and is not financial advice.
Share your thoughts in the comments, and don’t forget to share this analysis with your friends! ❤️

$ADA / $BTC – History Doesn’t Repeat? It can Rhymes The pair just bounced from a historically significant support zone that marked the beginning of the previous cycle’s rally. Once again, we’ve broken out of the long-term downtrend with a clean retest – just like in 2020.
The last cycle saw ADA/BTC shoot into the “Golden Pocket” after a similar structure.
This time? The setup is eerily similar… and the Recent Cycle Golden Pocket is still untouched.
Many aren’t ready for the euphoria 👁️
Target: 0.00004000 – 0.00005000 sats
Follow for more ADA/BTC cycle updates.

ADA.D (Cardano's Market Dominance) - 1WADA.D (Cardano's Market Dominance)
Historical Context of Cardano's Dominance:
Cardano (ADA) has previously reached a market dominance level of 4% on two notable occasions. These peaks occurred during periods of strong bullish momentum in the cryptocurrency market, reflecting Cardano's ability to capture significant market share due to its robust blockchain technology, focus on scalability, and growing ecosystem adoption.
Market Dominance Outlook:
Historical Precedent: The prior instances of reaching 4% dominance indicate Cardano's capacity to rally during favorable market conditions, particularly in bull markets driven by increased adoption of Layer-1 protocols and decentralized finance (DeFi) projects.
Current Pattern Similarity: The ongoing Falling Wedge breakout suggests a setup similar to previous cycles. If the broader crypto market enters a sustained bull run, Cardano could see its dominance rise as investors rotate into fundamentally strong altcoins like ADA
Total Crypto Market Capitalization Scenarios:
The total cryptocurrency market capitalization is a critical factor influencing Cardano’s price and dominance. Based on historical bull market cycles and current trends, here are potential scenarios for the upcoming bull market (2025–2026):
Conservative Scenario: Total crypto market cap reaches $5 trillion (approximately double the 2021 peak of ~$2.5 trillion).
Moderate Scenario: Total market cap climbs to $7 trillion, driven by institutional adoption, regulatory clarity, and mainstream DeFi growth.
Optimistic Scenario: Total market cap surges to $10 trillion, fueled by global adoption, technological breakthroughs, and speculative euphoria.
Expected Cardano Dominance and Price Projections:
Assuming Cardano achieves 4% dominance in the next bull market, we can estimate its potential market capitalization and price under the above scenarios:
Conservative ($5T Market Cap):
Cardano Market Cap: $5T × 4% = $200 billion
Circulating Supply: ~36 billion ADA
Price per ADA: $200B ÷ 36B = ~$5.56
Moderate ($7T Market Cap):
Cardano Market Cap: $7T × 4% = $280 billion
Price per ADA: $280B ÷ 36B = ~$7.78
Optimistic ($10T Market Cap):
Cardano Market Cap: $10T × 4% = $400 billion
Price per ADA: $400B ÷ 36B = ~$11.11
Conclusion:
Cardano’s ADA.D is showing a promising technical setup, reminiscent of its prior runs to 4% market dominance. If the retest of the breakout level holds, and the crypto market enters a bull phase with a total market cap ranging from $5–10 trillion, Cardano could achieve a price between $5.56 and $11.11, assuming it reclaims 4% dominance. Investors should monitor the retest outcome and broader market trends to confirm this trajectory. Always consider the inherent volatility of cryptocurrencies and conduct thorough research before investing.

Cardano (ADA) - 1DADA has recently broken out of a Falling Wedge pattern, which is a bullish technical pattern. After trading within this pattern for some time, ADA successfully surpassed the resistance level, indicating potential upward momentum. This breakout suggests that buyers are gaining control, and the price may continue to rise in the near term.
targets to watch:
- $0.6652
- $0.8413
- $1.1337

Cardano: Your Altcoin ChoiceOne of our friends asked for an update on Cardano, the 2025 All-Time High. I already did several charts with the ATH so I will recycle this one since the numbers stay the same.
We can still use the same numbers today we extracted after June 2023, that is because we use the bear market bottom to project a new ATH. Anyway, the chart is easy.
Cardano bottomed June 2023 and has been moving within an uptrend, higher highs and higher lows.
The last bullish jump happened in late 2024 peaking in early December. Then the correction comes. The correction bottomed early February 2025 and this week we are seeing the establishment of a higher low. This higher low is a great place to buy and go LONG. Because the correction is over so the next move is up. No more lower prices. No more sideways, no more corrections but up.
The correction lasted some 4 months and amounted to a drop of more than 60%. Some people without a clue are calling for lower but this is impossible. A correction is just that a correction, not a bear market. A bear market was 2022 and it requires lower and lower... Cardano has been going up since June 2023. We are entering the bull-run phase in late 2025. The contrary to a bear market we are actually seeing, we are in a bull market. The recent bearish action is a simple correction of the last bullish move.
Obviously bullish because we have a higher low compared to August 2024, the last bottom. This is super basic but sometimes is good to go back to basics before a major run.
The standard 2025 All-Time High target is $8.11. If the market does really good, it can go higher, much higher. If the market does poorly, growth will still be amazing. Doing poorly is not an option. Crypto is the new default method to exchange value. Soon, 1 billion people will be trading and using Crypto, growth will be something that cannot be explained.
Bet on Crypto and you will win in the short-, mid- to long-term.
Buy and hold Crypto and your financial future is secured, this is an easy bet.
Bet on the future, bet on the Internet.
Bet on technology. Bet on innovation.
The market needs your support.
Fiat currencies are going down after centuries of doing their work.
Nothing against fiat and decaying banks, they played their role.
We have nothing against landline and dial-up, but now we go wireless...
Nothing against the mail but we use e-mail.
Nothing against cash but we use virtual transactions and credit cards.
Thanks a lot for your support.
It is impossible to stop the evolution of the world.
Humanity will continue to improve.
A new form of money is not only necessity but a must.
We welcome Crypto.
We love to pay with our phones.
With Crypto, you can transfer money fast and easy, without censorship, without government control.
Abundance, peace, prosperity and freedom is the new norm.
Namaste.

ADA road map !!!The ADA will increase 40 cents and reach to the top of the wedge in the coming weeks.
Give me some energy !!
✨We spend hours finding potential opportunities and writing useful ideas, we would be happy if you support us.
Best regards CobraVanguard.💚
_ _ _ _ __ _ _ _ _ _ _ _ _ _ _ _ _ _ _ _ _ _ _ _ _ _ _ _ _ _ _ _
✅Thank you, and for more ideas, hit ❤️Like❤️ and 🌟Follow🌟!
⚠️Things can change...
The markets are always changing and even with all these signals, the market changes tend to be strong and fast!!

ADA Poised for a Bullish Breakout? Key Levels to Watch!🔹 Current Market Structure: #ADA is moving sideways in an accumulation phase on the 1-hour timeframe, indicating potential strength for an upcoming bullish move.
🔹 Bullish Confirmation:
We are closely monitoring a breakout above the resistance level. A confirmed candle close above the accumulation zone with a successful retest would signal a strong buy opportunity.
🔹 Trading Plan:
🔹 Wait for a break and retest above the resistance.
🔹 Enter a long trade with proper risk management.
🔹 Target key resistance zones for potential profits.
🔹 What’s Your Take? Will #ADA break out or get rejected? Drop your thoughts in the comments!
🔹 Like, Comment & Follow for more real-time updates!

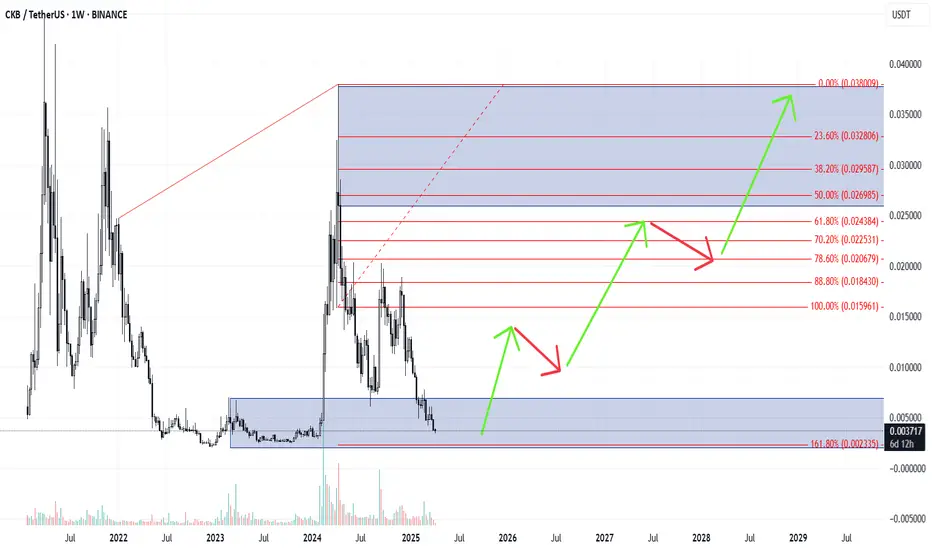
WILL HISTORY REPEAT ITSELF WITH CKBUSD-Cross chain Proof of work crypto, with partnerships notably with Cardano
-This one is right where it was before previous pumps
-If the cycle continues from current position to high will be 1000%
-Not too much more room to fall
-Not too heavy on this one but I'm accumulating
USDT.D Weekly : So IMPORTANT AreaHello and good timeو
Well, as I indicated on the chart, we have two very important areas. The initial box, if the price is rejected in this area, we can expect Bitcoin to be 70,000 to 74,000. However, in the event of a stock market crash and stories related to global tariffs that cause a heavy stock market crash, if the crypto market follows the fall, in the Tether dominance chart, we can reach the upper box areas, which can be said to be Bitcoin at $48,000 to $50,000. Be very careful in your trades.
SecondChanceCrypto
⏰ 6/april/26
⛔️DYOR
Always do your research.
If you have any questions, you can write them in the comments below and I will answer them.
And please don't forget to support this idea with your likes and comments.

Cardano (ADA) is on the verge of an 80% surge (1D)Despite all the positive news, it couldn’t maintain its bullish trend, as seasoned whales typically don't enter the market at the end of bullish waves.
The zone we’ve highlighted is where we believe whales will enter Cardano. Due to heavy buying pressure, the price could experience a 50% to 80% surge.
From the point marked with the green arrow on the chart, Cardano’s bullish phase has begun. It appears to be forming an expanding/diagonal/symmetrical triangle.
We are looking for buy/long positions in the green zone, where the hypothetical wave F might come to an end.
Targets are marked on the chart.
A daily candle closing below the invalidation level will invalidate our buy outlook.
For risk management, please don't forget stop loss and capital management
When we reach the first target, save some profit and then change the stop to entry
Comment if you have any questions
Thank You

ADA Spot Trade Setup – Support Level OpportunityCardano (ADA) is currently sitting at a key support zone, presenting a solid risk-to-reward long opportunity if bulls can hold the level.
🛠 Trade Plan:
Entry: $0.63 – $0.70
Take Profit Targets:
$0.78 – $0.84 (First Target)
$0.96 – $1.02 (Extended Target)
Stop Loss: Just below $0.58

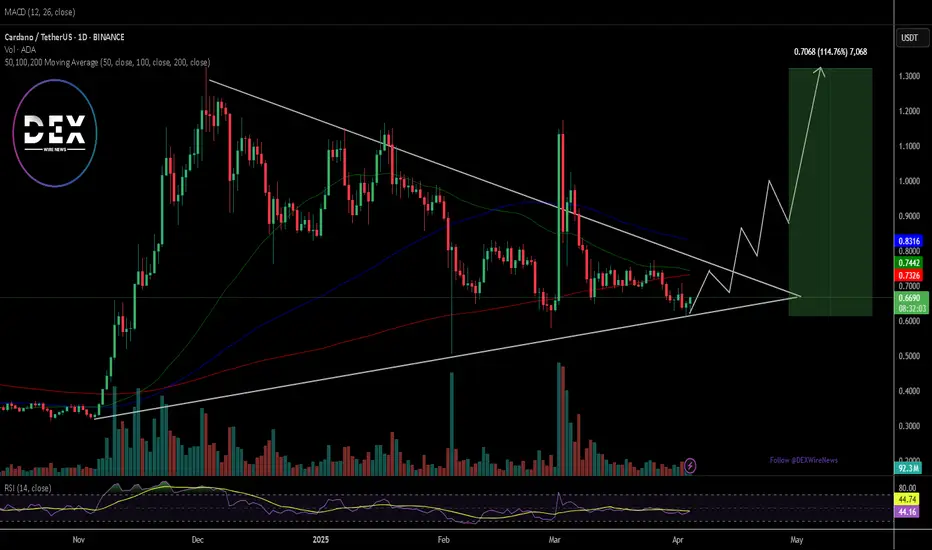
Breaking: $ADA Set for 100% Surge Amidst Launching of VeridianCardano the proof-of-stake blockchain platform that says its goal is to allow “changemakers, innovators and visionaries” to bring about positive global change, is set to breakout of a bullish symmetrical triangle with a 100% surge in sight amidst The Cardano Foundation launching "Veridian", an open-source identity wallet for secure, verifiable credentials on iOS and Android.
The asset is already up 2.24% despite the general crypto and stock market turmoil that saw over $1.5 trillion wiped out from US stock market at open today and over $2.85 trillion wiped out from the US stock market yesterday.
For Cardano ( CRYPTOCAP:ADA ), a breakout above the ceiling of the symmetrical triangle could catalyze the bulls to step in and push the asset to new highs. Similarly, should CRYPTOCAP:ADA fail to pull that stunt and selling pressure increases, CRYPTOCAP:ADA might cool-off in the $0.50 region.
Cardano Price Live Data
The live Cardano price today is $0.660668 USD with a 24-hour trading volume of $868,773,182 USD. Cardano is up 6.97% in the last 24 hours. The current CoinMarketCap ranking is #9, with a live market cap of $23,300,460,393 USD. It has a circulating supply of 35,268,011,575 ADA coins and a max. supply of 45,000,000,000 ADA coins.
ADA - Bearish Reversal Setup from Fair Value Gap🚀 ADAUSDT - 1H Chart Analysis 🚀
📊 Current Market Structure:
ADA is moving within a rising channel 📈, approaching a key resistance zone where a Fair Value Gap (FVG) is present. This area aligns with a significant Fibonacci retracement zone, making it a strong potential reversal point.
📌 Technical Insights:
🔹 Price is trading inside a well-defined bullish channel.
🔹 Approaching a major supply zone with previous reaction points.
🔹 Bearish rejection is expected in this area, leading to a potential drop.
📉 Trade Expectation:
A reaction from the FVG could lead to a downward move, as highlighted by the red arrows. If price confirms a rejection, a bearish shift in structure could occur, offering short opportunities.
⚠️ Risk Management Tip: Always wait for confirmation before acting on a setup. Managing risk effectively is key to long-term success!
📢 What do you think? Will ADA respect the FVG or push higher? Share your thoughts! 💬📉🚀

ADA - Bearish Rejection from Fair Value Gap (FVG)?This 4-hour chart of ADA/USDT shows price making a strong recovery after a significant drop. However, it is now approaching a key resistance area—a Fair Value Gap (FVG) near the 0.618-0.65 Fibonacci retracement levels.
Here’s the potential setup:
🔹 FVG Resistance: Price is entering a liquidity zone where sellers might step in.
🔹 Possible Double Top Formation: A rejection at this level could lead to a bearish reversal, forming a distribution pattern before dropping.
🔹 Bearish Continuation? If the FVG acts as resistance, ADA could resume its downtrend, targeting lower support zones.
Will this resistance hold, or will ADA break through and continue higher? Drop your thoughts below! 🔥📉

ADA/USDTThere is a removal of the weekly liquidity minimum, within the framework of range expansion, the target is the weekly high. A purchase can be considered in the highlighted zone, but only if the conditions are met.
Growth targets:
Target 1 = 0.74
Target 2 = 0.77

The last bullish chance of CARDANO in mid term!As you can see, the price has now formed an ascending wedge, which is promising. The price could rise to $1 after breaking this wedge...
Give me some energy !!
✨We spend hours finding potential opportunities and writing useful ideas, we would be happy if you support us.
Best regards CobraVanguard.💚
_ _ _ _ __ _ _ _ _ _ _ _ _ _ _ _ _ _ _ _ _ _ _ _ _ _ _ _ _ _ _ _
✅Thank you, and for more ideas, hit ❤️Like❤️ and 🌟Follow🌟!
⚠️Things can change...
The markets are always changing and even with all these signals, the market changes tend to be strong and fast!!

ADA - Next Trade Setups to WatchADA’s been stuck in this sideways grind for a while, and the volume’s basically ghosting us. So, where’s it at, and where’s the next move? Let’s dig in.
ADA’s sitting at $0.6615 right now, trading below the yearly open at $0.8451 and the range’s sweet spot, the POC, at $0.7325. That tells me it’s leaning a bit bearish, but not exactly screaming panic, more like it’s just chilling in this 57 day range. It tapped the monthly open at $0.6328 recently, bounced a little, but without volume showing up, it’s like nobody’s ready to commit yet.
Key Levels
Resistance Zones (Short Opportunities)
1.) Range POC: $0.7325, this is the most traded price within the 57 day range, acting as a magnet for price. A rejection here could signal a short setup.
2.) Yearly Open ($0.8451): a psychological and structural level that could cap upside if momentum remains weak. Trading below this level keeps the yearly bias bearish. A break above with volume would flip the narrative.
Support Zones (Long Opportunities)
1.) Monthly Open: $0.6328, already saw a little bounce here with that swing failure move, perfect setup for a long trade if you were quick on the draw.
2.) Yearly Open 2024 + 21 Monthly EMA: $0.594 - $0.5928, strong confluence with the prior yearly open and a key moving average. This zone aligns closely with the swing low at $0.5801, forming a robust support cluster between $0.5801 - $0.594.
3.) 21 SMA: $0.53, a deeper support level if the above zone fails. This would indicate a more significant breakdown, but it’s a potential accumulation area for longer-term traders.
Market Structure Analysis
Bearish Bias Above Swing Low: Trading below the yearly open and POC suggests sellers are in control unless price reclaims $0.7325 with conviction.
Range-Bound Behaviour: The 57 day range indicates consolidation. Volume is the missing catalyst, watch for a spike to confirm direction.
Swing Low as Key Pivot: The $0.5801 level is critical. A hold here maintains the range; a break below shifts focus to $0.53 and signals capitulation.
High-Probability Trade Setups
Long Setups
1.) Long Setup #1 at Swing Low ($0.5801 - $0.594 Zone)
Entry Trigger: Look for a swing failure pattern (SFP) where price dips below $0.5801, reclaims it, and shows rejection of lower prices (e.g., a bullish candle with a wick below).
Stop Loss (SL): Place just below the swing low
Take Profit (TP): $0.70 (near-term resistance)
Stretch Target: $0.8451 (yearly open), though this requires stronger momentum.
Confirmation: Higher-than-average volume on the reclaim + bullish price action (e.g., engulfing candle).
2.) Long Setup #2: $0.4735 Sniper Entry
Entry Trigger: If ADA takes a bigger tumble, $0.4735 is your sniper’s nest, think of it as catching the knife with style. Could be a wick that snaps back.
This is a deeper, high-reward play. Price has to fall by a lot from here, but if it hits, the R:R is amazing, and it’s below most traders radar. Patience is the name of the game.
Short Setup
At POC ($0.7325) or Yearly Open ($0.8451)
Strategic Outlook
Current Stance: If not in a trade, the $0.5801 level is the highest-probability long setup due to confluence and R:R. The SFP at $0.6328 today was a missed opportunity, but a deeper pullback sets up an even better entry.
Breakout Watch: A decisive close above $0.7325 (POC) with volume shifts focus to $0.8451. Conversely, a break below $0.5801 targets $0.53.
Patience is Key: Low volume suggests waiting for a clear catalyst (e.g., news, BTC move) to drive ADA out of this range.
Wrapping It Up
The $0.5801 swing low long with SL below and TP at $0.7 - $0.8451 is the standout trade right now—low risk, high reward, and backed by confluence. Monitor volume closely, as it’s the linchpin for any breakout or reversal. If ADA holds this support and volume picks up, the retest of $0.8451 becomes plausible.
If you found this helpful, please leave a like and a comment. Happy trading!

Ada is far from deadLooking at strictly block orders and rsi the 4 day timer shows ADA landing on top of its new buy zone.
.658 was the discounted by zone and it has bumped from there.
The battlegrounds (buyers vs sellers) will be around the price point of : .7120 and .7180
This could be a potential exit for buyers right now at those ranges. If it can break rhe 7180 zone we could see numbers raise as high as : .7650 and .7750

Good r:r on alts.I have made market watch baded on indicator on main screen. It aggregate view on main alts. Fat dot is bullish. Thin coloured dot is signaling possible entry. Gray dot is bearish. No dot is just downtrend. Solid line is showing how market is performing. Now its valie is 1. In the recent past it was good place to enter long trades. Marked with yellow lines. Be aware. If this is entry into bear market there will be dead cat bouces so manage your risk.

ADA/USDTI have marked the area of interest, after which I will consider buying the coin, but only if the conditions are met.
growth targets
Target 1 = 0.7744
Target 2 = 0.8176
Target 3 = 1.040

Cardano $ADA Buy Setup support by a strong daily demand levelCardano CRYPTOCAP:ADA Buy Setup support by a strong daily demand level at 0.6593. The daily candle from the 3rd of March printed the strongest rally in Cardano's history. The crypto has been rallying ever since.
