ADAUSDT Breaks Long-Term Downtrend – Critical Support Retest!The ADAUSDT pair is showing a compelling technical setup. The price has successfully broken out of a long-term descending trendline (yellow line) that had been acting as dynamic resistance since late 2024. This breakout came with strong momentum, signaling a potential shift from a bearish trend to a bullish reversal.
After the breakout, price managed to rally up to minor resistance around $0.90, but is now pulling back and retesting the key support zone (highlighted yellow box) — a previous strong resistance area now potentially flipping into support.
---
🟢 Bullish Scenario:
If the price holds above the $0.80 - $0.83 support zone, the break-and-retest structure will be validated.
A successful bounce from this area could push ADA back toward:
$0.90 (current minor resistance)
$1.13 (psychological and horizontal resistance)
$1.23 (previous supply zone)
$1.32 (recent local high)
A confirmed bullish continuation will be more convincing if the price forms a higher low and breaks above $0.90 with strong volume.
---
🔴 Bearish Scenario:
If ADA fails to hold the $0.8281 support and falls back below the descending trendline, then:
It may re-enter the previous range and test lower support around $0.75 or even $0.65.
This would suggest a potential false breakout and return to bearish territory.
Watch for bearish candlestick confirmations below $0.80 as an early warning.
---
📌 Pattern Insights:
Descending Trendline Breakout: Suggests a possible long-term trend reversal.
Break & Retest Structure: Price is currently testing the previous resistance zone as new support.
Layered Resistance Zones: Several clear resistance levels above provide logical targets for a bullish rally.
---
📊 Conclusion:
ADAUSDT has printed an early signal of a bullish reversal by breaking out of a long-standing downtrend. However, the sustainability of this trend depends heavily on the ability of price to hold the $0.80 - $0.83 support zone. Look for bullish confirmation candles in this area for a safer long entry.
#ADAUSDT #Cardano #CryptoBreakout #TechnicalAnalysis #Altcoins #BreakoutSetup #BullishRetest #CryptoChart #SupportAndResistance #PriceAction #TrendReversal
Adausdtanalysis

ADA About to Explode or Collapse?Yello Paradisers — is ADA gearing up for a breakout, or are we walking straight into a bull trap? After the recent pullback, the market is throwing mixed signals, but this setup is becoming too important to ignore. Here’s what we’re seeing right now on ADAUSDT.
💎ADA is currently showing positive signs of strength after a solid retracement. Current support zone is not only a historical price pivot, but it's also aligned with a supportive trendline, the 200 EMA, and a developing bullish divergence on the chart. All these factors combined are increasing the probability of a short-term bounce — but that doesn't mean we go in blind.
💎For aggressive traders, entering at the current price might make sense, especially if you’re targeting the first resistance level. However, it’s important to note that this entry offers a relatively limited reward compared to the risk — roughly a 1:1 risk-reward ratio — so it’s crucial to size your position accordingly and keep tight control over your stop loss.
💎If you're looking for a cleaner setup with a better risk-to-reward profile, patience is key. A more favorable scenario would be waiting for a proper pullback and a confirmed retest of the support zone. Ideally, you want to see a strong bullish candle at the support level to signal continuation — that’s when the setup shifts from average to high-probability.
💎But be cautious. If the price breaks down and closes a candle below our support zone, the entire bullish idea becomes invalid. In that case, it’s much wiser to step back and allow the market to develop more structure before re-engaging. Forcing trades in uncertain conditions is where most traders lose, and we don’t want to be part of that crowd.
🎖Strive for consistency, not quick profits. Treat the market as a businessman, not as a gambler. Be patient, Paradisers — only those who follow structured strategies and risk management will thrive in the long run.
MyCryptoParadise
iFeel the success🌴
ADAUSDT: $1.50 Year End Target, Is It Possible? The price has remained steadily bullish, but we haven’t seen a strong bullish impulse in the daily timeframe yet. This suggests that we’ll likely reach the $1.50 price range. Please wait for the price to break out and then enter a trade when it shows confirmation. You can use smaller timeframes while taking any entry. Good luck and trade safely!
Like and comment for more!
Team Setupsfx_
ADA/USD Thief Trading Plan – Bullish Snatch & Run!🚨 ADA/USD HEIST ALERT! 🚨 – Bullish Loot Grab Before the Escape! (Thief Trading Strategy)
🌟 Greetings, Market Pirates & Profit Raiders! 🌟
🔥 THIEF TRADING STRIKES AGAIN! 🔥
💎 The Setup:
Based on our stealthy technical & fundamental heist tactics, ADA/USD is primed for a bullish loot grab! The plan? Long entry with an escape near key resistance. High-risk? Yes. Overbought? Maybe. But the heist must go on!
🎯 Key Levels:
📈 Entry (Vault Cracked!) → Swipe bullish positions on pullbacks (15m-30m precision).
🛑 Stop Loss (Escape Route) → Recent swing low (4H basis) at 0.5290 (adjust per risk!).
🏴☠️ Target (Profit Snatch!) → 0.6500 (or bail early if bears ambush!).
⚡ Scalpers’ Quick Heist:
Only scalp LONG!
Big wallets? Charge in! Small stacks? Ride the swing!
🔐 Lock profits with Trailing SL!
📢 Breaking News (Heist Intel!):
Fundamentals, COT, On-Chain, Sentiment— All hint at bullish momentum!.
🚨 ALERT! News volatility ahead—Avoid new trades during releases! Secure running positions with Trailing SL!
💥 BOOST THIS HEIST! 💥
👉 Hit LIKE & FOLLOW to fuel our next market robbery! 🚀💰
🎯 Profit taken? Treat yourself—you earned it!
🔜 Next heist incoming… Stay tuned, pirates! 🏴☠️💎

ADA/USDT Ready to Explode? Watch This Symmetrical Triangle
🧠 Detailed Technical Analysis:
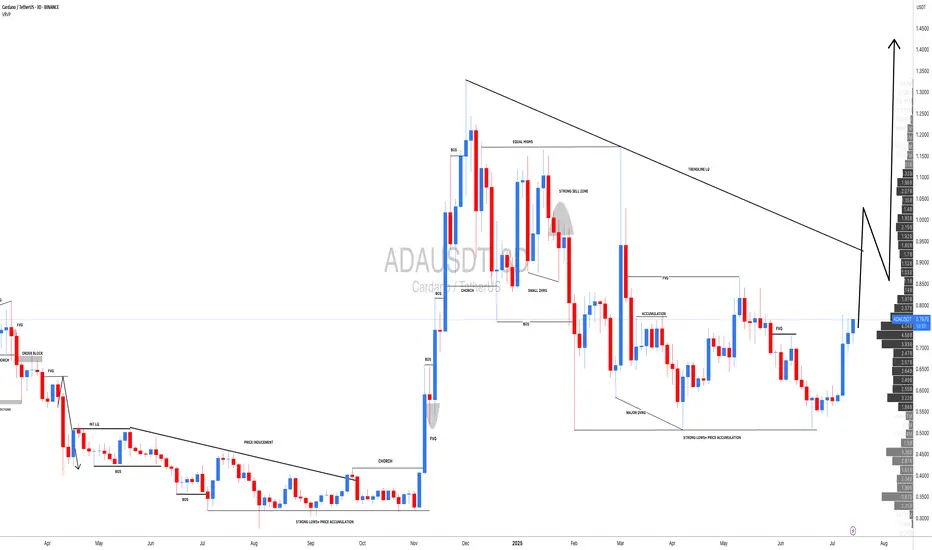
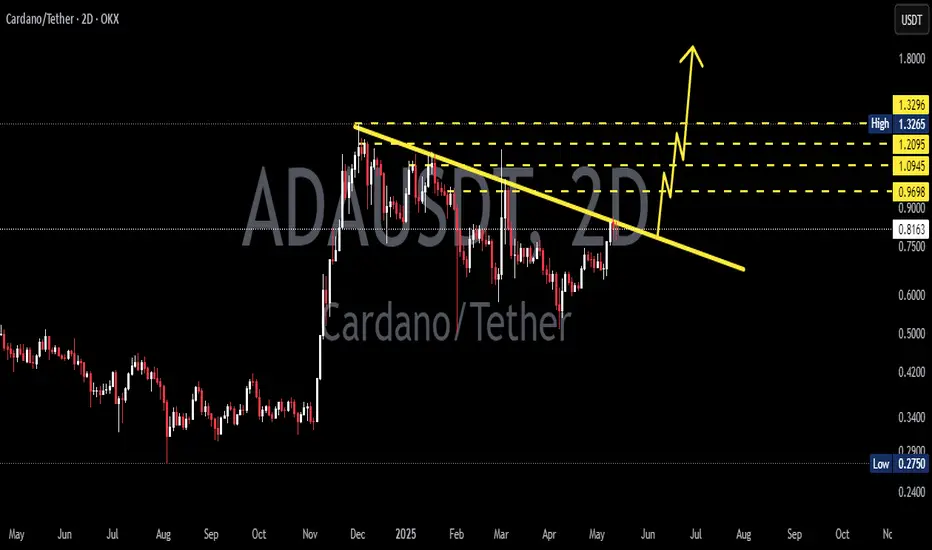
Cardano (ADA) is currently consolidating within a well-defined Symmetrical Triangle pattern on the 3-day chart. This pattern is formed by a series of lower highs and higher lows, indicating compression and indecision in the market — a classic setup for a strong breakout in either direction.
Price has recently bounced off the lower boundary of the triangle and is now heading toward the resistance trendline. A breakout from this structure could trigger a powerful bullish move if confirmed with volume.
🔼 Bullish Scenario (Upside Breakout):
A confirmed breakout above the descending trendline (~$0.65) with strong volume would indicate buyers regaining control.
Key upside targets based on historical resistance zones and the triangle's height:
🟡 $0.8144 – First major horizontal resistance
🟡 $0.9386 – Mid-range resistance from March 2025
🟡 $1.0920 – Former distribution zone
🟡 $1.2118 – Medium-term bullish target
🔵 $1.3264 – Key structural high from previous cycle
🔔 A breakout from a symmetrical triangle often leads to significant price action due to the long period of coiled pressure release.
🔽 Bearish Scenario (Breakdown):
If ADA fails to break above $0.62–$0.65 and gets rejected from the upper boundary of the triangle, the price could:
Revisit the lower trendline support around $0.55
A breakdown below this zone could lead to:
🔻 $0.48
🔻 $0.39
🔻 $0.2756 – A major psychological and historical support level
⚠️ This scenario would invalidate the bullish structure and potentially resume the mid-term downtrend.
📐 Pattern Breakdown – Symmetrical Triangle:
Pattern Duration: ~6 months of consolidation (Feb – July 2025)
Support Zone: $0.55 – $0.60
Resistance Zone: $0.65 – $0.75
Breakout Confirmation: Requires strong bullish candle close with increased volume
Volume Profile: Decreasing, typical of symmetrical triangle before explosive move
💡 Final Thoughts:
Cardano is at a make-or-break point. It has bounced from support and is attempting a breakout from this symmetrical triangle. If successful, this could mark the beginning of a major trend reversal with over +100% upside potential from current levels.
On the flip side, failure to break resistance could lead to a deeper retracement. That’s why confirmation is critical before entering a position!
#ADAUSDT #CardanoAnalysis #CryptoBreakout #SymmetricalTriangle #AltcoinSeason #BullishBreakout #BearishScenario #TechnicalAnalysis #CryptoChart #CryptoTrading #Altcoins

#ADAUSDT: Is the crypto hype finally over? ADAUSDT is likely to drop first then it can reverse and continue the bullish move upwards of previous all time high. Before we can confirm any entry on this pair we need strong confirmation which will allow us to predict a correct and accurate swing move.
If you like the work then do consider liking and commenting on the idea.
Team Setupsfx_❤️

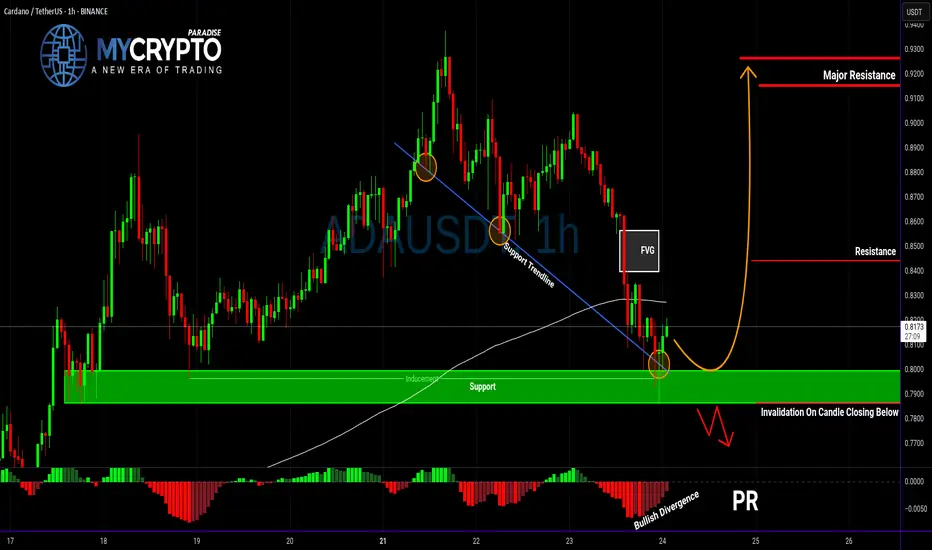
ADA About to Explode or Fakeout Trap?Yello Paradisers — is ADA quietly setting up for a powerful reversal, or are we about to walk straight into a painful bull trap? This zone could decide everything, and here’s why you need to pay close attention.
💎Cardano (ADAUSDT) is currently sitting right on the supportive trendline of a descending channel, while also forming a classic double bottom pattern. What makes this even more significant is the presence of bullish divergence on RSI. This combination alone already hints at a potential bullish reversal, but there’s more to it.
💎The current zone also served as a previous resistance area, and it has now flipped into support—this “resistance-turned-support” structure adds confluence and increases the probability of an upward move. When multiple bullish signals align at a major structural level like this, it usually sets the stage for a strong bounce.
💎Aggressive traders who entered early from current levels are already seeing a potential 1:1 risk-to-reward ratio. However, for safer and more strategic positioning, conservative traders can wait for a pullback to this support zone. Waiting for a bullish confirmation candle after the pullback can offer a better entry with a healthier RR and higher probability of success.
💎That said, if the price breaks below the current support and closes a candle below our invalidation level, the entire bullish idea will be invalidated. In that scenario, the smart move is to remain patient and wait for a new setup to form. Chasing trades after invalidation is how most retail traders get trapped—don’t be one of them.
🎖Strive for consistency, not quick profits. Treat the market as a businessman, not as a gambler. This is the only way you’ll make it far in your crypto trading journey. Be a PRO.
MyCryptoParadise
iFeel the success🌴

ADAUSDT Is Warming Up for a Major MoveYello, Paradisers! Did you notice what just happened on ADAUSDT? After sweeping liquidity, the pair has now printed a bullish internal change of character (I-CHoCH), confirmed by bullish divergence. This confluence significantly increases the probability of a bullish move from here—but only if you play it smart.
💎From the current price levels, the risk-to-reward ratio isn’t the most attractive for conservative entries. Aggressive traders might still consider taking a position with a tighter invalidation, but the trade needs to be managed with precision.
💎For those who prefer safer setups, it’s much wiser to wait for a pullback into the key support zone. A confirmed retest from there could offer a much cleaner risk-to-reward structure and a clearly defined invalidation level.
💎However, if the price breaks down and closes below that invalidation level, this entire bullish setup becomes invalid. In that case, it's best to stay patient and wait for a new structure to form before jumping back in. Entering too early in uncertain territory can turn a high-probability setup into a costly mistake.
🎖Strive for consistency, not quick profits. Treat the market as a professional, not a gambler. Discipline and timing are what separate the winners from the crowd. Be patient, wait for the high-quality trades, and execute with confidence. That’s how long-term success is built in this game.
MyCryptoParadise
iFeel the success🌴

ADAUSDT: Targeting $1.5 Long Term Swing View| Comment Your View|Hello everyone,
The cryptocurrency price is approaching a major bullish zone where it is anticipated to reverse. Price momentum has been slightly bullish in recent times, possibly due to the release of economic data that is against the US Dollar. A weak US dollar has recently influenced the cryptocurrency market volume, resulting in all-time highs. We anticipate similar or increased volume in the future.
We would appreciate your support by liking and commenting on your views about the cryptocurrency pair. Please let us know in the comments if you would like us to analyse any other cryptocurrency or trading pair.
Best regards,
Team Setupsfx_

ADAUSDT 3D Analysis ADA ~ 3D Analysis
#ADA Buy after successfully breaking through this resistance line with a short-term target of at least 10%++, long-term target $3

ADAUSDT 2D Analysis ADA ~ 2D Analysis
#ADA Buy after successfully breaking through this resistance line with a short-term target of at least 15%++
ADA Breakdown Ahead? Don’t Let This Bull Trap Fool YouYello Paradisers—are you ready for what could be a classic trap before a deeper drop? ADAUSDT is flashing multiple bearish signals that are difficult to ignore, and if you're not paying attention, this setup could catch you off guard.
💎ADAUSDT recently took a firm rejection from a key resistance zone, failing to push higher. Following that, price action broke down from a well-formed descending channel, and we’ve now seen a clear bearish Change of Character (CHoCH). These three factors together significantly increase the probability of a bearish continuation.
💎If ADAUSDT pulls back and grabs liquidity, that could offer a highly favorable opportunity to enter on the short side. The ideal scenario would be a return to the resistance zone, followed by the formation of bearish price patterns—such as rejections or bearish engulfing candles. This would confirm the intent to move lower and offer a strong risk-to-reward short setup.
💎However, if the price manages to break and close decisively above the resistance zone, this would invalidate the current bearish outlook. In that case, it's critical to remain patient and wait for cleaner, higher-probability price action to form. Forcing trades in an uncertain setup can lead to unnecessary losses, so discipline is essential here.
Strive for consistency, not fast profits. The most successful traders are the ones who wait for the market to show its hand clearly. Stay focused, stay sharp, and trade smart.
MyCryptoParadise
iFeel the success🌴

ADAUSDT 1W AnalysisADA ~ 1W Analysis
#ADA Buy gradually from here if you still have a Conviction on this coin with a short -term target of at least 20%+.

ADA Is Setting Up for a Trap? Watch This Level CloselyYello Paradisers– is ADA walking straight into a trap at resistance? The current structure is raising red flags, and traders should stay sharp.
💎ADAUSDT is moving within an ascending channel, which often signals a potential loss of bullish momentum—especially when price approaches a strong resistance area. Right now, it’s nearing a major zone that’s reinforced by the 200 EMA, acting as dynamic resistance. On top of that, a clear bearish divergence is forming, which further increases the likelihood of a downside move.
💎If price sweeps the highs to take liquidity and then prints a bearish reversal pattern from this zone, it could offer a strong short opportunity with an attractive risk-to-reward setup. This is the type of trade setup that disciplined traders focus on.
💎However, if ADA breaks out above the resistance and closes a candle above the invalidation zone, the bearish thesis is off the table. In that case, it’s smarter to stay patient and wait for cleaner price action rather than reacting emotionally.
🎖Strive for consistency, not quick profits. Treat the market as a businessman, not as a gambler.
MyCryptoParadise
iFeel the success🌴

ADAUSDT Flashing Bearish Signals – Is a Drop Incoming?Yello, Paradisers! Are we about to see a strong rejection on ADAUSDT? Let’s break it down.
💎ADAUSDT has filled the Fair Value Gap (FVG) and formed a double top with bearish divergence. Notably, the right top is slightly above the left, signaling a liquidity grab. Following this, we’ve seen a Change of Character (CHoCH) to the bearish side, increasing the probability of a downside move.
💎If ADAUSDT retraces from this level, it will strengthen a high-probability bearish setup from the 1-hour FVG, where the 0.5 Fibonacci level aligns—offering an attractive risk-to-reward (RR) opportunity for shorts.
💎However, if price breaks and closes above the 0.786 Fibonacci level, our bearish outlook will be invalidated. In that case, it would be best to step back and wait for stronger confirmation before taking action.
🎖 Patience and discipline win the game, Paradisers! Don’t chase—wait for the best setups and protect your capital like a pro.
MyCryptoParadise
iFeel the success🌴

ADAUSDT Breakout Incoming or Another Fakeout?Yello, Paradisers! Are we about to see ADAUSDT explode, or is this just another trap for impatient traders? Let’s break it down!
💎ADAUSDT is looking solid after completing a proper double zig-zag corrective phase. The key to confirming the next move lies in breaking and closing a candle above the resistance level. If this happens, it significantly increases the probability of a bullish breakout. Why? Because ADA is still trading in the discount range of a descending channel, and we’re also seeing bullish divergence—a strong confluence signal for upside momentum.
💎However, if ADA pulls back or retraces further, the smartest play is to wait for inducement. Ideally, we want to see bullish structures form, such as a bullish I-CHoCH or well-known bullish patterns like a W formation or inverse head and shoulders on lower timeframes. If those confirmations appear, the probability of a bullish move shifts in our favor.
💎On the flip side, if ADA falls sharply or closes a candle below the support zone, it would invalidate our bullish scenario. This would likely extend the corrective wave into a deeper structure, signaling that it’s best to stay patient and wait for clearer price action.
🎖 Bottom line? The market is setting up for a major move—either a powerful breakout or a deeper retracement. Only those who wait for the right confirmations will come out on top. Stay disciplined, Paradisers! 🚀
MyCryptoParadise
iFeel the success🌴

5 Key Coins: Is There Life After Bitcoin’s Correction?On the image, we can see that from December 2024 to the current moment (February 2025), the price of BYBIT:BTCUSDT.P has decreased from about 107,673 to 96,150 dollars. In other words, roughly speaking, this is about a 10–11% correction. For Bitcoin, given its historical volatility, this is a fairly acceptable movement.
🔥 What’s important to consider with such a price change:
If we look at the chart from October 2024 (or even earlier), we can understand whether there was a prolonged rise before this (which could have required a correction), or if we are seeing a deeper downward movement.
🔥 Support and Resistance Levels
On the provided screenshot, it is noticeable that the current price is slightly below the key volume level (POC). If the price settles below it, this can become an additional signal for a continued decline.
However, if BYBIT:BTCUSDT.P returns to the POC level and breaks it from below, it is often considered a sign of a possible reversal or at least a short-term bullish rebound.
🔥 Volume Profile Indicators
POC (Point of Control) around 100,000–101,000 dollars indicates that the largest trading volumes for the entire visible period are concentrated there.
This is a level around which the price may “hover,” since historically there is a large number of trades, meaning strong interests from both buyers and sellers.
🎯 Key idea: For most of the altcoins presented in the review, the further movement depends on whether BYBIT:BTCUSDT.P holds above the nearest support and whether it can overcome the nearest resistance (the POC zone on the chart).
Below is a structured analysis of five selected coins ( BYBIT:ADAUSDT.P , BYBIT:SOLUSDT.P , BYBIT:XRPUSDT.P , BYBIT:BNBUSDT.P , BYBIT:ETHUSDT.P ) taking into account the current behavior of #Bitcoin, since it often sets the tone for the entire market.
━━━━━━━━━━━━━━━━━━━━━━
📉 Cardano BYBIT:ADAUSDT.P
➡️ POC on the chart: 0.9684 USD (above the current price).
➡️ Chart structure: BYBIT:ADAUSDT.P recently tested the support level around 0.80–0.88 USD.
Scenarios:
🚀 Bullish (if BYBIT:BTCUSDT.P recovers): a possible rise to the 0.95–1.00 USD zone.
If this zone is broken and the price consolidates above 1.00 USD, further growth up to 1.10–1.20 USD can be expected.
🚀 Bearish (if BYBIT:BTCUSDT.P continues to fall): a retest of 0.80–0.85 USD and, if broken, a deeper correction down to 0.70–0.75 USD.
⚡ Trading idea:
For those considering purchases, it makes sense to wait either for confirmation of a reversal in BYBIT:BTCUSDT.P or for a breakout/consolidation above 0.95–1.00 USD.
Alternatively , place limit orders around 0.80–0.85 USD, provided that BYBIT:BTCUSDT.P does not go into an even deeper correction.
━━━━━━━━━━━━━━━━━━━━━━
📉 Solana BYBIT:SOLUSDT.P
POC on the chart: 190.53 USD (approximately coincides with the current level).
Chart structure: After falling from 280 USD, BYBIT:SOLUSDT.P dropped to the key 18–19 USD zone. Here lies the volume level (POC), which can act as a “magnet”—the price often “moves” around the POC, and if it falls below it, the POC becomes strong resistance.
Scenarios:
🚀 Bullish: with BYBIT:BTCUSDT.P rising and BYBIT:SOLUSDT.P confidently holding above 19–20 USD, a return to 22–23 USD is possible. A breakout above 23–25 USD would be a signal for further recovery (26–28 USD and beyond).
🚀 Bearish: if BYBIT:BTCUSDT.P continues to fall, BYBIT:SOLUSDT.P could drop below 18 USD and test the 15–16 USD zone, where buyers previously showed interest.
⚡ Trading idea:
Watch the behavior in the 18–20 USD zone. A breakout upward and consolidation amid a rising BYBIT:BTCUSDT.P may provide a quick target of 22–23 USD.
In a bearish scenario, it makes sense to see how the price reacts at 15–16 USD—a possible buyback zone for medium-term positions.
━━━━━━━━━━━━━━━━━━━━━━
📉 XRP BYBIT:XRPUSDT.P
POC: ~0.54–0.55 USD (above the current price).
Chart structure: BYBIT:XRPUSDT.P is in a fairly wide range: resistance at 0.45–0.50 USD and support around 0.35 USD. The volumes, judging by the profile, are concentrated above current quotes, which may indicate the need for an additional impulse for growth.
Scenarios:
🚀 Bullish: with positive market movement and BYBIT:BTCUSDT.P , BYBIT:XRPUSDT.P may test 0.45–0.50 USD. If it manages to consolidate above 0.50 USD, the path to 0.55–0.60 USD opens up.
🚀 Bearish: if the correction of BYBIT:BTCUSDT.P continues, BYBIT:XRPUSDT.P may drop back to 0.35 USD, and in case of a strong market sell-off—even to around 0.30 USD.
⚡ Trading idea:
For long-term positions, many focus on the resolution of legal issues (SEC vs Ripple), so the fundamental background plays a role.
Technically, the 0.35 USD zone is of interest for purchases, as well as a breakout of 0.45–0.50 USD for aggressive trading in anticipation of a faster rise.
━━━━━━━━━━━━━━━━━━━━━━
📉 Binance Coin BYBIT:BNBUSDT.P
POC: ~710 USD (noticeably above the current price).
Chart structure: BYBIT:BNBUSDT.P is generally supported by the Binance ecosystem, but it also declines with the global market downturn. The chart shows several horizontal levels in the 600–650 USD range that can act as trading zones.
Scenarios:
🚀 Bullish: if the market recovers, BNB can quickly return to 650–670 USD. A breakout and consolidation above 700 USD opens the way to 730 USD and beyond.
🚀 Bearish: if BYBIT:BTCUSDT.P falls, a pullback to around 580–600 USD is possible. In the case of a strong sell-off—an even deeper move toward 550 USD.
⚡ Trading idea:
BYBIT:BNBUSDT.P often shows relative “resilience” due to its high demand on the Binance exchange (trading pairs, staking, Launchpad, etc.).
Technically, 600 USD is an interesting key support level. For a short-term long, a breakout and consolidation above 650–670 USD is needed.
━━━━━━━━━━━━━━━━━━━━━━
📉 Ethereum BYBIT:ETHUSDT.P
POC: around 3,100 USD (above current levels).
Chart structure: BYBIT:ETHUSDT.P is in the 2,400–2,700 USD range. For a bullish scenario, it is important to get back above 2,800 USD, which would open the potential to 3,000–3,100 USD.
Scenarios:
🚀 Bullish: if BYBIT:BTCUSDT.P grows and the news background is positive (network development, DeFi, Layer2), BYBIT:ETHUSDT.P can quickly recover to 2,800–3,000 USD.
🚀 Bearish: if BYBIT:BTCUSDT.P moves negatively—correction to 2,400 USD, and in the case of a strong sell-off—a test of 2,200 USD.
⚡ Trading idea:
BYBIT:ETHUSDT.P is closely tied to the fundamentals of the DeFi and Layer2 ecosystem, so in addition to BYBIT:BTCUSDT.P dynamics, it is important to monitor network updates and overall market sentiment.
━━━━━━━━━━━━━━━━━━━━━━
📢 Correlation with BYBIT:BTCUSDT.P : All of the mentioned altcoins ( BYBIT:ADAUSDT.P , BYBIT:SOLUSDT.P , BYBIT:XRPUSDT.P , BYBIT:BNBUSDT.P , BYBIT:ETHUSDT.P ) continue to closely correlate with Bitcoin’s movement. If BYBIT:BTCUSDT.P manages to hold current support and break above the nearest resistance, there is a high likelihood that the alts will bounce in unison.
📢 Volume levels: All the coins have their POC above current prices, which often means that for a confident rise, the price needs to move back above the “point of control” in the volume profile. While the price remains below the POC, there is a risk of further stagnation or decline.
📢 Support zones:
📉 BYBIT:ADAUSDT.P 0.80–0.85 USD
📉 BYBIT:SOLUSDT.P 15–16 USD
📉 BYBIT:XRPUSDT.P 0.35 USD
📉 BYBIT:BNBUSDT.P 600 USD (then 580–550 USD)
📉 BYBIT:ETHUSDT.P 2,400 USD (then 2,200 USD)
📢 Points of interest for long positions:
Breakout and consolidation above the POC or key horizontal resistances.
Testing support zones (if there are reversal signals).
📢 Risk management:
Due to high volatility, it is important to set stop-losses and consider the possibility of false breakouts. If BYBIT:BTCUSDT.P experiences a stronger decline, it is not advisable to try to “ride out” a strong downtrend in altcoins without a clear plan.
📢 In the short term, the market is in a waiting mode—monitoring whether BYBIT:BTCUSDT.P can recover and hold above the nearest resistances.
In the medium term, fundamentals (project development, legal news for BYBIT:XRPUSDT.P , updates for BYBIT:ETHUSDT.P , etc.) will play a decisive role, but without positive movement from BYBIT:BTCUSDT.P , strong growth in alts usually does not occur.
Use these levels and scenarios as guidelines for your own strategy, complementing them with fundamental analysis and news.
Good luck, friends. Follow our forecasts, leave comments, let’s stay in touch!

#ADAUSDT Approaching Key Resistance – Breakout or RejectionBYBIT:ADAUSDT.P is showing strong bullish momentum, breaking above the $0.8150 resistance zone. Volume is increasing, confirming buyer interest, and the price remains above POC $0.7848, supporting the uptrend. However, the next move will depend on the reaction at $0.8190.
📊 LONG BYBIT:ADAUSDT.P from $0.8190
🛡 Stop Loss: $0.8085
⏱ 1H Timeframe
✅ Overview:
➡️ BYBIT:ADAUSDT.P is testing the upper boundary of its recent range, attempting to hold above $0.8150.
➡️ Buyers are active, but confirmation of the breakout is still needed.
➡️ Holding above $0.8190 would increase the likelihood of reaching $0.8410.
⚡ Plan:
✅ Long confirmation requires a breakout above $0.8190 with strong volume.
✅ If volume decreases, a pullback to $0.8085 is possible before further upside.
✅ Another option is a retest of $0.8150 before a new breakout attempt.
🎯 Take Profit:
TP1: $0.8410 – next resistance level.
🚀 BYBIT:ADAUSDT.P is gaining strength — expecting a test of $0.8410!
⚡ Best approach – watch price reaction at $0.8190. If price holds above this level, the long trade remains valid. If weakness appears, a pullback to $0.8085 is likely.
⚡ Key rule – wait for confirmed breakout before entering, don’t anticipate it!

ADA/USD "Cardano vs US Dollar" Crypto Market Heist Plan🌟Hi! Hola! Ola! Bonjour! Hallo!🌟
Dear Money Makers & Robbers, 🤑 💰
Based on 🔥Thief Trading style technical and fundamental analysis🔥, here is our master plan to heist the ADA/USD "Cardano vs US Dollar" Crypto market. Please adhere to the strategy I've outlined in the chart, which emphasizes long entry. Our aim is the high-risk Red Zone. Risky level, overbought market, consolidation, trend reversal, trap at the level where traders and bearish robbers are stronger. 👀 Be wealthy and safe trade.💪🏆🎉
Entry 📈 : You can enter a Bull trade at any point after the breakout or reversal.
Buy entry should break and retest (1.1500)
Stop Loss 🛑: Using the 4h period, the recent / nearest low or high level.
Goal 🎯: 1.5000 (or) Escape before the target
Scalpers, take note : only scalp on the Long side. If you have a lot of money, you can go straight away; if not, you can join swing traders and carry out the robbery plan. Use trailing SL to safeguard your money 💰.
Warning⚠️ : Our heist strategy is incompatible with Fundamental Analysis news 📰 🗞️. We'll wreck our plan by smashing the Stop Loss 🚫🚏. Avoid entering the market right after the news release.
Fundamental Outlook 📰🗞️
The ADA/USD is expected to move in a bullish direction
Cardano Network: The Cardano network is expected to undergo a significant upgrade, which could improve its scalability and usability.
Partnerships: Cardano has partnered with several major companies, including IBM and Google, which could increase its adoption and usage.
Regulatory Environment: The regulatory environment for cryptocurrencies is expected to become more favorable, which could increase investor confidence and demand for ADA.
Competition: The competition in the cryptocurrency market is expected to increase, which could lead to a decrease in the market share of other cryptocurrencies and an increase in the market share of ADA.
Technical Developments: The Cardano team is expected to release several technical developments, including a new wallet and a decentralized exchange, which could improve the user experience and increase adoption.
UPCOMING NEWS:
Cardano Summit: The Cardano Summit is scheduled to take place on February 20-21, which could lead to an increase in investor interest and demand for ADA.
Network Upgrade: The Cardano network upgrade is expected to take place on March 1, which could improve the scalability and usability of the network and increase adoption.
Partnership Announcements: Cardano is expected to announce new partnerships with major companies, which could increase its adoption and usage.
Please note that this is a general analysis and not personalized investment advice. It's essential to consider your own risk tolerance and market analysis before making any investment decisions.
Take advantage of the target and get away 🎯 Swing Traders Please reserve the half amount of money and watch for the next dynamic level or order block breakout. Once it is resolved, we can go on to the next new target in our heist plan.
Keep in mind that these factors can change rapidly, and it's essential to stay up-to-date with market developments and adjust your analysis accordingly.
💖Supporting our robbery plan will enable us to effortlessly make and steal money 💰💵 Tell your friends, Colleagues and family to follow, like, and share. Boost the strength of our robbery team. Every day in this market make money with ease by using the Thief Trading Style.🏆💪🤝❤️🎉🚀
I'll see you soon with another heist plan, so stay tuned 🫂

ADAUSDT 8HADA ~ 8H Analyst
#ADA In Time Frame 8H, #Cardano Successfully penetrated this bullish pattern and is currently still blocked by this resistance block. Further increases are expected from here.

ADAUSDT: First Entry Going Good, What About Second One?Dear Traders,
Hope you are doing great, our first entry is going good. Now we are onto the possible second entry which can become a swing entry for people who are looking for swing opportunities. Good luck.

ADA/USD "Cardano vs USD" Crypto Market Heist Plan on Bearish🌟Hi! Hola! Ola! Bonjour! Hallo!🌟
Dear Money Makers & Robbers, 🤑 💰
Based on 🔥Thief Trading style technical analysis🔥, here is our master plan to heist the ADA/USD "Cardano vs USD" Crypto market. Please adhere to the strategy I've outlined in the chart, which emphasizes short entry. Our aim is the high-risk Green Zone. Risky level, oversold market, consolidation, trend reversal, trap at the level where traders and bullish robbers are stronger. 👀 So Be Careful, wealthy and safe trade.💪🏆🎉
Entry 📉 : New Entry Traders / Robbers should enter a short trade after the breakout of Blue Moving Average Level,
however I advise placing sell limit orders within a 15 or 30 minute timeframe. Entry from the most recent or closest high level should be in retest.
Stop Loss 🛑: Using the 3H period, the recent / nearest high level.
Goal 🎯: 0.6500
Scalpers, take note : only scalp on the Short side. If you have a lot of money, you can go straight away; if not, you can join swing traders and carry out the robbery plan. Use trailing SL to safeguard your money 💰.
Warning⚠️ : Our heist strategy is incompatible with Fundamental Analysis news 📰 🗞️. We'll wreck our plan by smashing the Stop Loss 🚫🚏. Avoid entering the market right after the news release.
Take advantage of the target and get away 🎯 Swing Traders Please reserve the half amount of money and watch for the next dynamic level or order block breakout. Once it is resolved, we can go on to the next new target in our heist plan.
💖Supporting our robbery plan will enable us to effortlessly make and steal money 💰💵 Tell your friends, Colleagues and family to follow, like, and share. Boost the strength of our robbery team. Every day in this market make money with ease by using the Thief Trading Style.🏆💪🤝❤️🎉🚀
I'll see you soon with another heist plan, so stay tuned 🫂

ADAUSDT 1WADA Update ~ 1W
#ADA If you still have Conviction on the coin,. Buy gradually within this support block,. This coin is still in a very bullish trend.
