ADAUSDT - let's grow))Preconditions:
- global uptrend
- local uptrend
- local accumulation
good luck)
last idea.
Adausdtrade


ADAUSDT - growth is predictable Have you heard about the 100% income?
Cryptocurrency provides such opportunities.
Crypto opens up new opportunities.
don't forget the risks.
last deal:

ADA Cardano Analyze By Persian crypto master Daniyal DaraeiHi
Like it before reading please
cardano made a good symmetrical triangle on daily time frame , and we have good support line on 0.13 and resistance on 0.15 , it can made a great consolidation on this triangle and it can break triangle upward to get on targets that i'd showed on the chart.
0.20$ could be first target and the second could be on 0.2355
consolidation in 5 to 10 days could make bullishness before breaking out
FOLLOW us , this idea will get update soon
;)
Daniyal daraei

ADA amazing profits in just 3 daysADA / USD
Another amazing call here on ADA along with XLM
Price reached my target in just 3 days !
And we made more than 70% on spot
you can check original signal/call here 👇👇:
Hope you get profit in my call / signals / ideas
Support me by likes comments and follow
Good luck and happy trading 🌹

ADA Triangle breakout Price is breaking the triangle here and ready to move higher
You can buy the retest price also has good trend line support below ready so possible bounce also from this zone too.
or enter retest if you want to play safe

ADA short term targetsADA Cardano short term targets are achievable... what's next? wait to update this chart ;)


ADA/USDT : It takes more time to say something certain.It did not feel very realistic for ADA to break its falling trend. That's why I'm not taking any positions for the ADA. It takes more time to say something certain.


CARDANO (ADAUSDT) - Buying on the rebound?perfect level pressure.
accumulation under a key level.
global trend up.
local trend up.
Friends, push the like button, write a comment, and share with your mates - that would be the best THANK YOU.
P.S. I personally will open entry if the price will show it according to my strategy.
Always make your analysis before a trade


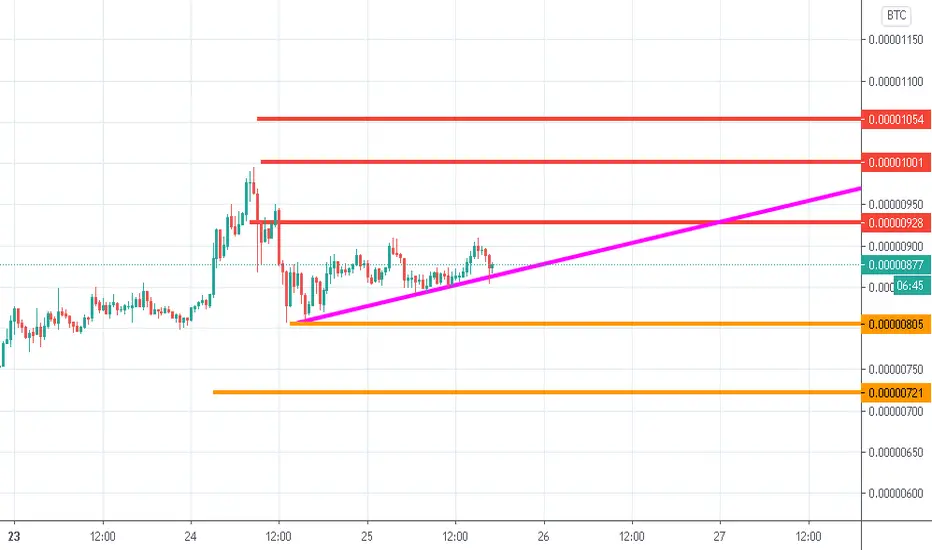
ADA/BTC "LONG" POSITIONADA CONTINUES ITS RISE TREND. The pattern is canceled below the orange line. Red lines indicate 3 targets. The purple line is the trend line . The risk increases if it falls below the purple line. If bitcoin experiences a sudden price movement, it can drop to 754. Stop lose should be kept close
ADA/USDT "LONG" POSITIONthere are two strategies. can give you the opportunity to buy. purple line can be expected for purchase, but we need to follow it. The red line may need to be crossed with the bulky candlestick for the first and second targets to arrive. Trading involves high risk due to the possibility of the BTC's sharp fall.

ADA/USDT (Reversing from the support line)ADAUSDT : Strong support at 0.089 and Now ADA started reversing from the strong support level.
Entry level : 0.089 - 0.093
Resistance level 1: 0.100
Resistance level 2: 0.113
Resistance level 3: 0.128
Resistance level 4: 0.153
Stoploss: below the support line (0.089)

ADA/USDT still bearish?ADA / USDT has been showing signs of correction for some time and, in my view, it will have continued with the first support test marked on the chart and if it loses, we will try the next support below with up to 45% of the loss of value.
Another possibility is a test on the first support to later try to escape the triangle with the value of 0.12 USDT as the first resistance.
The support zones fit well with the 0.618 and 0.786 Fibonacci retraction levels.
Ps: This is not a financial advice, always do your own research ...

Ada/usdt forming rising wedgeAda/usdt
The price try to form rising wedge
However this form is a bearish pattern
But we can see small pump to 0.12$ level before next movement
**Any daily close below trendline support can very bearish


ADAUSDT ANALYSISADA In an ascending channel
A serious resistance and buying saturation in the current range has given a good opportunity for shorts
Examine bitcoin and trade carefully :)

ADA.USDT (Y20.P4.E1.v2).Looking for the next long ** A continuation of the previous post, link provided below **
Hi All,
Just a reminder:
Most Traders are stating that we are in the earlier stages of a bull run, not just BTC but SP500 and Gold.
So what we are seeing is a likely ABC correction.
We have 2 types of possible correction, a mild or deep correction as I explained in my SP500 latest post.
With the SP500 we have hit the mild correction target of 3230, if its to be deeper, then 3230 is point A (refer to me chart below or previous post)
=======================================================
If your one of those who want to go long with Cardano, along with LINK, LEND, KAVA, defi well performing coins, then here is the area where I will be looking to buy the dips.
Strategy: You are unlikely to find the bottom so start buying the dips, in this green zone.
If SP500 has hit its target, then we should see some bottom formation here and likewise with BTC we still maintain a lower high, charts below.
For now, it looks like the SP500 is holding along with the US dollar index, so a bounce is looking more likely.
Note the hidden bullish divergence with price and the RSI
Please give me a like or tick for this post.
Regards,
S.SAri
Current SP500 chart, wedge formation with a bullish div. in the short time period
BTC\SP500 correlation
My thoughts on the US dollar
BTC chart
PREVIOUS POST:

adausdt analysis x canal THIS IS NOT AN INVESTMENT PROPOSAL. My personal opinion. If you find this useful and want more guesses. don't forget to follow. Press the Like button. Leave your feedback to us in the comments section! Thank you very much for your support. Let us know how you see this opportunity and forecast in the comments.


