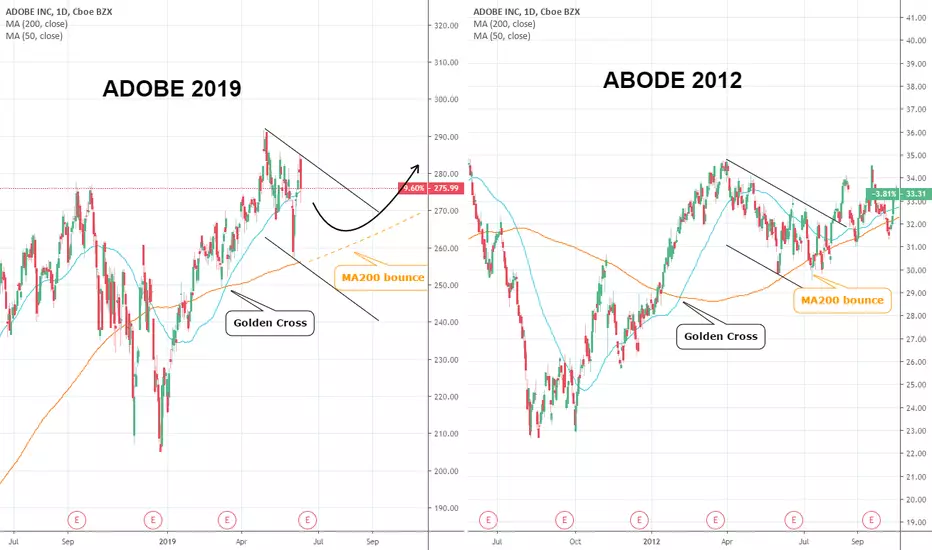
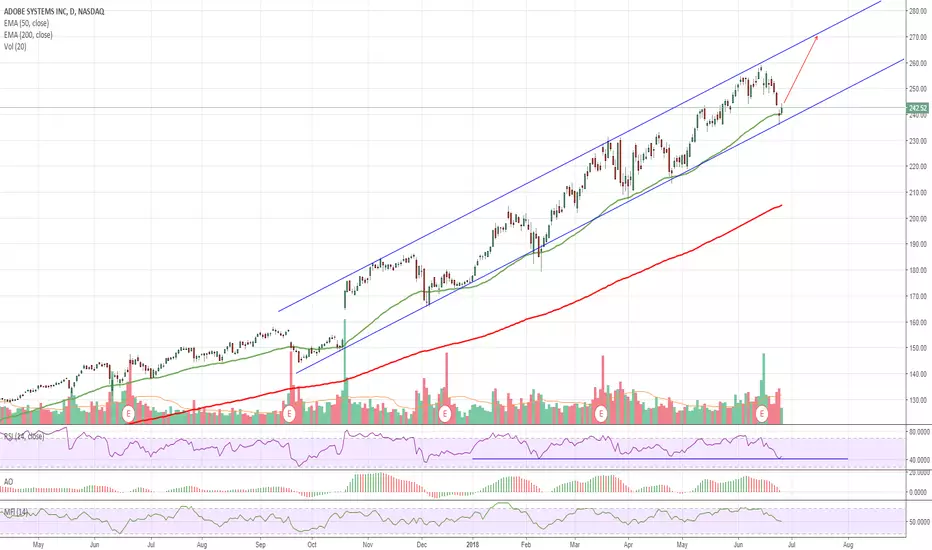
Adobe: One last round of volatility before the new bull run.Adobe Inc is pulling back inside a 1D Channel Down (MACD = -0.030, RSI = 51.065, Highs/Lows = 0.0000) after the late April High. Having made a Golden Cross formation in mid March, is waves a long term buy signal. But on the shorter term a tough phase is expected where the 1D MA200 should be tested again, most likely providing the necessary support for the new long term bull cycle.
At least this is what happened on the last occurrence of the Golden Cross in in 2012. Golden Cross, then a market Top, same break below the MA50 inside a Channel Down and multiple tests of the MA200 which eventually held. Our long term TP for Adobe is 310.
** If you like our free content follow our profile (www.tradingview.com) to get more daily ideas. **
Comments and likes are greatly appreciated.
ADBE
ADBE : Long opportunityADBE just had a positive ER for this quarter.
This stock gapped up after earning report, filled the gap a few days later as a result of profit taking.
ADBE has managed to hold above resistance-turned-support line in the mid of bloody red market after Trump's China Tariff tweet.
It will most probably bounce higher for the next few weeks.

$ADBE Adobe, resistance turns in to support, $300 incoming$ADBE Adobe, resistance turns in to support, $300 incoming

ADBE: bearish signalOn the daily chart of Adobe shares, a bearish divergent bar was formed after a 5 sub-waves structure in the latest bullish wave. I expect an ABC corrective movement, which would be my profitable zone.
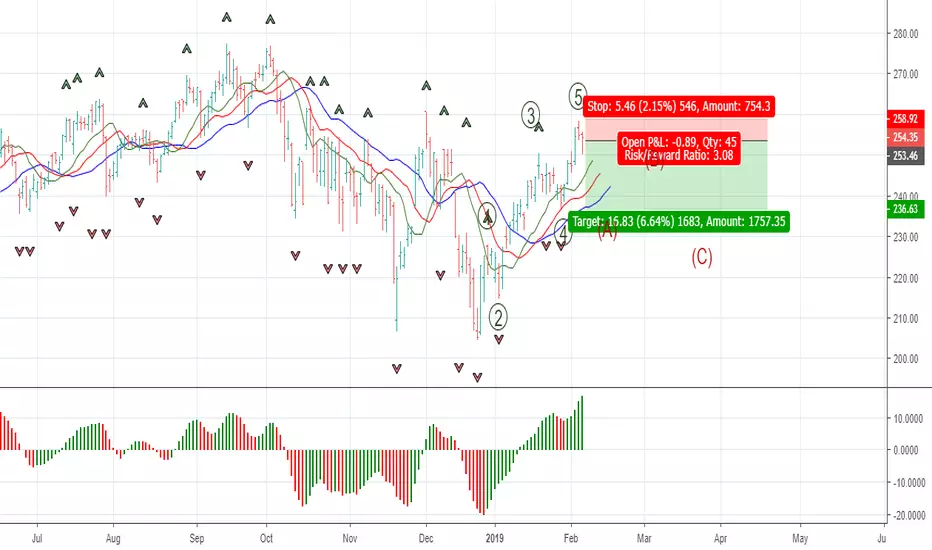
Open a PUT Option or SHORT THE SHIT out of $ADBE | #Adobe! Open a PUT Option or SHORT THE SHIT out of $ADBE | #Adobe!


THE WEEK AHEAD: ADBE, COST EARNINGS; OIH, XOP, UNG DIRECTIONALSPersonally, I'm not doing a ton here beyond looking at cleaning up remaining December cycle setups and evaluating whether there are poo piles that should be looked at for the taking of tax loss in the margin account before year's end. Nevertheless, here's an outline of what's potentially playable in the coming week ... .
ADBE (81/49) announces earnings on Thursday the 13th after market close. The 20-delta, January 18th 210/270 short strangle is paying a whopping 8.05/contract at the mid price, with the 25-delta January 18th 215/220/265/270 paying greater than one-third the width of the wings at a mid price of 2.13. Markets are showing quite wide at the moment, particularly in the defined risk setup, however, so it may prove unattractive at New York open from a liquidity standpoint.
COST (76/31) also announces on Thursday after market close, but the background implied isn't generally what I'm looking for in an earnings-related volatility contraction play (generally, >50% is where I draw my "picky line").
On the exchange-traded fund front, petro leads the pack, with OIH rank/implied metrics coming in at 95/47, XOP at 79/44, and UNG at 72/86. With OPEC reaching an agreement late last week as to production cuts, I lean toward bullish assumption setups with time to work out/reduce cost basis, since it will take awhile for any cuts to appear in the pipeline. For example: an XOP June/Feb 25/34 upward call diagonal,* 6.55 debit/contract, break even at 31.55 versus 31.54 spot, max profit on setup of 2.45, 72.8% debit paid/spread width ratio. I'm already in a similar OIH bullish assumption setup, which is proving to be a "pulled the trigger" too soon type of thing. The back month in the OIH setup is in April, so I've still got time to reduce cost basis and for the trade to work out in some fashion, even though it's a bit of a rough sled here.
With UNG in particular, I continue to look at a bearish assumption seasonality play, but markets on any given setup have been ugly wide, no matter what type of setup I seem to look at, and lack of liquidity is not your friend when doing an options setup.
For broad market premium sellers: SPY (47/30), IWM (78/25), QQQ (69/27).
* -- Buy the June 25, sell the February 34.

[ADBE] Phase 3The price is oscillating the 30MM. We can see the Resistant and the Support. Sell! Don't buy until the price breaks the Resistant.

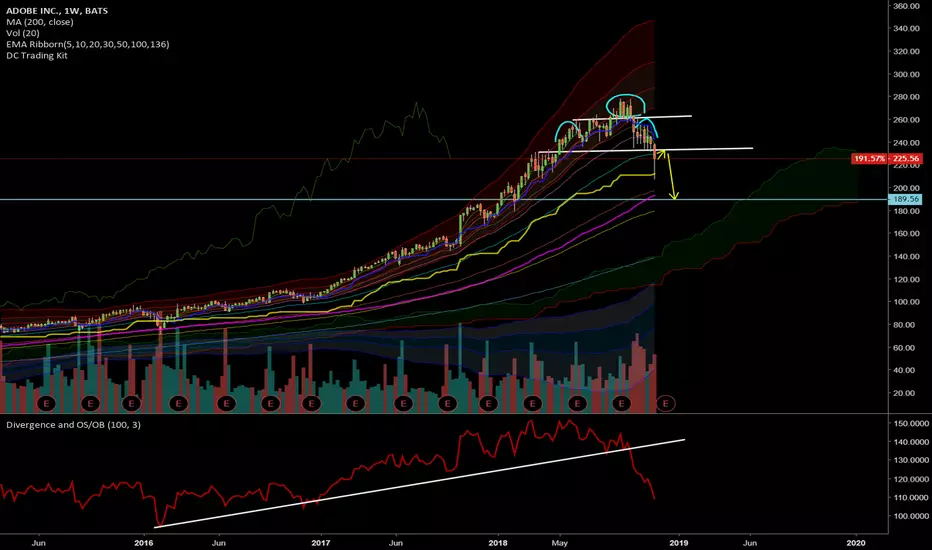
Short ADBE (one of the easiest short ever)Weekly fake breakout at the top along with HS pattern. It has broken down the neckline. I would like to short at ~230 if it has a retest. TP: 189
Pattern is similar to INTU. See the following linked idea.


Bears eyeing ADBE divergenceADBE has been a beast for a long time, but there are signs the bulls may be exhausting. The daily chart is looking toppy with upper wicks of profit taking and clear resistance at 272.50, and a potential bearish reversal Head & Shoulders pattern forming on the daily. The support to break is 257 to confirm the pattern.
The daily chart is setting up minor RSI bearish divergence and pretty significant MACD bearish divergence.
This is one I'm going to wait for to come to me. Bearish RSI and MACD divergence on the weekly can be seen going back to November 2017 and the odds are always against the bear standing in front of a bull stock at all time highs. Any bears who took this short at the first sign of the divergence have long become insolvent.

adbe _longThe stock is in an upper trend inside a very strong up channel . my targets is on the graph . it will take some time to get there but the stock is definitely a long trade

The Gottcha ADBE TrendThe ADBE Trend is one that is often a “gottcha” for new swing traders. The problem is trading leadership. The runs are not initiated by Dark Pools or Pro Traders. The runs are initiated by smaller funds using VWAP or, worse, the retail crowd. The retail crowd is more emotional, has less experience and minimal training. Therefore, the runs they create are harder to trade. Try to avoid trading stocks that lack strong runs. Strive to trade with the Pro Traders, as the follow-through of the run is more reliable and the profits are usually much higher. This is not the ideal stock for swing trading at this time.
Martha Stokes, CMT

Adobe: in watchlist for next week.270-272 is a resistance level: my forecast is that adobe will not breach this area today 2018-09-14.
I'll add ADBE in my watchlist for next week because, after a retracement (down from overbought area of stochastic), will go long and will break the resistance area 270-272.

Selling Adobe sharesAt the hourly chart of ADBE, the price is in a corrective wave after a bearish impulse, as it had recently rebounded from the 61.8 Fibo level. Also, a sell signal was formed in a form of the latest fractal. Breakdown of its level would be an optimal level to open short with SL at the peaks of the correction.

$ADBE Back at Buy Point$ADBE Adobe back at what looks to be a low risk/high reward buy point holding the long term bullish channel yesterday. Looking for a near term bounce, targeting $260-$265 range by mid-Sept.
Note: Informational analysis, not investment advice.

$ADBE Adobe Bullish C&H$ADBE forming a cup & handle pattern on the hourly chart. Monitor for a strong break through previous high of $259.50 in the coming days.
Targeting mid-$270s in the near term.
Note: Observation/opinion, not investment advice.

$ADBE Adobe Continued Ascension$ADBE Adobe looking like a solid buy after tagging the lower trend line yesterday (while holding the 50d ema) of a tight bullish channel it's been riding since late 2017. RSI has not dropped below 40 this year and reversed off that level today. Adobe is a solid company with a great track record of earnings beats. Two possible trade targets below.
Short term target - $258.90 (previous ATH)
Medium term target - $270.00 (upper channel limit)
Note: Observation/opinion, not investment advice.
[MSFT] Strong Tech Stock Looking to break Resistance at ATH!Similar breakout setup to CSCO and ADBE.
Adobe's leading out of the triangle, I suspect both MSFT and CSCO are gonna follow suit in strong way.
MSFT's an all around solid company, not much to say other than they have huge influence on the sector and aren't failing to innovate. Azure Cloud platform is challenging Bezos' cloud at AMZN, the Windows OS will be fueling growth for a long long time, and they're always getting into new areas of expansion by building on top of the core Windows products.

Adobe ADBE slowstochastic is coming up!Adobe ADBE slowstoch is coming out the 20 zone.
Title is coming from a 6 consecutive loosing days and slowstochastic crossing above 20 could be a good signal of reversing.
Stock strenght is above 63.
Watch the stock and lets see on lower timeframes if there is a entry signal (may be 212 to 212.24).
If today the stock makes a PBT&CA at 212.24 that is my entry point!
Disclaimer:
This is just my tought: don't invest based on this idea.

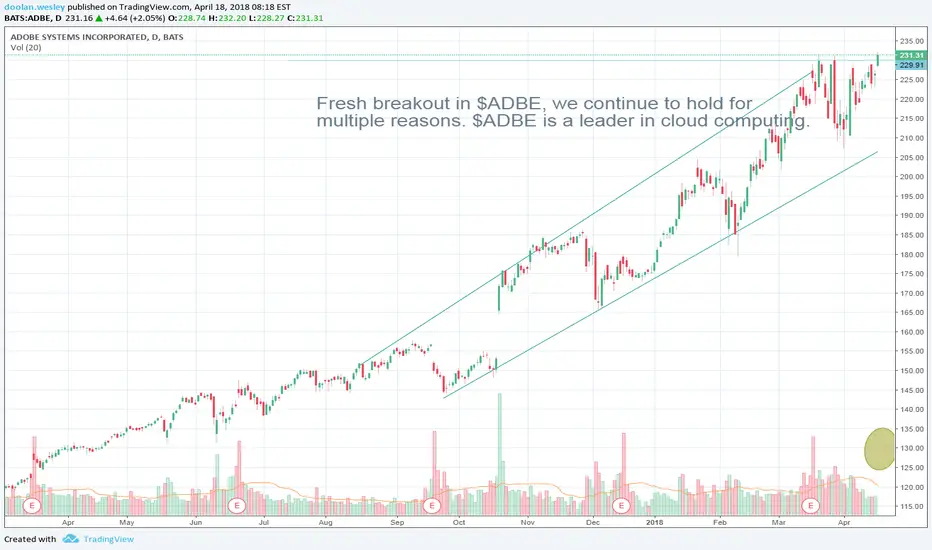
ADBE BREAKING OUT$ADBE breaking out! Great company and great stock. We love these fundamental metrics: OM 30%, ROIC 17%, FCF % Sales 37. We remain long!
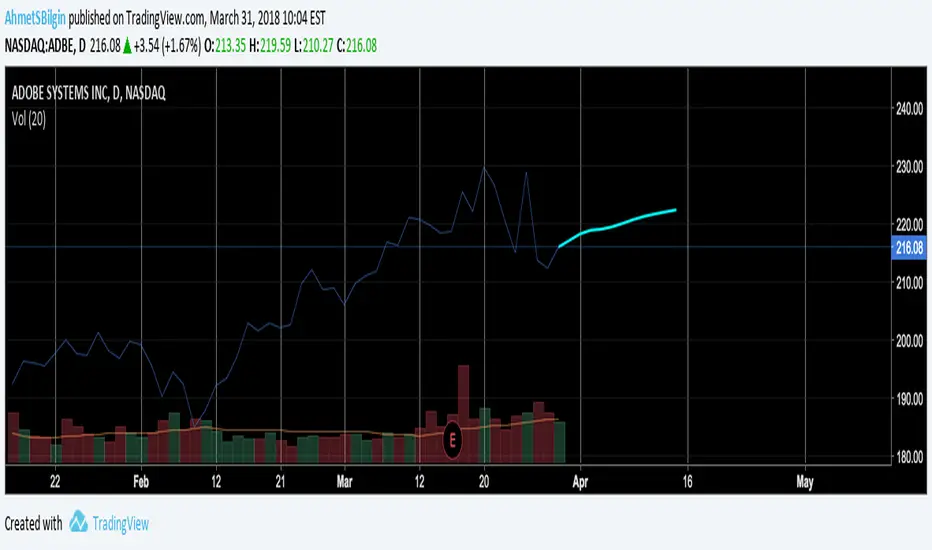
ADBE 10-Day-Ahead Prediction - 04/02-04/13 PeriodAI/Deep Learning Enabled 10 Day Ahead Predicted values for Adobe Systems Inc - ADBE have been plotted on the chart.
The method used in this prediction is Deep Learning based, and using complex mathematical models to extract hidden time series features in vast amounts of ADBE related data.
The expected 5 Day Change is 1.8900 %
The expected 10 Day Change is 2.9667 %
Predictability Indicator is calculated as : 0.823
Predicted 10-Day Ahead Prices are as follows:
Mon Apr 02 Tue Apr 03 Wed Apr 04 Thu Apr 05 Fri Apr 06
218.33 218.97 219.16 219.56 220.16
Mon Apr 09 Tue Apr 10 Wed Apr 11 Thu Apr 12 Fri Apr 13
220.81 221.36 221.78 222.14 222.49
Please note that outliers/non-linearities might occur, however our AI Enabled predictions indicate the softened/smoothed moving direction of the stocks/commodities/World indices/ETFs/Foreign Currencies/Cryptocurrencies.