ADBE IS ON AN IMPORTANT WEEKLY KEY ZONEFor more updates, please follow my TradingView page, and if you find the content useful, kindly hit the "thumbs up" button to show your support. If you have any queries regarding trading, please feel free to send me a direct message on TradingView. Additionally, please share this content with your friends who may find it beneficial.
Please note that any trading updates provided here are for educational purposes only, and it is always advisable to conduct your own research before making any investment decisions. It is important to ensure that all conditions are met before following any trade plan suggested in this update.
ADBE

Adobe: Well On The Way 👍Adobe is well on the way to completing wave B in green, although the course still has got some room to expand the current movement. However, before the resistance at $402.49 at the latest, it should turn downwards again. Thus, the share should drop below the support at $278.23 and into the adjacent gray zone between $278.96 and $227.74, where it should then conclude wave b in gray. There is a 32% chance, though, for Adobe to continue the ascent above the resistance at $402.49. In that case, we would consider wave alt.b in gray to be already finished.

Adobe (ADBE) - Hidden bullish divergence On the chart, we can see a hidden bullish divergence. This means that the price will probably increase in the next coming period. Also, the gap needs to be filled and the earning announcement looks positive, these suggestions are in line with the hidden bullish divergence.
So an entry can be taken when the price breaks to the upside. Take your profits at the targets. All further details are shown on the chart.
Goodluck!

Drop to 350s in coming weekADBE needs to establish support near the breakout level before continuing higher.
It’s a bearish Wolfe wave with near term downside to at least 357

HaresWith elevated rates it's an unattractive path forward in lieu of a squeezed blow off.
Real value in the gray band
source: FASTgraphs

Adobe in a flag?Adobe - 30d expiry - We look to Buy at 328.71 (stop at 312.61)
Daily signals are mildly bullish.
Price action is forming a bullish flag which has a bias to break to the upside.
Trend line support is located at 327.
We look to buy dips.
We are trading at oversold extremes.
This stock has seen good sales growth.
50 1 day EMA is at 329.
Our profit targets will be 368.88 and 372.88
Resistance: 355.67 / 365.00 / 380.00
Support: 340.00 / 325.00 / 320.20
Disclaimer – Saxo Bank Group.
Please be reminded – you alone are responsible for your trading – both gains and losses. There is a very high degree of risk involved in trading. The technical analysis , like any and all indicators, strategies, columns, articles and other features accessible on/though this site (including those from Signal Centre) are for informational purposes only and should not be construed as investment advice by you. Such technical analysis are believed to be obtained from sources believed to be reliable, but not warrant their respective completeness or accuracy, or warrant any results from the use of the information. Your use of the technical analysis , as would also your use of any and all mentioned indicators, strategies, columns, articles and all other features, is entirely at your own risk and it is your sole responsibility to evaluate the accuracy, completeness and usefulness (including suitability) of the information. You should assess the risk of any trade with your financial adviser and make your own independent decision(s) regarding any tradable products which may be the subject matter of the technical analysis or any of the said indicators, strategies, columns, articles and all other features.
Please also be reminded that if despite the above, any of the said technical analysis (or any of the said indicators, strategies, columns, articles and other features accessible on/through this site) is found to be advisory or a recommendation; and not merely informational in nature, the same is in any event provided with the intention of being for general circulation and availability only. As such it is not intended to and does not form part of any offer or recommendation directed at you specifically, or have any regard to the investment objectives, financial situation or needs of yourself or any other specific person. Before committing to a trade or investment therefore, please seek advice from a financial or other professional adviser regarding the suitability of the product for you and (where available) read the relevant product offer/description documents, including the risk disclosures. If you do not wish to seek such financial advice, please still exercise your mind and consider carefully whether the product is suitable for you because you alone remain responsible for your trading – both gains and losses.

ADBE Adobe Inc Options Ahead Of EarningsLooking at the ADBE Adobe Inc options chain ahead of earnings , i would buy the $325 strike price Puts with
2023-01-20 expiration date for about
$17.25 premium.
If the options turn out to be profitable Before the earnings release, i would sell at least 50%.
Looking forward to read your opinion about it.

Adobe nasdaq adbe 1 month longAdobe nasdaq adbe 1 month long
monero adobe 1 ay long dayısı hadi
chart long short patladı

Weekly trade setup in ADBE for christmas/january effect rally$ADBE The wolfe wave indicator is increasing in popularity as we continue to see more people using it and enjoying the results. There is a massive setup for a gap fill 425 before filling any of the gaps above. The gaps that are above will likely fill on the next earnings run up or early January 2023.
The weekly setup was triggered the last week of October and chopped into CPI and PPI reports. The projected target is calculated by extending a linear line between pivot 1 and 4 and projecting the line. This is represented as the green perforated line, as shown in the chart. The projected target is around 458 with estimated time of arrival sometime last week of January 2023. Stops would be considered if the daily price closes under the 6 day ma. I hope all of you bank on this!

ADBE weekly bullish setup$ADBE The wolfe wave indicator is increasing in popularity as we continue to see more people using it and enjoying the results. There is a massive setup for a gap fill 425 before filling any of the gaps above. The gaps that are above will likely fill on the next earnings run up or early January 2023.
The weekly setup was triggered the last week of October and chopped into CPI and PPI reports. The projected target is calculated by extending a linear line between pivot 1 and 4 and projecting the line. This is represented as the green perforated line, as shown in the chart. The projected target is around 458 with estimated time of arrival sometime last week of January 2023. I hope all of you bank on this!

ADBENot financial advice. The essence of investing & trading is the intelligent and patient preying on the greed, fear, impatience, addiction and ignorance of the majority. It's definitionally

Adobe Analysis 20.11.2022Hello Traders,
welcome to this free and educational analysis.
I am going to explain where I think this asset is going to go over the next few days and weeks and where I would look for trading opportunities.
If you have any questions or suggestions which asset I should analyse tomorrow, please leave a comment below.
I will personally reply to every single comment!
If you enjoyed this analysis, I would definitely appreciate it, if you smash that like button and maybe consider following my channel.
Thank you for watching and I will see you tomorrow!

ADOBE INC - BEARISH CENARIOTough times for Adobe and its investors.
The software giant is facing the biggest stock decline in years. The price already reached the COVID-19 bottom and it looks like this is not the end.
The rapid lifting of the interest rates by the central banks means more reduction in consumer demand and lesser price increases. In the near term, sales and profit margins are likely to drop from current estimates.
Adobe Inc recently announced a lowered revenue guidance for 2023 also affected by the change in the currency rates.
In a short-term correction is possible to the major resistance located at the $ 300.
The long-term scenario is a breakout of the local $ 270 support level and a new drop to the $ 205 support level.
Risk Disclosure: Trading Foreign Exchange (Forex) and Contracts of Difference (CFD's) carries a high level of risk. By registering and signing up, any client affirms their understanding of their own personal accountability for all transactions performed within their account and recognizes the risks associated with trading on such markets and on such sites. Furthermore, one understands that the company carries zero influence over transactions, markets, and trading signals, therefore, cannot be held liable nor guarantee any profits or losses.

Green on Adobe. ADBEFlat finished. We are due for another fractal. Betting on further growth given relative and short term growth in the indices.
We are not in the business of getting every prediction right, no one ever does and that is not the aim of the game. The Fibonacci targets are highlighted in purple with invalidation in red. Confirmation level, where relevant, is a pink dotted, finite line. Fibonacci goals, it is prudent to suggest, are nothing more than mere fractally evident and therefore statistically likely levels that the market will go to. Having said that, the market will always do what it wants and always has a mind of its own. Therefore, none of this is financial advice, so do your own research and rely only on your own analysis. Trading is a true one man sport. Good luck out there and stay safe.

ADBE BUY + OversoldADBE is way oversold here on several indicators and looking to be getting close to long term support. Bounce back to $315-340 range in coming weeks to be expected.

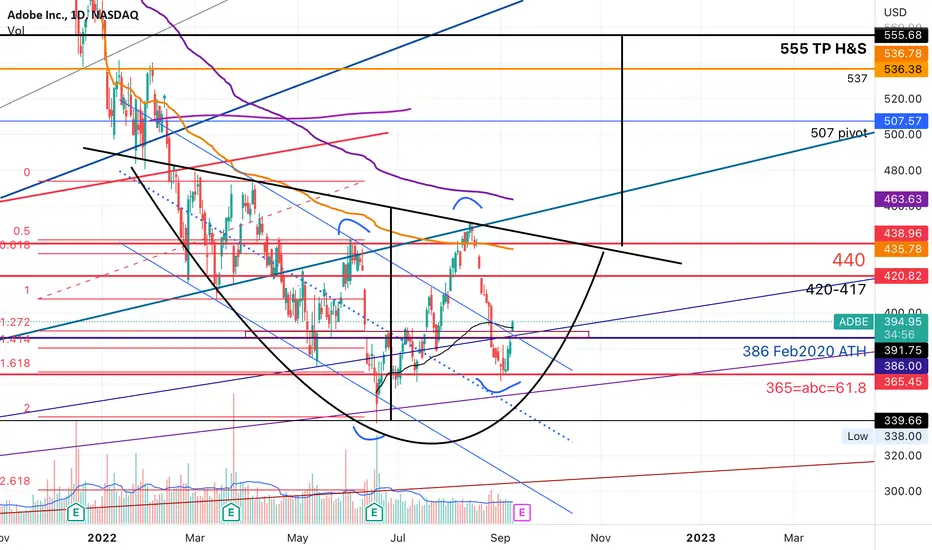
ADBE higher high higher low; Target of Inv H&S id 555ADBE just broke above some resistance lines as shown in the chart. Here I used GANN lines.
It broke above a small resistance zone & the downward channel. If the huge inverse H&S pattern plays out, there
Will be a huge upside with TP at 555.
A fundamental very good company with a lot of moat.
Not trading advice
ADBENot financial advice.
The essence of investing & trading is the intelligent and patient preying on the greed, fear, impatience, addiction and ignorance of the majority. It's definitionally Darwinian.

ADOBE INC - BULLISH SCENARIOA new bullish opportunity comes from Adobe Inc.
Higher lows and higher highs are forming an uptrend price channel with a reasonable risk-reward ratio.
1st resistance is 0.236 Fibo level located in the middle of the channel at $425.
2nd resistance is located at $ 460.
Risk Disclosure: Trading Foreign Exchange (Forex) and Contracts of Difference (CFD's) carries a high level of risk. By registering and signing up, any client affirms their understanding of their own personal accountability for all transactions performed within their account and recognizes the risks associated with trading on such markets and on such sites. Furthermore, one understands that the company carries zero influence over transactions, markets, and trading signals, therefore, cannot be held liable nor guarantee any profits or losses.

ADBE ADD TO WATCHLIST!🔸️Ticker Symbol: ADBE🔸️Timeframe: 4 Hour🔸️Investment Strategy: Long
TECHNICAL ANALYSIS: ADBE on the 4H timeframe is setting up nice to see an increase in value if we can stay in this current trend. Our white line representing money momentum on the bottom dashboard indicator is shifting to the upside and we also have a green middle band illuminated meaning bull market momentum. The final confirmation that I want to be looking out for is a green dot meaning a key ema crossover to the upside which would just give me added confirmation that taking a long position on ADBE could result in some nice gains. Thanks for following!
🔔 Follow for daily stock, crypto and forex technical analysis.
⚠️ Trading is risky and I understand nothing is guaranteed. Proper risk management should be in place at all times to minimize losses. Please consult a financial advisor before trading. All Inclusive Trading LLC is not a financial advisor and may not be held liable for any losses which may occur.

ADBE: TRENDSI ATS CONFIRMATION; ADBE IS TO REACH 415Ticker Symbol: $ADBE
️Timeframe: 4H
️REJECTION OF 200SMA
️Investment Strategy: LONG
TECHNICAL ANALYSIS:
TRENDSI ATS MONEY MOVEMENT SHIFTING UP : BULLISH
LINEAR REGRESSION + TRENDSI: AT THE BOTTOM, WHICH IS AT THE SUPPORT
REJECTION OF 200SMA ON 4HR AND REJECTION OF 50SMA ON DAILY TF
RSI OVERSOLD AND STOCHASTIC SHOWING BULLISH MOVEMENT.
CONFIRMATION I AM WAITING: TRENDSI ATS GREEN LINE WITH GREEN DOT
Follow for daily stock, crypto and forex technical analysis.
Trading is risky, and I understand nothing is guaranteed. Proper risk management should be in place at all times to minimize losses. Please consult a financial advisor before trading. All Inclusive Trading LLC is not a financial advisor and may not be held liable for any losses which may occur.

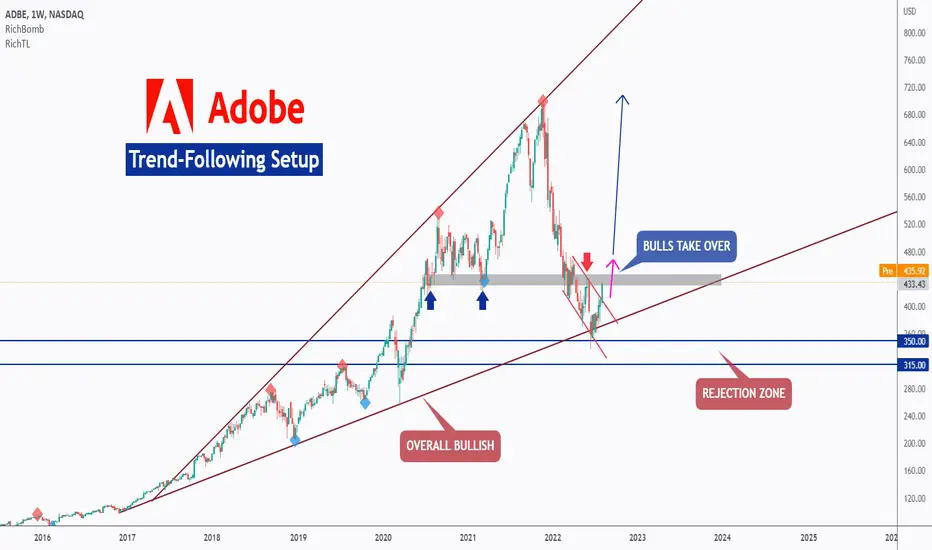
Adobe - Trend-Following Setup!Hello TradingView Family / Fellow Traders. This is Richard, as known as theSignalyst.
ADBE is overall bullish trading inside our brown rising broadening wedge and it is currently sitting around the lower bound so we will be looking for trend-following buy setups.
For the bulls to take over, we need a break above the gray minor support/resistance zone.
Meanwhile, ADBE can still trade lower and dive inside the blue rejection zone.
Always follow your trading plan regarding entry, risk management, and trade management.
Good luck!
All Strategies Are Good; If Managed Properly!
~Rich
Adobe Inc. support bounceADBE rejected 88.6% Fibonacci support after the price broke above the resistance trendline. This might be a good entry point for buyers.

GOOGL TTD DDOG DKNG CRM MDB ADBE all worked from yesterdays planExcellent day. Made 100%+ on almost all the trades from yesterdays plan.
Market is getting frothy here. Took my profits into strength and just have runners now.
