ADI rally slowing already?My overall thesis is we are in the very early stages of a multi-year decline ultimately with the S&P 500 below 3500. I have been wrong many times before so I will just take this thing in stages and see if it plays out. After this massive decline, we should be in for a great market rally of many decades. I am expecting the market to end its recent rally this week. The current rarely would be about a week in length depending when it began for individual stocks. The rally has done a few important things with its slow and prolonged upward movement, mainly prevents a wave 3 signal from occurring during the next decline.
My wave 3 indicator tends to signal wave 3s and 3 of 3s. See my scripts for the specifics of the indicator. If the market had a short wave 4 up and then a sharp or prolonged drop during wave 5, a new wave 3 signal would occur which violates the currently placed Minor wave 3 (yellow 3). Allowing separation from the current wave 3 signal enables wave 5 to drop quick or slow.
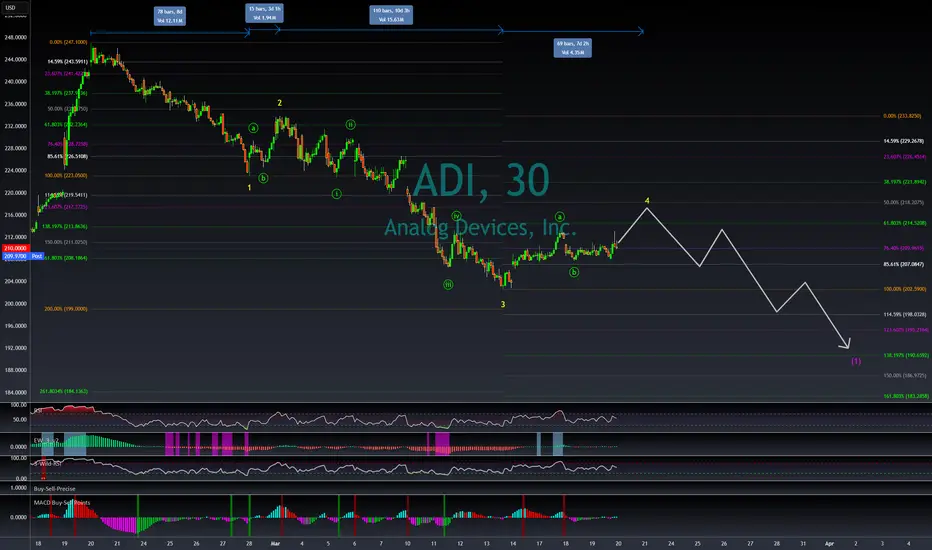
This chart applies select movement extensions based on wave 1's movement on the left and then another based on wave 3's movement on the right. I keep the values between 0%-100% on the chart for wave 2s and 4s retracements of the preceding wave's movement for reference even though the retracement values would be inverted.
Specifically for ADI, Minor wave 3 was longer than wave 1, which does not place a maximum length on wave 5. Assuming wave 4 ends on Thursday or Friday, Minor wave 5 could be a week or longer. Wave 4 does not need to gain too much more to meet completion criteria, but the sideways movement of the past few days could place the top below 218. During Minor wave 5, at the very least it should drop below wave 3's bottom of 202.59. Using some basic movement extensions, it will likely go lower. The 5 wave lower pattern for this fifth wave is hypothetical, but a bottom could occur between 186-195. Once we bottom, we should see another rally over a few weeks. I will forecast what that could look like as Intermediate wave 1 nears its end.
ADI
Share Price of Analog Devices (ADI) Soars by Approximately 10%Share Price of Analog Devices (ADI) Soars by Approximately 10% in a Day
The S&P 500 Index (US SPX 500 mini on FXOpen) set a new record yesterday, following the release of minutes from the latest Federal Reserve monetary policy meeting. As it became known, committee members would like to see inflation decline further; however, in their view, potential changes in trade and immigration policies could "complicate" the disinflation process.
Analog Devices (ADI) Shares Among Top Gainers
Amid predominantly bullish sentiment in the current US stock market, Analog Devices (ADI) shares surged by approximately 10% in a single day following the release of quarterly results. The company exceeded analysts' expectations on earnings per share by 5.5%, while gross revenue came in 2.68% above forecasts.
According to MarketWatch:
→ Analog Devices has increased its dividend by 8% and expanded its share buyback programme by $10 billion.
→ CEO Vincent Roche stated that "we have moved past the cyclical downturn, and the situation has turned in our favour," giving an optimistic outlook for the second half of 2025.
Technical Analysis of Analog Devices (ADI) Shares
The ADI stock chart shows that the price is forming a long-term upward trend (illustrated by the blue channel), with the following key observations:
→ The ongoing rise suggests a major breakout of the Bull Flag pattern, indicating a resumption of long-term growth following a correction.
→ The psychological level of $200 has shifted from resistance to support—a similar development could occur at the $240 level, where the current all-time high is located.
Analog Devices (ADI) Share Price Forecast
Analysts are mostly optimistic. According to Yahoo Finance:
→ 18 out of 29 surveyed analysts recommend buying ADI shares.
→ The average 12-month price target for ADI shares stands at $257.
Trade on TradingView with FXOpen. Consider opening an account and access over 700 markets with tight spreads from 0.0 pips and low commissions from $1.50 per lot.
This article represents the opinion of the Companies operating under the FXOpen brand only. It is not to be construed as an offer, solicitation, or recommendation with respect to products and services provided by the Companies operating under the FXOpen brand, nor is it to be considered financial advice.

ADI234 Trendline breakout possible
237/240/244 initial target ,
if sustain above 244 then 260 can test

Analog Devices Surges 10% as it Beat Profit and Sales EstimatesAnalog Devices ( NASDAQ:ADI ), a semiconductor manufacturer, has reported better-than-expected results and guidance as inventory backlogs eased. The company's fiscal second-quarter adjusted earnings per share (EPS) of $1.40 beat estimates, while revenue slumped 34% year-over-year to $2.16 billion, but that was above forecasts. CEO Vincent Roche explained that revenue exceeded the midpoint of its outlook despite continued macro and inventory headwinds. However, he pointed out that inventory rationalization across the broad customer base is stabilizing, clearing a path for the company to return to sequential growth in the third quarter.
Analog Devices ( NASDAQ:ADI ) sees current-quarter adjusted EPS of $1.50, plus or minus $0.10, with revenue of $2.27 billion, plus or minus $100 million. Both midpoints were higher than anticipated.
Analog Devices ( NASDAQ:ADI ) forecasts robust quarterly revenue on chip market recovery, thanks to a rise in demand for its industrial chips after a prolonged slump. The upbeat forecast signals that clients are placing new orders amid signs of an easing economy. The company expects revenue of $2.27 billion, plus or minus $100 million, for the third quarter, compared with estimates of $2.16 billion, according to LSEG data.
Analog Devices ( NASDAQ:ADI ) also touted its artificial intelligence efforts and expects to drive "record revenues" for its chip testing segment in the near to mid-term due to strong demand for high-bandwidth memory chips. The company's results follow a strong forecast from chipmaker Texas Instruments, fanning optimism for a rise in analog chip demand.
Technical Outlook
Analog Devices ( NASDAQ:ADI ) stock is currently overbought with a Relative Strength Index (RSI) of 82. The stock is up 10.87% as of the time of writing and up 18% since the start of 2024.

ADI Analog Devices Options Ahead of EarningsAnalyzing the options chain and the chart patterns of ADI Analog Devices prior to the earnings report this week,
I would consider purchasing the 195usd strike price Calls with
an expiration date of 2024-3-15,
for a premium of approximately $3.50.
If these options prove to be profitable prior to the earnings release, I would sell at least half of them.

ADI: Possible Buy AreaQuite perfect entry for another long would be on the marked gap. Final target around 226 USD.

ADI: 1h TechnicalsCurrently trading in a clear downward channel, breakout above is expected if we hold longer term trend line.

SOX Update (daily chart)SOX has been diverging from SPY last couple of days, which is unusual. SOX had 50/200 EMA xover Friday. SOX is extended, could pull back to prior swing high at 2913 (-3.25%) where there is good support. Watch these tech stocks with earnings coming up next 10 days, all daily charts look bullish (except CSCO, which is debatable). All also have positive point & figure price targets (from Stockcharts.com). ADI (2/15), ADSK (2/13), AMAT(2/16), ANET (2/13), CDNS (2/13), CSCO(2/15), KEYS (2/21), NVDA(2/22).
RSI(9) has been trending up since 1/9. As long as daily RSI(9) stays above 50%, trend may continue.

The world no longer needs chips! LOLThis is in my opinion like buying oil stocks in the march 2020 crash. Semis to technology is like oil to transport. The world will not survive without either. So I place my long here today confidently regardless of the next few weeks or months. I will hold this until we re-reach our previous ATH which will be sooner than most anticipate. I expect by 2025 this will rereach those highs and achieve a much higher value by 2030. This is a serious chance to change your wealth status. Buy red sale green as always this is not financial advice. Do not be short-sided with this dip. Get in front of big money. Retail is gone from the markets, now all that is left is big money to choose their picks... high probability this bounces soon major.

ADI | SHORTNASDAQ:ADI
Possible Scenario: SHORT
Evidence: Price action, Head and shoulder pattern, Bearish Money-Flow
PUT options 01/21/2022, strike 162.5$
$This is my idea and could be wrong 100%

ADI: Breakout of the range.The range resistance level could be broken upwards with the minimum target level around 185.

Short ADI on an upwards wedgePuts on ADI
~SL above ATH (180.77)
~PT1 172.50 (could see strong support here)
~PT2 170
~PT3 168
RSI divergence on last 2 ATH, a rejection at the resistance line in an uptrend, gap to fill on down 168-170
We saw a double bottom from this last impulsive move. a pullback to the neckline at PT1 very likely.

Is Analog Device Next To Rise? This Algorithm Is Pointing...I have changed up how to best display projected movement. In the case of ADI, 3 of my algorithms signaled a BUY on March 26, 2021. Equities nearly always obey the signal and move up, but sometimes it may continue to move down first.
I have placed two red boxes and two green boxes on the chart. The larger red box depicts all of the historical movement, from a percentage standpoint, that this stock has moved on the Daily chart after a BUY signal occurred. Therefore, this box represents 100% of previous movement downward before the stock finally moved upward. The smaller red box represents 50% of all historical movement downward, before the stock moved upward. The smaller box is more of a precise target for the potential bottom in this instance.
The green boxes represent the same thing. In this instance, the smaller green box would be my projected target for the final top.
The black dotted arrow represents median historical movement. Medians are a good metric, but they are just one of many I use when forecasting future movement.
As always, the stock could rise the very next bar after the signal without looking back (therefore the red boxes would not come into play) or the stock may never rise (and the green boxes may never come into play).
All statistics and the full analysis are available for free as always at the site below.

UNI to 4.7 at least !!!Firs please follow me and Commend your idea bellow this post, It will be really helpful !!!
Now about UNI:
According to the chart UNIs [/b ] price one month ago was about 8 USDT and after that it started to become bearish till yesterday!!
right now if you guys look at the chart I drew you can see it's following a simple pitchfork canal now at the same time if we check ADI indicator we can see how powerful this
Process is.
So Here at least we are talking about UNI reach 4.7 USDT which is a Resistance line and if UNI be able to cut this line it will be to 7.2 .
TNX for lessening to me!!
be sure to follow and leave you idea about my idea so we all can get better in analysis!!
Have a nice trade...


Analog Devices $ADI$ADI is just above the buy point of $124.39
12 months Consensus Price Target: $123
if you find my charts useful, please leave me "like" or "comment".
Please don't trade according to the ideas, rely on your own knowledge.
Thx

Analog Devices, Inc. (ADI) short.All description on the chart.
Please, don't forget to like and follow.
Thank you.

ADI LONG Trend Analysis PredictionStock rises after drop down. Order should placed above previous low Analog Devices (NASDAQ:ADI) to earn +11.2% . The analysis based on Fibonacci Extension and RSI Algo trade line.

ADI - an eye catching balance sheet with an 28.5% Opr.Margin#ADI
Analog Devices had a recent move from 105 to 115 in the last two weeks. Further move towards 125 should/can be expected as the fundamentals in balance sheet looks brilliant.
Debt-to-Equity Ratio = 0.47
Operating Margin = 28.55%
DIV Expected = 2.15

ADI - Descending TriangleThe $103.90 price range has been a good support line for the stock since February. The price broke down in May before regaining the line with the June rally.
The descending triangle pattern has been in place since mid-July. Another breakdown of the support line would trigger the pattern with a price target of around $82.


ADI breakout to the downside!!higher time frame is showing defined downtrend and exhibiting trend strength- using moving averages as dynamic resistance/
support
-intermediate timeframe shows trend alignment to the downside and price pull back to short term moving average
-looking for it trade to pivot low of 78.58 and breakout to the downside on intermediate timeframe
-on the shorter time frame- it is also showing trend alignment and favors a higher probability favoring the trend to the downside
-price is also pulling back to the .236 retracement level of 78.98..would look to initiate position in that area to the ride back down and setting a tight stop over 79.0x area
-as price resumes downtrend on the intermediate timeframe- it should also translate to the lower time frame and breakdown past the pivot low of 78.58 and along with increased selling pressure towards the path of least resistance to 74.7x area (.618 extension level)
