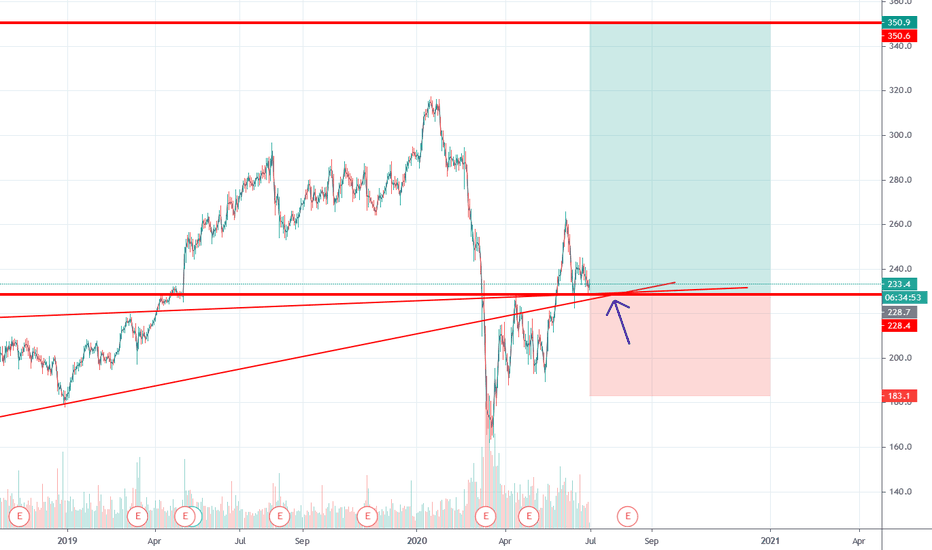
Adidas , Long view The curve for Adidas shares has been upwards since mid-May. At first, it seemed as if buyers were running out of Amo in the area of the € 220 mark, but in the past few days the share has regained momentum. In the meantime, investors have caused the price to rise to EUR 241.10. Until the pre-crisis level of 282.45 euros was reached, however, more than 17 percent is still missing.
At the moment, however, during the past one or two days, investors are primarily interested in positive topics. Because of this sentiment, the stock receives a “hold” rating today. In-depth and automatic analyzes of the communication have shown that lately "buy" signals have been the main focus. This gives Adidas a Buy Signal based on the investor sentiment barometer.
Good Luck .
Adidas
Long-term Investment #ADIDASSportswear manufacturer #ADIDAS dropped overall -47% after they had to close their local shops cause of Covid and got terrible expectations for Sales.
If we comparing the blue indicator (TEXTILES & APPARELS Index - TSE/TXA) in the chart we can see that we already reached the bottom of the crash (maybe). And the white indicator (Nike) give us a picture what stock growth we could expect.
I´m calculating with a fulfilling channel run, good risk/award ratio as a long-term investment.
Your Sincerely Christian S.
Adidas going upHi guys. As we can see the price is going up after touching the resistance line and the new target could possibly be 296.
If the stock beats this price (296) it will shoot up to 320 or more.
Besides it is quite above the moving average (60) so it indicates an upward trend.
Fibonacci retracements were also used showing that the price broke one of the lines.
Finally I can say that I have ambitious expectations about this stock.
ADIDAS WAITING FOR CALLSAdidas is one of the top 10 stocks in my shortlist. I don't know why but the chart is crazy bullish. And im expecting a parabolic move to the upside in 2020
I don't have any setups yet but waiting for the levels to watch for call options
I'll be sharing ideas in a couple of days/weeeks
ADDYY Approaching Support, Potential Bounce!ADDYY is approaching support at 105.90 (100% Fibonacci extension, 76.4% Fibonacci retracement, horizontal swing low support) where price could bounce up to its resistance at 116.60 (50% Fibonacci retracement, horizontal swing high resistance).
Stochastic (89, 5, 3) is approaching its support at 3.2%.
ADDY Approaching Support, Potential Bounce!Adidas ia approaching it support at 110.52 (61.8% Fibonacci extension, 76.4% Fibonacci retracement, horizontal swing low support) where it could potentially rise to its resistance at 118.61 (50% Fibonacci retracement, horizontal swing high resistance).
Stochastic (55, 5, 3) is approaching its support at 3.2% where a corresponding bounce could occur.
Adidas is looking for you...Focusing on the quality of its products, Adidas is in full fight with its main competitors especially with Nike.
Adidas begins to be more and more strong in important markets such as China and the USA, we all know the quality of their products and with a strong strategy in online sales is definitely a good prospect.
Charts and stock prices are obviously not the way to compare two companies like Nike and Adidas (information resulting from a fundamental analysis can help us compare oranges with oranges). But it will certainly be interesting to see how these charts develop.
Currently Adidas is at a area that has been difficult to leave behind. However it is no small thing, since 2015 has a performance that has kept its investors and specialists happy.
Best wishes to all!!!
ADIDAS in ascending triangleFrom the top in January 2014 (€ 93) and the bottom in October 2014 (€ 53) ADIDAS has been in a major uptrend which extended to the 2.618 fibonacci projection level (€ 160). The rising support line forms an ascending triangle together with the flat resistance line at the top. A breakout from the ascending triangle should lead to a major move in either direction. A downward breakout leads to a minimum price target of € 118 (the 1.618 fibonacci level).
ADSD @ daily @ closed higher while last 4 trading daysThis is only a trading capability - no recommendation !!!
Buying/Selling or even only watching is always your own responsibility ...
.zip (with PDF`s) @ my Google Drive
Break Ups (Dax Index incl. all shares)
drive.google.com
Best regards :)
Aaron
ADSD @ Daily @ with +69% in 2016 best DAX Performer & in a trendTake care
& analyzed it again
- it`s always your decision ...
(for a bigger picture zoom the chart)
This is only a trading capability - no recommendation !!!
Buying/Selling or even only watching is always your own responsibility ...
DAX 30 Index & all Shares (2016 yearly Performance) @ drive.google.com
Best regards
Aaron


