Advanced Micro Devices (AMD) Stock AnalysisAdvanced Micro Devices (AMD) Stock Analysis
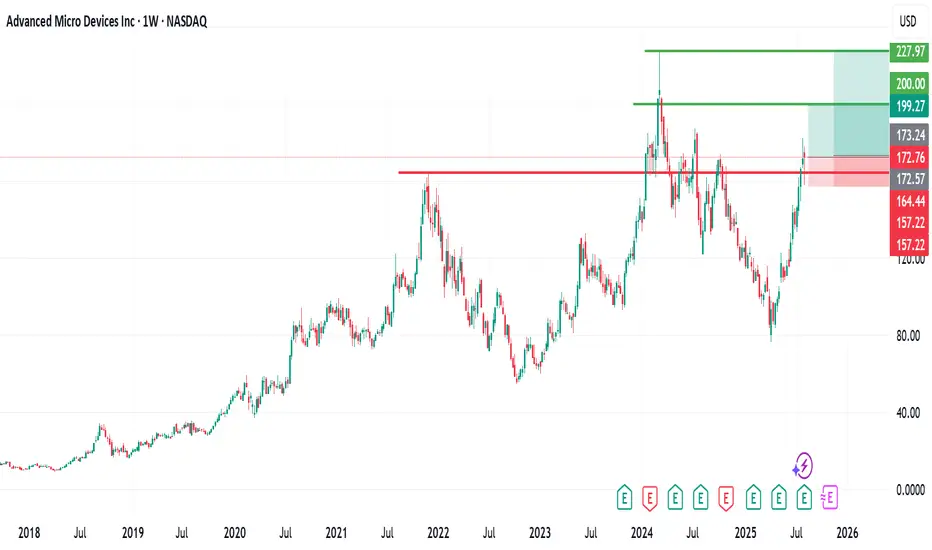
AMD, listed on NASDAQ, has generally been on an upward trend. However, last week, the stock experienced a brief flash downturn, dropping to around the $157 level.
Since then, it has recovered and is currently trading at approximately $172 per share.
Outlook:
I remain bullish on AMD and anticipate a potential move toward the $200 level, with a longer-term target around its all-time high near $226.
For my entry strategy, I have added positions at different levels, with an initial entry around $160 and another at the current level.
This gives me a total of three buy entries, positioning for a mid- to long-term hold.
Let’s see how it unfolds! If you have any insights or thoughts, please share them in the comments. I’d love to connect with you. Don’t forget to follow, share, and subscribe. Thank you.
Advancedmicrodevices
AMD Shares Decline Despite Strong Earnings ReportAMD Shares Decline Despite Strong Earnings Report
Yesterday, following the close of the stock market, Advanced Micro Devices released a strong quarterly earnings report:
→ Earnings per share came in at $0.48 (roughly in line with forecasts);
→ Revenue reached $7.68 billion (versus expectations of $7.41 billion).
At the same time, CEO Lisa Su stated: “We’re well positioned to deliver significant growth in the second half.”
However, despite the solid performance and optimistic outlook, AMD shares declined in after-hours trading, falling below $165.
The decline in AMD’s share price following a strong report may be attributed to excessively high expectations and the stock's overbought condition ahead of the announcement.
Technical Analysis of the AMD Stock Chart
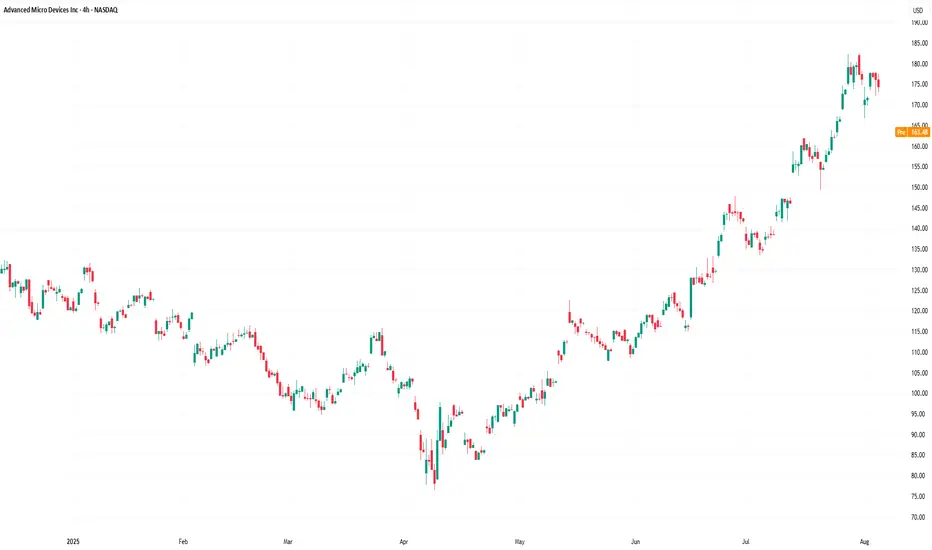
Since April 2025, price fluctuations have formed an ascending channel (highlighted in blue). In July:
→ the price broke above the upper boundary of this channel, moving sharply higher (marked in purple);
→ the RSI indicator remained above the 50 level throughout.
We can assume that investors were following the meteoric rise of Nvidia (NVDA) shares and were betting that the ongoing AI boom would enable AMD to deliver extraordinary results. However, these hopes were not fully realised — the classic case of "buy the rumour, sell the fact".
As a result, AMD shares may open today with a bearish gap. From a technical standpoint, this suggests that the price is returning to the limits of the blue ascending channel, where the midline and lower boundary may act as support levels. The psychological support level at $150 also appears significant.
This move may be interpreted as a correction — and once the excessive optimism accumulated in July dissipates, bulls may attempt to resume the upward trend, supported by fundamentally strong data.
This article represents the opinion of the Companies operating under the FXOpen brand only. It is not to be construed as an offer, solicitation, or recommendation with respect to products and services provided by the Companies operating under the FXOpen brand, nor is it to be considered financial advice.
Amd - New all time highs will follow!🪠Amd ( NASDAQ:AMD ) rallies even much further:
🔎Analysis summary:
After Amd perfectly retested a major confluence of support a couple of months ago, we saw a textbook reversal. This retest was followed by a rally of more than +100% in a short period of time. But considering all the bullish momentum, Amd is far from creating a top formation.
📝Levels to watch:
$200
SwingTraderPhil
SwingTrading.Simplified. | Investing.Simplified. | #LONGTERMVISION

AMD Advanced Micro Devices Options Ahead of EarningsIf you haven`t bought AMD before the previous earnings:
Now analyzing the options chain and the chart patterns of AMD Advanced Micro Devices prior to the earnings report this week,
I would consider purchasing the 220usd strike price Calls with
an expiration date of 2026-9-18,
for a premium of approximately $22.15.
If these options prove to be profitable prior to the earnings release, I would sell at least half of them.
Disclosure: I am part of Trade Nation's Influencer program and receive a monthly fee for using their TradingView charts in my analysis.
AMD Stable Channel Up targets $168.Advanced Micro Devices (AMD) has been trading within a Channel Up since the April 08 market bottom. With the 4H MA50 (blue trend-line) as its Support since April 30, the pattern has shown incredible consistency, with the past two pull-backs almost touching the 0.382 Fibonacci retracement level.
As a result, given also the fact that the 4H RSI is supported by the Higher Lows trend-line, we view the current bounce as a solid buy opportunity for the short-term. We are targeting $168, which is the -0.5 Fibonacci extension, the level that the previous Higher High reached.
-------------------------------------------------------------------------------
** Please LIKE 👍, FOLLOW ✅, SHARE 🙌 and COMMENT ✍ if you enjoy this idea! Also share your ideas and charts in the comments section below! This is best way to keep it relevant, support us, keep the content here free and allow the idea to reach as many people as possible. **
-------------------------------------------------------------------------------
💸💸💸💸💸💸
👇 👇 👇 👇 👇 👇

Amd - This is just the beginning!Amd - NASDAQ:AMD - perfectly plays out:
(click chart above to see the in depth analysis👆🏻)
Despite the harsh drop of about -65% which we have been witnessing starting back in 2024, Amd remains bullish. Just three months ago, Amd retested a textbook confluence of support. We saw bullish confirmation, the bottom is in and Amd will rally significantly from here.
Levels to watch: $200, $300
Keep your long term vision!
Philip (BasicTrading)

AMD Major Lower Highs/ 1W MA50 break-out.It was only 9 days ago (June 16, see chart below) when we called for a potential bullish break-out on Advanced Micro Devices (AMD) above the 1W MA50 (blue trend-line):
The break-out did happen, this 1W candle is already considerably above its 1W MA50 and based also on the level the 1W RSI is at right now, it may resemble more the March 13 2023 1W candle instead of the January 30 2023 as previously thought.
The reason is the major break-out of the All Time High (ATH) Lower Highs trend-line that came along with the 1W MA50. As you can see, it was on the March 13 2023 1W candle that AMD broke above that trend-line with the 1W RSI being on the same level (66.00) as today.
This candle formed a short-term Top, with the price initiating a 1.5 month pull-back that re-tested the 1W MA50 as Support and then moved on to complete the +143.12% Bullish Leg from the Channel Up bottom.
As a result, we can't rule out the first wave of short-term profit taking by next week. But a potential 1W MA50 test, will be another long-term buy entry in our view. Our $185.00 Target remains intact.
-------------------------------------------------------------------------------
** Please LIKE 👍, FOLLOW ✅, SHARE 🙌 and COMMENT ✍ if you enjoy this idea! Also share your ideas and charts in the comments section below! This is best way to keep it relevant, support us, keep the content here free and allow the idea to reach as many people as possible. **
-------------------------------------------------------------------------------
💸💸💸💸💸💸
👇 👇 👇 👇 👇 👇

Bullish Thesis: Why AMD Stock Could Soar by Year-End 2025If you haven`t bought AMD before the previous rally:
What to consider now:
1. AI Tailwinds Are Accelerating
AMD is finally gaining serious traction in the AI GPU race. Its MI300X accelerator chips are being adopted by big names like Microsoft, Meta, and Oracle for data center AI workloads. While NVIDIA is still dominant, AMD is expected to grab 10–20% of the AI GPU market share by 2025, according to industry estimates. That’s a multibillion-dollar opportunity.
The MI300X already passed $1B in revenue within its first quarters.
AI server TAM (total addressable market) is expected to grow to $400B by 2027 — AMD is positioning itself aggressively to carve out its slice.
2. Valuation Looks Reasonable vs Peers
AMD trades at a forward P/E around 40, significantly below Nvidia (which trades over 60x) despite similar growth projections for the next 2 years.
Revenue expected to grow over 15–20% YoY in 2025.
Gross margins expanding as high-performance chips dominate the mix.
3. Diversified Growth: Beyond AI
Gaming segment (PlayStation 5 and Xbox Series X chips) remains strong.
Embedded segment from Xilinx acquisition continues to generate solid cash flow.
Client CPU business is rebounding as the PC market stabilizes.
4. Strong Management and Execution
CEO Lisa Su is widely respected for turning AMD around and guiding the company through major innovations and acquisitions (Xilinx, Pensando). Execution has remained consistent, especially in delivering cutting-edge performance-per-watt chips.
Disclosure: I am part of Trade Nation's Influencer program and receive a monthly fee for using their TradingView charts in my analysis.

AMD First touch of 1W MA50 after 8 months!Advanced Micro Devices (AMD) hit today its 1W MA50 (blue trend-line) for the first time in almost 8 months (since October 28 2024). This is a crucial test as the las time this level broke as a Resistance following a Channel Up bottom rebound was on the week of January 30 2023.
When that happened, the Bullish Leg extended the upside to complete a +143.12% rise, before the next 1W MA50 pull-back.
As a result, if we close the week above the 1W MA50, we expect to see $185 before the end of the year.
-------------------------------------------------------------------------------
** Please LIKE 👍, FOLLOW ✅, SHARE 🙌 and COMMENT ✍ if you enjoy this idea! Also share your ideas and charts in the comments section below! This is best way to keep it relevant, support us, keep the content here free and allow the idea to reach as many people as possible. **
-------------------------------------------------------------------------------
💸💸💸💸💸💸
👇 👇 👇 👇 👇 👇

Amd - This starts the next +200% rally!Amd - NASDAQ:AMD - is preparing a major rally:
(click chart above to see the in depth analysis👆🏻)
It has - once again - not been unexpected at all that we now see a major reversal rally on Amd. After the harsh drop of about -65%, Amd retested a significant confluence of support and already created bullish confirmation. It is quite likely that this now starts the next bullrun.
Levels to watch: $100, $300
Keep your long term vision!
Philip (BasicTrading)

AMD: Short-term Upward PotentialAMD has continued to face downward pressure, preventing further progress in green wave . While this wave still has room to rise, its top should form below resistance at $141.16. Once wave completes, wave should follow—finishing the larger green impulse to the downside and completing the corrective structure of blue wave (II). This move is expected to conclude in our blue Long Target Zone between $62.82 and $35.19. That said, we continue to monitor a 30% alternative scenario: it suggests that wave alt.(II) has already bottomed at $76.12. In that case, AMD wouldn’t visit the blue zone but instead break out directly above the resistances at $141.16 and $174.98—marking the beginning of wave alt.(III).
📈 Over 190 precise analyses, clear entry points, and defined Target Zones - that's what we do.

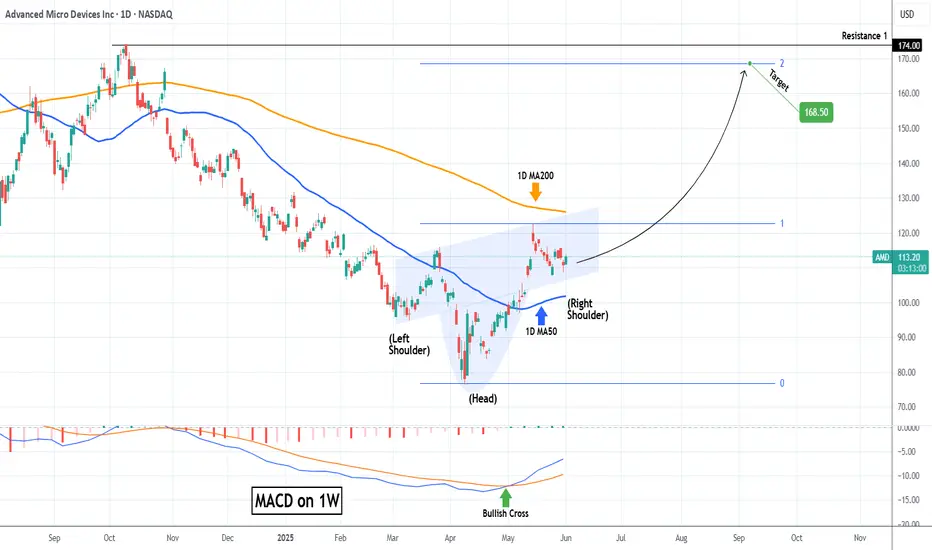
AMD Inverse Head and Shoulders waiting for massive break-out.Advanced Micro Devices (AMD) has entered a wide consolidation range within the 1D MA50 (blue trend-line) and 1D MA200 (orange trend-line) following the May 14 High. From a wider scale, this is technically seen as the Right Shoulder of an Inverse Head and Shoulders (IH&S) pattern.
This is generally a bullish reversal pattern and it is no coincidence that the Head was formed exactly on the market bottom (April 08). With the first long-term buy signal already given by the 1W MACD Bullish Cross, as long as the 1D MA50 holds, a break above the 1D MA200 would confirm the next rally phase.
Technically when the Right Shoulder break-outs take place, they target the pattern's 2.0 Fibonacci extension. That's now exactly at $168.50 and this is our medium-term Target.
-------------------------------------------------------------------------------
** Please LIKE 👍, FOLLOW ✅, SHARE 🙌 and COMMENT ✍ if you enjoy this idea! Also share your ideas and charts in the comments section below! This is best way to keep it relevant, support us, keep the content here free and allow the idea to reach as many people as possible. **
-------------------------------------------------------------------------------
💸💸💸💸💸💸
👇 👇 👇 👇 👇 👇
$AMD When, not IF! 105% UPSIDENASDAQ:AMD - It's not a matter of if, but when...🚀
Once this downtrend on the weekly is broken out of with a big fat engulfing candle we will launch off this volume shelf like a SpaceX rocket to mars!
All indictors are curling up and I think the time is coming for AMD to make their ascent higher and back to ATHs!

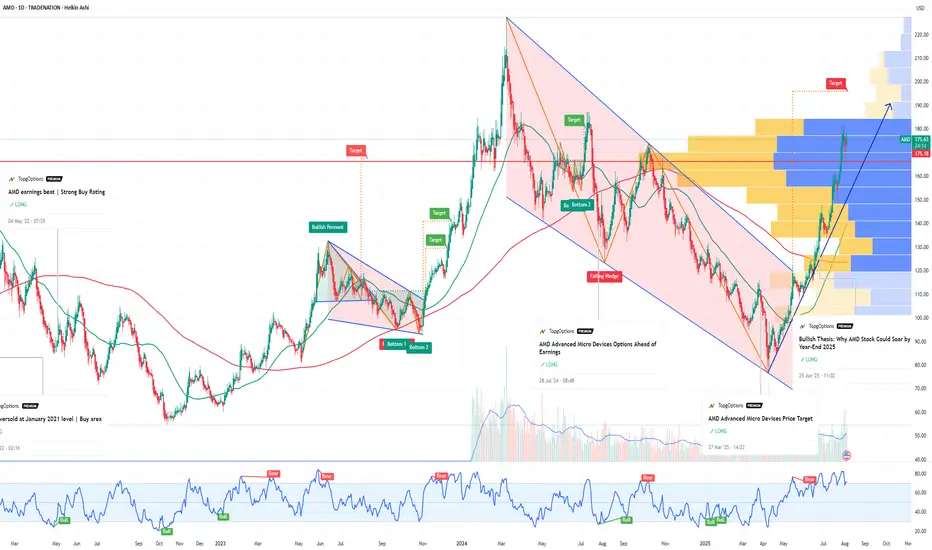
AMD Break-out above this level means new ATH at $300.Advanced Micro Devices (AMD) is on a recovery attempt following the April 07 2025 bottom, which is technically a Higher Low on the 3.5-year Channel Up. This week it broke above the first Resistance level of this attempt, the 1W MA200 (orange trend-line), which is key as it had 2 rejections since February 18 2025.
However the biggest Resistance test is right above it and consists of a strong Cluster of the 1D MA200 (green trend-line), the 1W MA50 (blue trend-line) and the Lower Highs trend-line from the All Time High (ATH).
The previous Bullish Leg of the Channel Up (started on October 10 2022), consolidated for 1 month once it broke above this Resistance Cluster (blue circle) and then marched towards the pattern's Higher High, which was naturally a Higher High.
The similarities between the Legs are striking, the Bearish Legs (both declined by -66.86%) were confirmed by 1W MACD Bearish Cross and the Bullish Legs by a Bullish Cross, which the 1W MACD just completed last week.
This is a major confirmation and technically the earliest for a long-term Buy. Assuming again that the symmetry will continue to hold on this emerging Bullish Leg, we can expect it rise by +318.17% as well. Based on that, our long-term Target on AMD is $300.
-------------------------------------------------------------------------------
** Please LIKE 👍, FOLLOW ✅, SHARE 🙌 and COMMENT ✍ if you enjoy this idea! Also share your ideas and charts in the comments section below! This is best way to keep it relevant, support us, keep the content here free and allow the idea to reach as many people as possible. **
-------------------------------------------------------------------------------
💸💸💸💸💸💸
👇 👇 👇 👇 👇 👇

Chipmaker Stocks DeclinesChipmaker Stocks Declines
According to the charts, semiconductor stocks underperformed the broader equity market yesterday. While the S&P 500 index (US SPX 500 mini on FXOpen) fell by around 2.2%, the drop was far steeper across the chip sector:
→ The bullish semiconductor ETF (SOXL) declined by 15%;
→ Nvidia (NVDA) shares fell by 6.9%;
→ Advanced Micro Devices (AMD) dropped by 7.3%.
In other words, chipmaker stocks dragged down the broader market, raising concerns ahead of the upcoming earnings season.
Why Are Chip Stocks Falling?
The decline stems from corporate assessments of how the escalating global trade war and new tariffs could impact future performance.
According to media reports:
→ AMD expects to face tariffs of up to $800 million on exports to China;
→ For Nvidia, similar levies could exceed $5 billion.
Technical Analysis – Nvidia (NVDA)
The price continues to fluctuate within a downward channel, previously identified in our analysis:
The lower boundary of the channel is acting as support, helping the price close near its opening level yesterday (forming a Doji candle on the daily chart).
Technical Analysis – AMD
A similar picture is emerging on the AMD chart:
The $96 level now appears to be a key resistance zone.
In Summary
All eyes are on today’s earnings report from chipmaker TSMC (TSM), which could significantly influence the currently bearish sentiment in the sector.
This article represents the opinion of the Companies operating under the FXOpen brand only. It is not to be construed as an offer, solicitation, or recommendation with respect to products and services provided by the Companies operating under the FXOpen brand, nor is it to be considered financial advice.

AMD: Best level to buy since Oct 2022.Advanced Micro Devices are virtually oversold on the 1W technical outlook (RSI = 30.639, MACD = -13.430, ADX = 36.312) having hit the bottom (HL) of the 3 year Channel Up. The 1W RSI is slightly even lower it was on the previous bottom of October 10th 2022. This should be the start of the new long term bullish wave, which based on the previous one should make a HH on the 1.236 Fibonacci extension, approximately a +300% rally (TP = 280.00).
See how our prior idea has worked out:
## If you like our free content follow our profile to get more daily ideas. ##
## Comments and likes are greatly appreciated. ##

Amd - The One And Only Setup For 2025!Amd ( NASDAQ:AMD ) shifts to a very bullish market:
Click chart above to see the detailed analysis👆🏻
Perfectly following previous cycles, Amd corrected about -60% over the past couple of months. However now we are seeing some first bullish signs at a major confluence of support. If we actually also witness bullish confirmation, an incredible rally of about +200% could follow.
Levels to watch: $100, $300
Keep your long term vision,
Philip (BasicTrading)

AMD Advanced Micro Devices Price TargetAdvanced Micro Devices (AMD) has positioned itself as a major player in the semiconductor industry, capitalizing on growing demand for high-performance computing, artificial intelligence (AI), and data center solutions. As of now, AMD’s forward price-to-earnings (P/E) ratio stands at 17.12, indicating that the stock is trading at a reasonable valuation compared to its growth potential.
AMD has benefited from the increasing adoption of AI-driven solutions, particularly through its MI300 series of AI accelerators, which have gained traction among major cloud service providers. The company’s expansion into the data center market has also been a key growth driver, with strong sales in EPYC processors contributing to revenue growth.
Furthermore, AMD's strategic acquisition of Xilinx has strengthened its position in the FPGA (Field-Programmable Gate Array) market, enhancing its ability to offer diversified and high-margin products. This, combined with improving margins and consistent product innovation, positions AMD for steady financial performance in the coming quarters.
Given AMD’s solid fundamentals, growing market share in AI and data centers, and attractive valuation at a 17.12 forward P/E, a price target of $125 by the end of the year appears achievable. This would represent approximately 15% upside from current levels, driven by continued revenue growth and expanding profit margins.

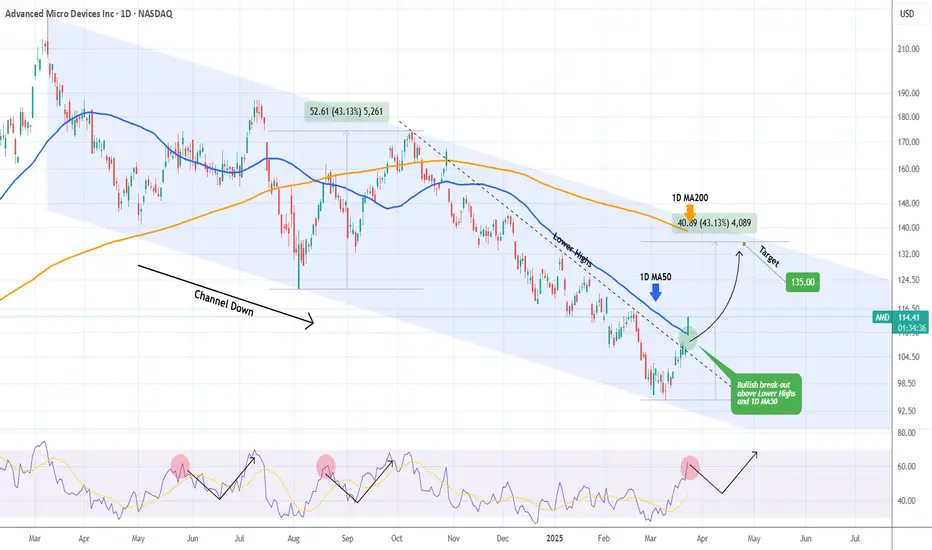
AMD broke above its 1D MA50. Is the trend finally changing?Advanced Micro Devices (AMD) broke today above its 1D MA50 (blue trend-line) for the first time in almost 5 months (since October 29 2024)! From that day after it has also been below a Lower Highs trend-line, basically the Bearish Leg of the 1-year Channel Down, which it marginally broke last week but today it smashed it.
A short-term pull-back based on the 1D RSI symmetry (with the August 20 2024 and May 28 2024 Highs) is possible but on the long-term we expect a full recovery on this Bullish Leg of at least +43.13% (like the August - September Leg).
As a result, we expect a 1D MA200 (orange trend-line) test at $135.00.
-------------------------------------------------------------------------------
** Please LIKE 👍, FOLLOW ✅, SHARE 🙌 and COMMENT ✍ if you enjoy this idea! Also share your ideas and charts in the comments section below! This is best way to keep it relevant, support us, keep the content here free and allow the idea to reach as many people as possible. **
-------------------------------------------------------------------------------
💸💸💸💸💸💸
👇 👇 👇 👇 👇 👇
AMD 1st breakout made. Now waiting for the 1day MA50.AMD is trading inside a Channel Down since November 1st 2024 and under a second layer of lower highs since December 4th 2024.
Along with the 1day RSI that just crossed above its own Resistance level, the price crossed above that second layer of lower highs.
This is the first sign of an upcoming bullish breakout but the last Resistance to confirm that is the 1day MA50.
If that breaks, go long and target 144.00.
Follow us, like the idea and leave a comment below!!

AMD - Advanced Money Destroyer...Not For Long!NASDAQ:AMD
Has been decimated but the DIP BUY BOX holds strong! $85-$100 could lead to an easy 2x!
- Key S/R Zone
- Massive Volume Shelf
- Bearish WCB Breakout will give Bullish Cue
- Lowest RSI since 2022 BOTTOM
A turnaround here could lead to outsized performance in portfolios.
Not financial advice

Amd - Please Look At The Structure!Amd ( NASDAQ:AMD ) is about to retest massive support:
Click chart above to see the detailed analysis👆🏻
For about 5 years Amd has been trading in a decent rising channel formation. That's exactly the reason for why we saw the harsh drop starting in the beginning of 2024. But as we are speaking, Amd is about to retest a massive confluence of support which could lead to a beautiful reversal.
Levels to watch: $100
Keep your long term vision,
Philip (BasicTrading)

AMD: Bottomed and can rally by as much as +140%.AMD is bearish on its 1D technical outlook (RSI = 40.266, MACD = -4.630, ADX = 52.178) but technically appears to be forming a new multi-month bottom after exactly 1 year of downside. The 1D RSI hit the S1 level, which priced the October 10th 2022 bottom. The outcome of that bottom was a +142.42% rally, same as the October 23rd 2023 Low, whose +142.42% rally formed the March 2024 ATH. This time this week's low has come very close to the S1 level, which is the strongest support level on the long term. A new potential +142.42% rally from the current levels would make a marginal ATH (TP = 230) and that's our current target for the end of the year.
## If you like our free content follow our profile to get more daily ideas. ##
## Comments and likes are greatly appreciated. ##
