AMD Expressing Tech Weakness?As anyone with any tech knowledge knows, chips arent going anywhere. They are the future and they are here to stay.
But at the moment AMD is showing us something very interesting, which is it is starting to break 4-year long market structure. As you can see price has respected this channel 6 times as I've marked on the chart.
5 out of 6 of those touches brought strong volume and strong price action.
On this last touch, there was a nice bounce initially with good volume but the price quickly reversed and has since been moving further from the trendline under the 200MA.
The FED policy is going to be the biggest factor going forward. How they plan to combat inflation and how much they actually want to follow through with what they say.
Right now tech is in a situation where it must start gaining momentum soon or trouble could already be at our doorstep.
Only time will tell!
Advancedmicrodevices

AMD analysis 01/04/2022Weekly chart Analysis
Potential H&S pattern in the making
Support confluence on 100EMA, Horizontal support zone, Diagonal support line, Ichimoku Cloud supports all lineup well.
The concern I have is a fundamental one, when looking at tech stocks, they may be dropping further if we keep printing higher yields (US10Y & US30Y) (since they are negatively correlated).
Also, the NQ reached 0.618 level ( retracement from the last high )

AMD Break Inbound? Advanced Micro Devices - Short Term - We look to Sell at 99.06 (stop at 103.51)
The medium term bias remains bearish. We look for losses to be extended today. This move is expected to continue and we look to set shorts at good risk/reward levels. Short term oscillators have turned negative. Previous support located at 100.00.
Our profit targets will be 84.22 and 79.31
Resistance: 120.00 / 145.00 / 155.00
Support: 100.00 / 84.00 / 72.00
Disclaimer – Saxo Bank Group. Please be reminded – you alone are responsible for your trading – both gains and losses. There is a very high degree of risk involved in trading. The technical analysis, like any and all indicators, strategies, columns, articles and other features accessible on/though this site (including those from Signal Centre) are for informational purposes only and should not be construed as investment advice by you. Such technical analysis are believed to be obtained from sources believed to be reliable, but not warrant their respective completeness or accuracy, or warrant any results from the use of the information. Your use of the technical analysis, as would also your use of any and all mentioned indicators, strategies, columns, articles and all other features, is entirely at your own risk and it is your sole responsibility to evaluate the accuracy, completeness and usefulness (including suitability) of the information. You should assess the risk of any trade with your financial adviser and make your own independent decision(s) regarding any tradable products which may be the subject matter of the technical analysis or any of the said indicators, strategies, columns, articles and all other features.
Please also be reminded that if despite the above, any of the said technical analysis (or any of the said indicators, strategies, columns, articles and other features accessible on/through this site) is found to be advisory or a recommendation; and not merely informational in nature, the same is in any event provided with the intention of being for general circulation and availability only. As such it is not intended to and does not form part of any offer or recommendation directed at you specifically, or have any regard to the investment objectives, financial situation or needs of yourself or any other specific person. Before committing to a trade or investment therefore, please seek advice from a financial or other professional adviser regarding the suitability of the product for you and (where available) read the relevant product offer/description documents, including the risk disclosures. If you do not wish to seek such financial advice, please still exercise your mind and consider carefully whether the product is suitable for you because you alone remain responsible for your trading – both gains and losses.

AMD is Looking Heavy with Significant Downside PotentialAMD reached an all time high of 164$ on Nov 30, 2020. Since then it has been retracing lower with price currently at 100$ psych level. The stock looks heavy. I expect the price to continue to chop its way lower toward the 72.5$ price point as a target. Analysis is void if price rises above 132.5$.

AMD Aimed LowerAdvanced Micro Devices - Short Term - We look to Sell at 120.45 (stop at 126.99)
Preferred trade is to sell into rallies. Prices expected to stall near trend line resistance. 50 1day EMA is at 121.00. Short term oscillators have turned negative. Previous support located at 100.00.
Our profit targets will be 101.28 and 85.50
Resistance: 120.00 / 145.00 / 155.00
Support: 100.00 / 85.00 / 72.00
Disclaimer – Saxo Bank Group. Please be reminded – you alone are responsible for your trading – both gains and losses. There is a very high degree of risk involved in trading. The technical analysis, like any and all indicators, strategies, columns, articles and other features accessible on/though this site (including those from Signal Centre) are for informational purposes only and should not be construed as investment advice by you. Such technical analysis are believed to be obtained from sources believed to be reliable, but not warrant their respective completeness or accuracy, or warrant any results from the use of the information. Your use of the technical analysis, as would also your use of any and all mentioned indicators, strategies, columns, articles and all other features, is entirely at your own risk and it is your sole responsibility to evaluate the accuracy, completeness and usefulness (including suitability) of the information. You should assess the risk of any trade with your financial adviser and make your own independent decision(s) regarding any tradable products which may be the subject matter of the technical analysis or any of the said indicators, strategies, columns, articles and all other features.
Please also be reminded that if despite the above, any of the said technical analysis (or any of the said indicators, strategies, columns, articles and other features accessible on/through this site) is found to be advisory or a recommendation; and not merely informational in nature, the same is in any event provided with the intention of being for general circulation and availability only. As such it is not intended to and does not form part of any offer or recommendation directed at you specifically, or have any regard to the investment objectives, financial situation or needs of yourself or any other specific person. Before committing to a trade or investment therefore, please seek advice from a financial or other professional adviser regarding the suitability of the product for you and (where available) read the relevant product offer/description documents, including the risk disclosures. If you do not wish to seek such financial advice, please still exercise your mind and consider carefully whether the product is suitable for you because you alone remain responsible for your trading – both gains and losses.

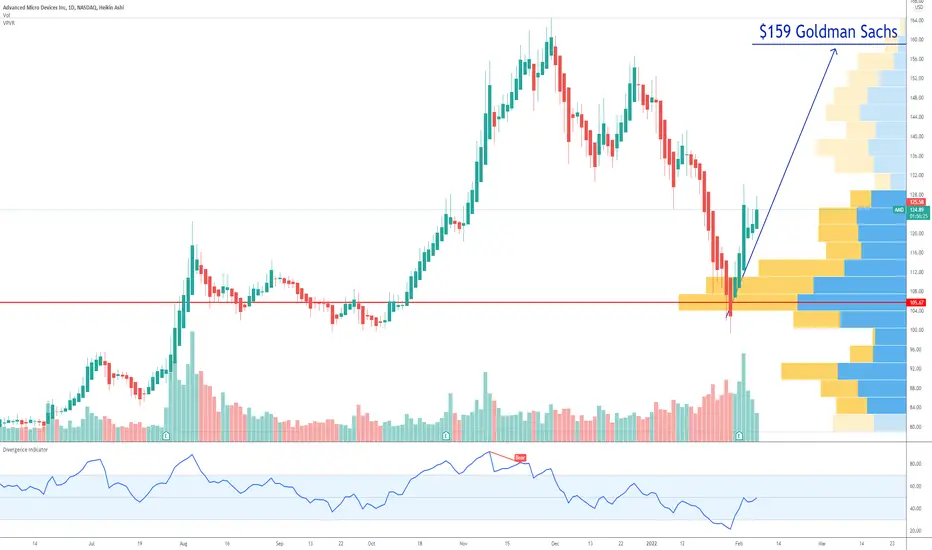
AMD Set Price Target by Goldman Sachs If you haven`t bough the January 2021 retracement here:
Then you should know that on 2/2/2022, Toshiya Hari from The Goldman Sachs Group Set Price Target for AMD at $159.00.
Looking forward to read your opinion about it. When it will reach that price target.
Advanced Micro Devices Analysis 06.02.2022Hello Traders,
welcome to this free and educational analysis.
I am going to explain where I think this asset is going to go over the next few days and weeks and where I would look for trading opportunities.
If you have any questions or suggestions which asset I should analyse tomorrow, please leave a comment below.
I will personally reply to every single comment!
If you enjoyed this analysis, I would definitely appreciate it, if you smash that like button and maybe consider following my channel.
Thank you for watching and I will see you tomorrow!

AMD oversold at January 2021 level | Buy areaAMD recently touched the January 2021 high and it`s oversold while the earning are growing.
This dip looks like a great buy opportunity in my opinion.
The buy area is between $95 to $105
The short term upside is $118
Looking forward to read your opinion about it!

Advanced Micro Devices (NASDAQ: $AMD) Is Down 36% From ATH PriceAdvanced Micro Devices, Inc. operates as a semiconductor company worldwide. The company operates in two segments, Computing and Graphics; and Enterprise, Embedded and Semi-Custom. Its products include x86 microprocessors as an accelerated processing unit, chipsets, discrete and integrated graphics processing units (GPUs), data center and professional GPUs, and development services; and server and embedded processors, and semi-custom System-on-Chip (SoC) products, development services, and technology for game consoles. The company provides x86 microprocessors for desktop PCs under the AMD Ryzen, AMD Ryzen PRO, Ryzen, Threadripper, AMD A-Series, AMD FX, AMD Athlon, AMD Athlon PRO, and AMD Pro A-Series processors brands; microprocessors for notebook and 2-in-1s under the AMD Ryzen, AMD A-Series, AMD Athlon, AMD Ryzen PRO, AMD Athlon PRO, and AMD Pro A-Series processors brands; microprocessors for servers under the AMD EPYC and AMD Opteron brands; and chipsets under the AMD trademark. It also offers discrete GPUs for desktop and notebook PCs under the AMD Radeon graphics and AMD Embedded Radeon brands; professional graphics products under the AMD Radeon Pro and AMD FirePro graphics brands; and Radeon Instinct and AMD Instinct accelerators for servers. In addition, the company provides embedded processor solutions under the AMD Opteron, AMD Athlon, AMD Geode, AMD Ryzen, AMD EPYC, AMD R-Series, and G-Series processors brands; and customer-specific solutions based on AMD CPU, GPU, and multi-media technologies, as well as semi-custom SoC products. It serves original equipment manufacturers, public cloud service providers, original design manufacturers, system integrators, independent distributors, online retailers, and add-in-board manufacturers through its direct sales force, independent distributors, and sales representatives. Advanced Micro Devices, Inc. was founded in 1969 and is headquartered in Santa Clara, California.

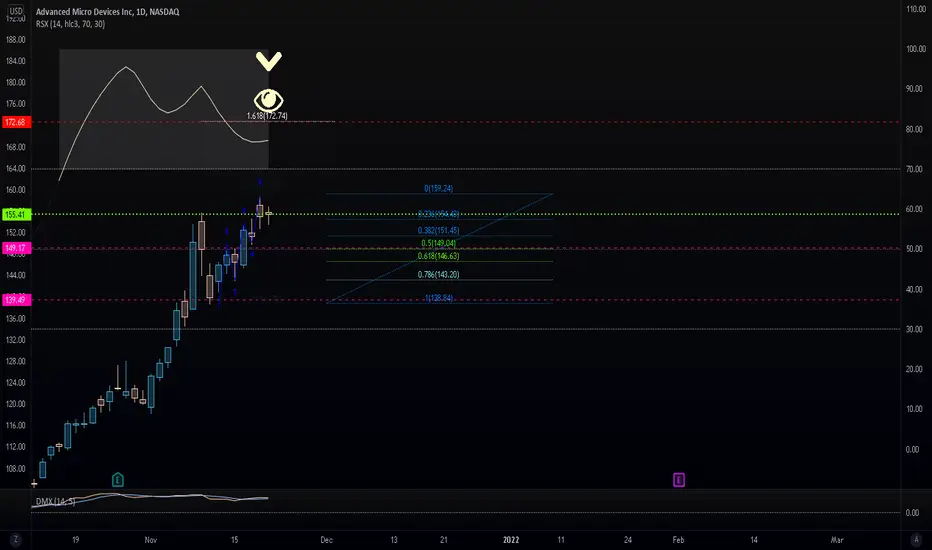
AMD Post Recovery. AMDImmediate targets 144, 155 and then 164. Invalidation at 172
We are not in the business of getting every prediction right, no one ever does and that is not the aim of the game. The Fibonacci targets are highlighted in purple with invalidation in red. Fibonacci goals, it is prudent to suggest, are nothing more than mere fractally evident and therefore statistically likely levels that the market will go to. Having said that, the market will always do what it wants and always has a mind of its own. Therefore, none of this is financial advice, so do your own research and rely only on your own analysis. Trading is a true one man sport. Good luck out there and stay safe!

$AMD | UPDATE$AMD 1D
Same view as Apple, looking for a potential reversal and 5 waves down to complete the corrective cycle in the low $120s.

$AMD | WEEKLY WATCHLIST 1/10$AMD 1D
Zigzag for Wave 2 in a huge nested 1-2 setup. Watching the $115-124 region for an incredible dip buy opportunity.
If > $113, we can see $200 by EOY.

$AMD possible short scenarioAMD obviously is in a uptrend, but right now we are seeing a little correction (possibly about 28%). I am positive that the current (possible) LH will lead to a drop to the support level (labeled), from there we could either see a 1)bounce or a 2)break.
1) Bounce:
... could lead to another LH which will extend to the red rectangle (resistance), followed by another (rather sharp) drop, which will most likely break the first level of support. At the next level of support (TP for my trade) the correction will most likely come to an end (since we choose this support level by combining a trend line (based on prev Ls) and a major support level (previous Hs and Ls + wicks), which is a pretty solid indicator for buy orders being placed around there). This trade will give me a 3.33:1 RRR, which I am satisfied with (1.5% risk --> 4.995% gain).
2)Break:
... could lead to a retest of the broken support (labeled as support). In this case I would rather not go short, since there will be a bigger risk of wicks (hitting my S/L). My strategy for this scenario is to wait it out and miss the juicy short selling gains, and enter a long position on the previously mentioned 2nd support, which is more reliable than the first (labeled) support.
As always: no financial advice

$AMD | WEEKLY WATCHLIST 12/27$AMD 1D
Made a new local high last week, further confirming my bull thesis. Now, looking for a small pullback into the mid-high $130s for a buying opportunity to $159.

$AMD | WEEKLY WATCHLIST 12/20$AMD 1D
Lots of charts look like this. Holding wave 2 fib support. As long as these levels hold, looks like a btfd opportunity. HEAVILY depends on how overall markets react.

$AMD | WEEKLY WATCHLIST 12/13$AMD 4H
We must hold the $136-137 area, otherwise further correction will be needed. Really want to see an explosive move out of this zone early in the week to support this bottoming thesis.

Advanced Micro Devices Analysis 04.12.2021Hello Traders,
welcome to this free and educational analysis.
I am going to explain where I think this asset is going to go over the next few days and weeks and where I would look for trading opportunities.
If you have any questions or suggestions which asset I should analyse tomorrow, please leave a comment below.
If you enjoyed this analysis, I would definitely appreciate it, if you smash that like button and maybe consider following my channel.
Thank you for watching and I will see you tomorrow!

Possible lagging diagonal on AMD. AMDWe called this one too early last time. Zooming on this one excessively, shows that we might be completing a lagging diagonal. In this case this may be a Wave C in an upward zigzag. Now, we are banking on actual motion down. Let's get Fibonacci to give us some goals.
We are not in the business of getting every prediction right, no one ever does and that is not the aim of the game. The Fibonacci targets are highlighted in purple with invalidation in red. Fibonacci goals, it is prudent to suggest, are nothing more than mere fractally evident and therefore statistically likely levels that the market will go to. Having said that, the market will always do what it wants and always has a mind of its own. Therefore, none of this is financial advice, so do your own research and rely only on your own analysis. Trading is a true one man sport. Good luck out there and stay safe!


$AMD | TRADE IDEAAdjusted my AMD count and this one makes more sense to me now. Looks like a larger nested 1-2 count instead of a 3-4 from the falling wedge area. This makes the count much more bullish and aligns a bit better with current price action.
As long as $118 low holds, I expect $146 target.

Easy Swing opportunity AMD-Swing opportunity here for an ATH break looks like one day we bounced off resistance but we will come to retest this price point
- Will look to take an entry as soon as we have confirmation for a breakout.

AMD semiconductor beastAMD has been unstoppable over the last few years, and this last shake out of the market has been a testament to its momentum.
Perfect bull flag break out running to ATH and now looking for the cup and handle style break out in trend which often follows months long bull trend.
The market is set up well and my next targets for taking profit is around 133 and 145 over coming months.
