AMD Daily TimeframeSNIPER STRATEGY
This magical strategy works like a clock on almost any charts
Although I have to say it can’t predict pullbacks, so I do not suggest this strategy for leverage trading.
It will not give you the whole wave like any other strategy out there but it will give you huge part of the wave.
The best timeframe for this strategy is Daily, Weekly and Monthly however it can work any timeframe above three minutes.
Start believing in this strategy because it will reward believers with huge profit.
There is a lot more about this strategy.
It can predict and also it can give you almost exact buy or sell time on the spot.
I am developing it even more so stay tuned and start to follow me for more signals and forecasts.
Advancedmicrodevices

Why Do People Trade SD Wrong?!You are taught to " Buy the dip ".
You are told " The trend is your friend "
But what is the dip and what is the trend, subjectivity destroys traders every single day.
I see so many traders trading supply and demand zones so reckless .
Every trader I watch just marks random zones and calls them supply and demand.
What is that?
When picking a supply or demand zone there are specific things you need to take into consideration in order to make real wealth when trading.
NTS specializes in supply and demand zones as you may have seen verifiable in many of my ideas.
But it is not just about supply and demand zones, if it was then everyone would be making money today!
There are certain things your psychology must overcome for you to start making any real profit.
So ask yourself, in order to trade supply and demand zones effectivley, have I actually put in the psychological work in order to truly benefit from the market?

AMD Buy LevelsMid July I posted a bullish idea on AMD and how the $93.50 level approximately was the level we wanted to watch as being key to AMD retesting and breaking previous all time highs.
Well AMD broke and found support at the $93.50 price level and upon doing so the price sky rocketed from that exact point and found itself on every news network this week that covers equities.
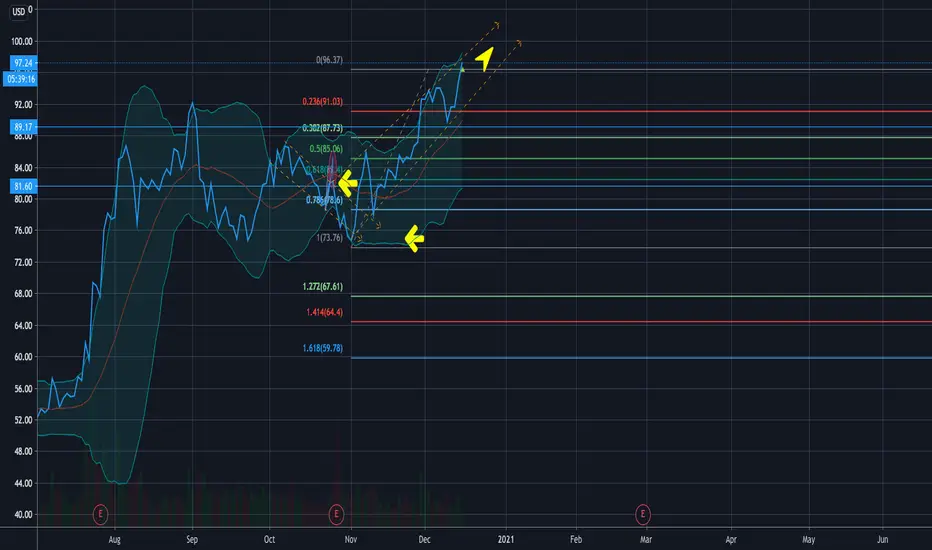
A pullback as we can see was very likely as a rejection at exactly the 1.618 Fibonacci extension level.. a very common rejection/reversal area after an asset smashes through all time highs and runs up in price. And now we see it struggling and getting rejected at the classic .786 fib level as well, typically the final blow of a parabolic runup in price.
NVDA is an asset that just weeks ago did the same thing and presented what has been a wonderful trade so far for those who have followed my idea on it by buying the pullback.
We are still in that NVDA trade currently and the same things I spotted in NVDA long before its drop and subsequent pump are some of the same things I am now spotting in AMD.
Looking both left and right, if you observe the color coded horizontal Fibonacci levels, we see confluence with a few overlapping lines. This is not coincidence and is in reality a very good sign as it adds credit to the idea that other smart traders are observing and trading these same horizontal levels of Fibonacci support.
I will be watching this closely in the coming days for a continued pullback which could bring it down to the $84 price level approximately.
Anyone who knows my ideas know that I wait patiently for a break of the .236 fib level on pullbacks, so I can then buy the breakouts of the .236 on the rebound back up. Which in this case means the price I will be sizing up a trade for will be $92 per share on AMD. This would be a nice 25% discount in price from its all time high set just a few days ago.
Also, there will be small trade opportunities at shallow fibonacci retracement levels for light positions but the real opportunities for an entry and low-risk trade will come at the lower fib levels as always.
Lastly, as I always point out, AMD does not HAVE to fall or go to these exact projected price levels. It is well within AMD's realm of possibilities to run higher in price.
However, given the runup that AMD has seen, and the strong rejection at a key area it is currently getting.. it is a high probability that the AMD dip has arrived and it is my belief that it will give patient traders a beautiful entry for another awesome trade here in the coming days and weeks.
Buy Levels
$122.41
$113
$106.12
$101.55
$97.17
$92.01
$84.24

AMD Buy?Its been a rough go for even the most bullish setups on equities lately due to the rocky nature of the macro with recent news of further inflation fears. Nonetheless we continue to hunt for the setups if not for the gains, then most definitely for the learning lessons that the markets can teach us.
For this asset, we keep things simple by keying in on an uptrend that has been supporting AMD since May.
It is expected that eventually this trend will break, but for now as long the price remains in the trend, buy opportunities exist at the green upward sloping trendline.
Once the green sloping line is broken, this will be our time to begin preparing for an exit.
The yellow line will be the first level of support should the trend be broken, but ultimately the bears will want to break the red line at $87.86 to confirm.
For the bullish case, continue to expect bounces at the green trendline of support until a full body candle closes outside of it on the daily and weekly time frames. A wise profit taking area will be around $93.50. If that level is broken and held as support, a retest of all time highs could be instore for AMD.

BUY AMD CALLSAMD looking good, just bought a weekly call going to roll it over into a min 3 month option or maybe some really far out OTMs , Well see

AMD - Bearish for nowHello traders!
AMD doesn’t seem encouraging to me unless we close above the yellow trendline. Otherwise, I believe it will soon test the bottom of the channel that it happened to be the lower Bollinger band at around $74.5 before it bounces back to the 80’s.
Good luck


$AMD Return to the mean, 20-40% profit over the next quarter.Pretty simple trade setup here, expecting us to return to the middle of this channel quicker than previously, in as little as 20 days, as long at 50 days. Price target $100-$110.
Take profit at $100: 25% gain
Take profit at $110: 37.5% gain

AMD Stock 11/03/21 Analysis 4H ChartNASDAQ:AMD (ADVANCED MICRO DEVICES: AMD )
- Trend Analysis -
📑Value: 8/20
📈Growth: 20/20
💰Profitability: 20/20
🚀Momentum: 8/20
💸Earnings: 16/20
🖇️Total Score: 72/100


AMD - Buyzone with CAD and TargetsAMD
BUYZONE = 83 - 88
CAD (Cost Avg Down) = 75
1st Target = ATH
2nd Target = 113
3rd Target = 123
HODL Target = 137
______________________________________________________________________________________________________________________
This content is for informational, educational and entertainment purposes only. This is not in any way, shape or form financial or trading advice.
Good luck, happy trading and stay chill,
2degreez


$AMD Analysis Going into 1/12/21 (CES Event) 1/11/2021-1/14/2021Video breakdown going into 1/12/21. $AMD Event tomorrow AMD Keynote
TUESDAY, JANUARY 12
|
11:00 AM - 12:00 PM EST
DURATION 60 MINUTES
AMD President and CEO Dr. Lisa Su will keynote during CES 2021, presenting the AMD vision for the future of research, education, work, entertainment and gaming, including a portfolio of high-performance computing and graphics solutions."


$AMD Support and Daily Potential Projection (Still Long)$AMD is trending down after a strong open.
It still remains well above the support line in its trading channel. The 97.8 top out could be re-realized with an afternoon run.
A partial-exit above 99 is not a terrible idea, but who knows what these fingers will do if that level is quickly reached.
This remains a LONG LONG LONG, and nothing has failed in the trade channel, even with this potential midday pullback we might just see.
GL, etc.
-BDR
Note: See attached idea Re: Support above 97 and also the original LONG call. Thanks!

$AMD Day Trade: Strong (QUITE STRONG) support @ 97.1--LONG!$AMD Advanced Micro Devices is establishing a very strong support level on dips @ 97.1 per share.
We're still MEGA LONG On this, but the positive is the bottom refuses to fall out after a big pre-market gain: Yet another major bullish indication.
GL, ride the waves, do whatever.
See attached idea for the Long Call earlier this AM.
BDR


$AMD BUY NOW? OR WAIT?Breaking down AMD in this video to see were we might head! Im off to take a nap!

AMD found a strong supportAMD Advanced Micro Devices has found a strong support on the middle line between 2/1 and 3/1 gannfan and on the middle line between 0.618 and 0.5 fib which is also a prior support level from the move up at 74.28$. AMD made a double bot at those levels and had a very strong move to break the prior highs making new highs and with that a higher low higher high bullish structure. Next stop will be at the 50sma 2/1 line but if the momentum stays as strong as it is now it will break through it and retest it in a very short time and continue up from there. Price target is the 1.618 fib level (81.80$ level) -> 2.618 (86.59$ level) at first.
The second price target will be hit after the 50sma retest and from there we will go to the prior highs

AMD found support and is ready to go up from its pullbackAMD found a strong support on the 2/1 gann fan line aswell as on the 0.618 fib level from which it will not continue going up to the main 1/1 gann line into the 1.618 fib level ($107). Momentum also shifted strongly indicating a strong reversal point around those key levels - that support is also a double bot and we are not on the second leg of the W

Advanced Micro Devices (AMD) Technical Analysis - GO LONG Info:
The AMD Ryzen and the Intel Core CPUs offer similar performance, the former being better at multi-tasking while the latter are faster when it comes to single-core tasks. However, Ryzen CPUs tend to offer better value for your money.
Technical Analysis - The idea is to go long following the major bullish trend.
Fundamental Analysis - Good News as per below info - Go long.
Advanced Micro Devices (AMD)
AMD’s processors have become a mainstay in the PC market and its expansion into gaming and data centers provides ample room for growth. The company competes alongside the likes of Nvidia and its CPUs are outshining rival and industry titan Intel (INTC - Free Report) . For instance, the announcement of its new 7nm Ryzen desktop processors on July 21 helped send its stock to new highs, only a week before it posted strong second quarter results.
AMD’s quarterly sales surged 26% and it raised its guidance, which is no easy task at the moment. The firm is also set to benefit from the holiday 2020 launches of the and next-generation Xbox and PlayStation and its cloud-focused chips are being used by Microsoft (MSFT - Free Report) and others. And the good news kept coming, when AMD announced on August 4 the “availability of new AMD Radeon Pro 5000 series GPUs for the updated 27-inch iMac.”
Looking ahead, our Zacks estimates call for AMD’s fiscal 2020 sales to surge 32%, to easily top FY19’s 4% jump, as well as FY18’s 23% and FY17’s 22%. AMD’s FY21 revenue is then expected to jump another 20% higher. Meanwhile, its adjusted earnings are projected to soar 72% this year and 46% next year.
AMD is a Zacks Rank #3 (Hold) at the moment, with its bottom-line estimates up big since its report. The chip firm’s shares have soared 50% since July 21 and they climbed to new highs once again Thursday—all part of an epic five-year run that still appears to have legs.
