Explosive Performance As support Never Broke. Rising Wedge(AMD)We were analyzing this one about a month ago with signs of it Squeezing under the most recent horizontal high as it ranged sideways towards long term support.
Major explosive bull movement breached the high and now is proceeding to play the top range of the massive rising wedge on a 3day chart.
I'm mainly interested in playing the breakouts of the major s&r levels on this one.
Stay tuned.
Advancedmicrodevices

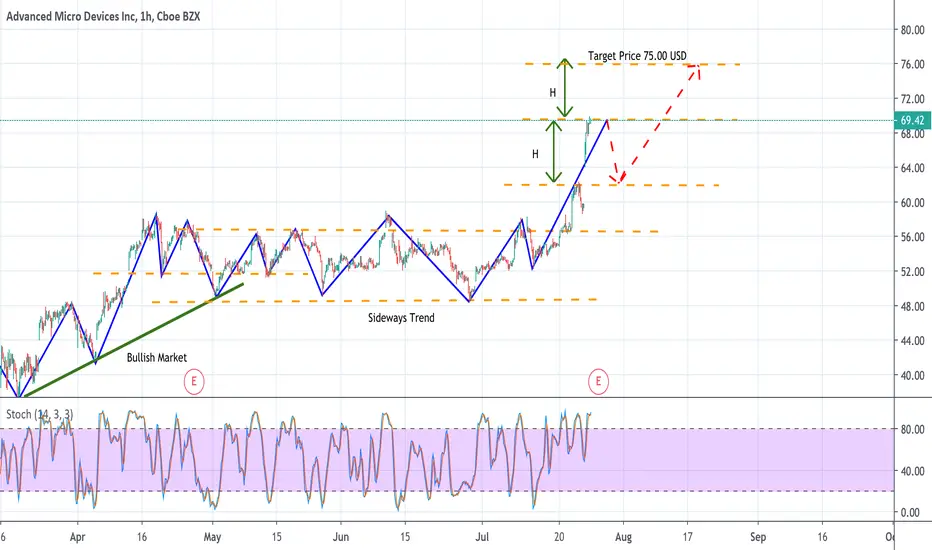
AMD - Advanced micro devices Technical AnalysisNASDAQ:AMD
The Idea is to go long - a price retracement might happen soon.
Prices have been moving sidewise for a while - it can be seen as a pause to the market before resuming its previous bullish trend.
The rally is due to the good performances/results in the super fast chip development (bringing the attention of investors).


Advanced Micro Devices $AMDEntry. $57.08
S/L $54.25
TP $63
12 months Consensus Price Target: $51.97
if you find my charts useful, please leave me "like" or "comment".
Please don't trade according to the ideas, rely on your own knowledge.
Thx

Looks like everything was hit by a bus today. Is it still a good set up for the trade above or the direction will change??

Advanced Micro Devices forming handler $AMDAfter it hit the pivot, it is pulling back now and forming a handle.

AMD: Bullish Cup and Handle Formation 4H (Apr. 23)X FORCE GLOBAL ANALYSIS:
AMD (Advanced Micro Devices) has shown incredible bullish momentum over the past year. In this analysis, we take a purely technical approach, exploring the bullish evidence for a further breakout.
Technical Analysis
- We have spotted a traditional reverse head and shoulders pattern on the 4H chart
- This pattern has been supported by a parabolic trend line support
- We have seen a small correction after the formation of the right shoulder, which could be interpreted as the handle pattern
- Despite the correction, the Relative Strength Index (RSI) continues in an uptrend, creating higher lows and higher highs
- The Moving Average Convergence Divergence (MACD) also shows a clear uptrend, with a potential golden cross
What We Believe
Though not stated in this analysis, we believe that AMD is a stock with strong fundamentals, and a lot of bullish potential based on short term technicals as well.
Trade Safe.

Advanced Micro Devices $AMDIt looks like #Advanced Micro Devices is forming cup w handle. $58.63 is the breakout resistance.

AMD Nears Top of ChannelThis is a simple analysis of AMD. It looks like the price is near the top of a very steep channel on the weekly chart. Although we could overshoot the channel, odds are the price stays contained within imo, but I don't know the future.
Look for areas where the risk reward is your favor and make your move.

Advanced Micro Devices $AMD#AdvancedMicroDevices formed H&S bottom and broke the resistance out. The target is now $59.27


Advanced Micro $AMDEven though #AdvancedMicro didn’t sell off too much, it is like holding in the air. #RSI is weak and may pull back

AMD? Sp500? Nasdaq?I see the fundamentals but I dont see how these prices can be sustainable technically, by the chart its either bulls pushing the limits, or large/more buyers getting in; both making the correction (if any) all that more severe. Looking at past of AMD the M chart doesn't seem to reassure. By the chart its positioned to correct due to being seemingly over extended, especially considering the correlation to SPX500. However, both have shown resilience over the recent past.
I am trying hard to resist the temptation to jump on the wagon here, as 54 still offers upside fundamentally. Either it:
1. Continues and maintains these levels
a) Large investment holds withstanding selling pressure.
b) New buys cash out sellers.
c) Renewed buying pressure from old buyers/ FOMO
2. Follow through of weak points
a) Temporary buying pressure subsides/ sell-off
b) Change in investor perception/ limit reached.
However, I imagine if money remains on the table these levels could be held artificially, all that considered its difficult for me to see past the technical with this one at the moment and I will try hard to resist the temptation to get in.
W:
M:

AMD is a buy at ~$39-40This virus has been rattling the markets hard, but don't forget that the demand for chips is not going away.
I'll be waiting for the .618-.65 fib region of price action support (green zone) and will go long from there for a nice snapback rally.

Hey AMD its time to calm downLook to the severe break in the northern bollinger band as an indicator to signal you to take your profit in AMD
'Bout to break down hard from the resistance of broadening wedge

AMD approaching to Historical Key Level.Soon we can watch a reaction of the price on a Historical Level 42.70.
Potentially it can bounce down to 34.26.
Push like if you think this is a useful idea!
Before to trade my ideas make your own analyze.
Write your comments and questions here!
Thanks for your support!

AMD Breaks to UpsideAMD has confirmed its breakout to test the previous yearly highs of 2000 and 2006. These highs are very strong resistance.

AMD Pro Trader Run Breaks Above ResistanceBuybacks and Pro Trader activity drove AMD to a new high with a velocity run.

AMD Forms Slip-Slide DowntrendOnce again, AMD has failed to break to a new higher high. Heavy Dark Pool Quiet Rotation™ is thwarting upside action at this time.


Priceline of ADVANCED MICRO DEVICES INC A good short opportunityPriceline of ADVANCED MICRO DEVICES INC has crossed up the consolidation level of $33.37.
Now the RSI and MACD are turning bearish.
The price action can touch the last consolidation level again and test it as a support at $33.37 and then it will move up as we have strong support of moving averages beneath the price action
Regards,
Atif Akbar (moon333)
